
Key issues
- For the week ending 1 March 2023, storms have resulted in heavy rainfall across northern parts of the country with weekly totals exceeding 150 millimetres from the eastern Kimberley (Western Australia), through the Northern Territory Top End and the Cape York Peninsula (Queensland).
- Little to no rainfall was recorded in the cropping regions over the past 7 days. Ongoing dry conditions across most summer cropping regions would have allowed for uninterrupted access to fields for crop maintenance activities and for the harvesting of early sown crops. However, in regions with below average soil moisture levels, little to no rainfall is likely to have negatively affected the growth and yield potential of late sown summer crops (see Section 1.1).
- Rainfall during February 2023 was slightly above average for Australia as a whole. However, February rainfall was below average across most cropping regions in Queensland, northern and southern New South Wales, eastern South Australia and in the western half of the Western Australia (see Section 1.2).
- Summer rainfall has been variable across Australia but was 27% above the long-term average for Australia as a whole. A La Niña event throughout the summer contributed to above average rainfall for parts of Queensland, with some regions recording their highest total summer rainfall on record. Summer rainfall has been above average in the north, but below average across much of southern Australia, including north-eastern New South Wales, south-eastern Queensland and southern Western Australia. (see Section 1.3).
- For the 3 months to February 2023, above average rainfall totals and mild summer temperatures resulted in average to well above average pasture production for this time of year across most grazing regions. Average to extremely high pasture production across central New South Wales, much of Queensland, parts of South Australia, southern Victoria, western Tasmania, northern Western Australia and much of Northern Territory is likely to have enabled farmers to continue rebuilding stock numbers and provide opportunities to replenish fodder supplies during early summer (see Section 1.5).
- Over the 8-days to 9 March 2023, rainfall totals exceeding 150 millimetres are expected across northern tropic of Australia. Rainfall totals in excess of 50 millimetres are expected for the Kimberly region of Western Australia, the Cape York Peninsula of Queensland, and for western Tasmania. Little to no rainfall is forecast for the remaining areas of Australia for the next eight days (see Section 1.6).
- Water storage levels in the Murray-Darling Basin (MDB) decreased between 22 February 2023 and 1 March 2023 by 237 gigalitres (GL). Current volume of water held in storage is 22 816 GL which represents 90 per cent of total capacity. This is 2 percent or 408 GL more than at the same time last year.
- Allocation prices in the Victorian Murray below the Barmah Choke decreased from $15 per ML on 23 February 2023 to $9 per ML on 2 March 2023. Prices are lower in the Murrumbidgee due to the binding of the Murrumbidgee export limit.
Climate
For the week ending 1 March 2023, a tropical low-pressure system brought storms and heavy rainfall to the northern tropics of the country with weekly totals exceeding 150 millimetres from the northern Kimberley (Western Australia), through the Top End of the Northern Territory and the Cape York Peninsula (Queensland). Meanwhile, weekly rainfall totals of between 25 and 100 millimetres were recorded along coastal New South Wales, northern and central Western Australia, and parts of Tasmania.
Little to no rainfall was recorded across the cropping regions over the past 7 days. Ongoing dry conditions across most summer cropping regions would have allowed for uninterrupted access to fields for crop maintenance activities and for the harvesting of early sown crops. However, in regions with below average soil moisture levels, little to no rainfall is likely to have negatively affected the growth and yield potential of late sown summer crops.
Rainfall for the week ending 1 March 2023
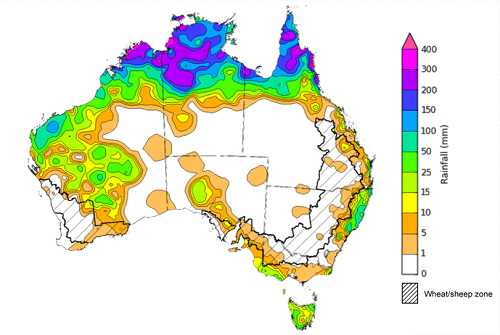
Note: The rainfall analyses and associated maps utilise data contained in the Bureau of Meteorology climate database, the Australian Data Archive for Meteorology (ADAM). The analyses are initially produced automatically from real-time data with limited quality control. They are intended to provide a general overview of rainfall across Australia as quickly as possible after the observations are received. For further information go to http://www.bom.gov.au/climate/rainfall/
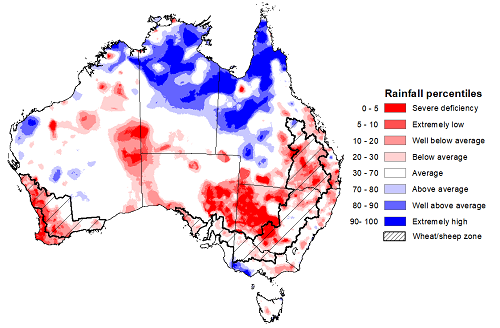
For Australia as a whole, rainfall during February 2023 was around 4% above the 1961-1990 average. Rainfall was above average for much of the Northern Territory away from the southern districts, most of north-western Queensland and the Cape York Peninsula, and for south-west Victoria, and a pocket of northern and central Western Australia. For both Queensland and the Northern Territory, area-averaged February rainfall was the highest since 2014. In contrast, rainfall was below average for much of eastern and southern Queensland, New South Wales extending into adjacent eastern South Australia, parts of northern and eastern Victoria, the Southwest Land Division and much of the interior of Western Australia, extending to the Nullarbor coast and coastal South Australia.
Rainfall across Australia in February was likely influenced by a weakening La Niña in the tropical Pacific, and monsoonal activity across the north associated with a pulse of the Madden-Julian Oscillation.
February rainfall was below average across much of the cropping regions in Queensland, northern and southern New South Wales, eastern South Australia and in the western half of the Western Australia. Average February rainfall was recorded across the remaining cropping regions. These below average falls have likely negatively affected the growth and yield prospects of later sown summer crops in Queensland and northern New South Wales.
Rainfall percentiles for February 2023
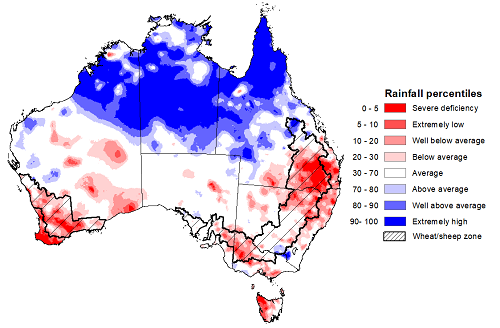
Summer rainfall was variable across Australia but was 27% above the long-term average for Australia as a whole. Much of northern Australia experienced a wetter than normal summer, while large areas of eastern and southern Australia recorded below average rainfall over summer as the influence of La Niña started to wane. Despite the influence of the 2022-23 La Niña event starting to wane during summer, parts of Queensland recorded extremely high rainfall, with some regions recording their highest summer rainfall total on record. However, high pressure systems and weaker than average westerly winds to the south led to below average rainfall to many coastal regions in southern Australia.
The season began with above average rainfall during December for Australia as a whole, although much of the rainfall occurred across northern and western parts of Australia. The above average rainfall at the start of summer followed one of the wettest Novembers on record, boosting soil moisture levels across summer cropping regions. Continued rainfall into early January will have supported yield potentials through critical periods of flowering and grain filling for early sown crops, while dry conditions in late January and much of February allowed field access for harvesting activities.
Owing to the favourable soil moisture conditions at sowing, the yield potential of early sown summer crops across northern New South Wales and southern Queensland remains well above average despite extremely low rainfall over the summer period. However, the yield prospects for later sown crops have been reduced by the lack of summer rainfall. Timely and adequate rainfall during autumn will be critical to the ongoing development of dryland summer crops and prevent any further reduction in yields.
Rainfall percentiles for summer 2023 (1 December 2022 to 28 February 2023)
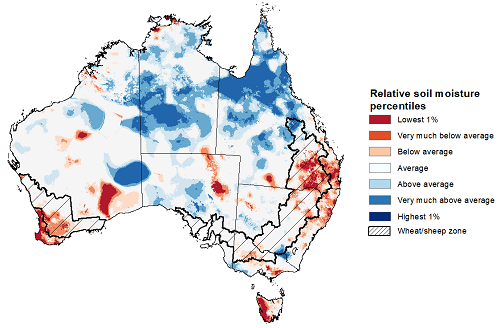
Modelled upper layer soil moisture for February 2023 was variable across Australia. It had significantly geographic differences between the north and south of Australia, reflecting the spatial pattern of rainfall during February 2023. Extremely low upper soil moisture was evident for south-eastern Queensland, parts of western New South Wales and southwest Western Australia, as well as parts of western Tasmania. Above average upper layer moisture was evident across far north and central Queensland, southern Victoria, the central and northern areas of the Northern Territory, parts of central and west Western Australia. Upper layer soil moisture was generally average elsewhere.
At this time of year, upper layer soil moisture is important for late planted summer crops in the Central Queensland growing region and for pasture growth across northern Australia since plant germination and establishment utilise this moisture. It is also an important indicator of the ability to access paddocks for crop harvesting and planting activities.
Upper layer soil moisture was extremely low to average for this time of year across most of cropping regions, except for the central New South Wales where it was above average. Low levels of upper layer soil moisture would have allowed paddock access to harvest early planted summer crops for northern cropping region. However, a lack of upper layer soil moisture is likely to have negatively affected the establishment and yield potential of later sown crops.
Modelled upper layer soil moisture for February 2023
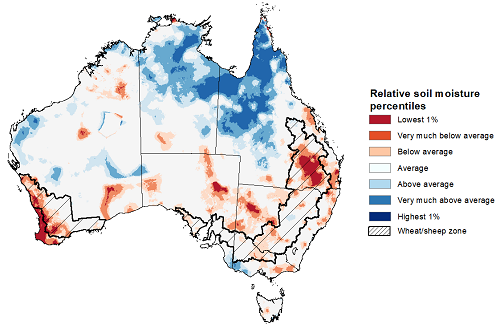
Source: Bureau of Meteorology (Australian Water Resources Assessment Landscape model)
Lower layer soil moisture for February 2023 was well above average to extremely high for this time of year across northern and central Queensland, much of the Northern Territory, parts of Western Australia, South Australia, Victoria and New South Wales.
Lower layer soil moisture is important to support summer crops and pasture growth during the peak growth period. In Australian cropping regions, lower layer soil moisture was extremely low in the southern Queensland and Western Australia, while it was average in the remaining cropping regions.
Modelled lower layer soil moisture for February 2023
December to February is the peak pasture growth period for northern Australia which typically provides the bulk of feed to maintain production through the low pasture growth months of the northern dry season. Across southern Australia, December to February pasture growth is typically low reflecting lower rainfall totals, high temperatures and high evapotranspiration rates at this time of year. Pasture availability during this period influences the growth, branding and marking rates of lambs and calves, livestock turnoff and the production of meat, milk, and wool.
For the 3 months to February 2023, above average rainfall totals and mild summer temperatures resulted in average to well above average pasture production for this time of year across most grazing regions. However, extremely low to below average pasture growth rates were recorded across southwest and central Western Australia, northern Victoria, across much of New South Wales, and in the southeast Queensland consistent with above average temperatures and/or below average rainfall.
Average to extremely high pasture production occurred across central New South Wales, much of Queensland, parts of South Australia, southern Victoria, western Tasmania, northern Western Australia and much of Northern Territory. This will likely enable farmers to continue to rebuild stock numbers and provide opportunities to build standing dry matter availability. Above average rainfall in southern Victoria would allow above average pasture availability and ample opportunities to conserve excess fodder.
Relative pasture growth for 3-months ending February 2023 (1 December 2022 to 28 February 2023)
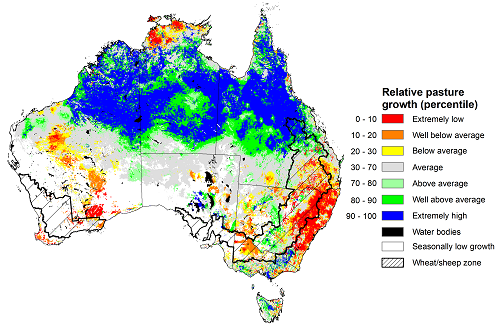
Source: Queensland Department of Science, Information Technology, and Innovation
Over the 8-days to 9 March 2023, a monsoon trough and embedded tropical low in northern Australia is expected to trigger intense rain and storms across Australia’s northern tropics. Meanwhile, low-pressure troughs across eastern Australia are expected to bring scattered rainfall to the eastern coast of New South Wales, Victoria and western Tasmania. A trough will bring showers in the northwest Western Australia. A high pressure system is bringing mainly dry conditions elsewhere.
Rainfall totals exceeding 150 millimetres are expected across the northern tropics of Australia. Rainfall totals in excess of 50 millimetres are expected for the Kimberly region of Western Australia, the Cape York Peninsula of Queensland, much of the north of the Northern Territory and for western Tasmania. Little to no rainfall is forecast for the remaining area of Australia for the next eight days.
Across Australian cropping regions, little to no rainfall is expected in the next 8 days. This would further improve access to the fields for crop maintenance activities and allow for the harvest of early sown crops to continue for the summer cropping regions in New South Wales and Queensland. If realised, continued dry conditions in regions with low levels of soil moisture is likely to lead to further yield reductions for late sown summer crops. The forecast rainfall over much of northern Australia is likely to benefit pasture growth rates and availability.
Total forecast rainfall for the period 2 March to 9 March 2023
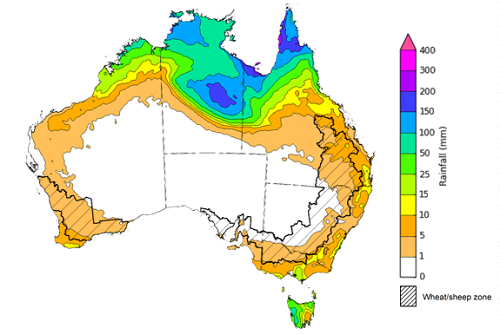
Note: This rainfall forecast is produced from computer models. As the model outputs are not altered by weather forecasters, it is important to check local forecasts and warnings issued by the Bureau of Meteorology.
Water
Water storages, water markets and water allocations - current week
The Tableau dashboard may not meet accessibility requirements. For information about the contents of these dashboards contact ABARES.

Commodities
Information on weekly price changes in agricultural commodities is now available at the Weekly commodity price update.