
Key issues
- For the week ending 23 March 2022, low-pressure troughs across northern and eastern Australia resulted in moderate rainfall in northern Australia and isolated falls in the south-east. In the south, high-pressure systems resulted in clear, dry conditions for large areas of central and western Australia, while cold fronts off the Southern Ocean produced moderate falls in Tasmania.
- Harvesting of early sown summer crops have continued across northern New South Wales and southern Queensland on the back of continued dry conditions. For late sown summer crops in Central Queensland, close to average soil moisture conditions have likely supported ongoing plant growth and development. For early sown summer crops with long growth periods, such as cotton, soil moisture levels have remained above average to average across most summer cropping regions, likely supporting boll filling in southern regions. Meanwhile, the dry conditions across northern regions have allowed harvesting of cotton to start.
- Atmospheric and oceanic indicators suggest that a La Niña remains active in the tropical Pacific. La Niña events typically increase the likelihood of tropical cyclones within the Australian region, as well as increasing the chances of above average rainfall across large parts of eastern Australia during autumn. The Madden-Julian Oscillation is also expected to influence rainfall patterns in Australia over the coming weeks, increasing the likelihood of above average rainfall across northern Australia, and also across tropical regions.
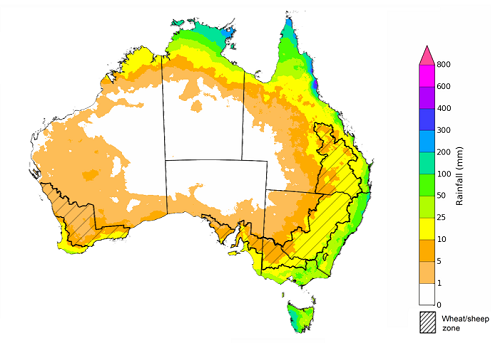
- The outlook for April 2022 indicates that there is a 75% chance of rainfall totals between 10 and 100 millimetres across eastern New South Wales, eastern and northern Queensland, eastern and southern Victoria, the far-north and far-south of Western Australia, the north of the Northern Territory and Tasmania. Rainfall totals in excess of 100 millimetres are expected in parts of northern Queensland, the north of the Northern Territory and western Tasmania.
- Over the 8-days to 31 March 2022, low-pressure troughs are expected to bring rainfall to eastern and northern Australia, with movement of Tropical Cyclone Charlotte off the west coast resulting in heavy rainfall in parts of Western Australia. Meanwhile, high pressure systems are expected to bring mostly dry conditions to central and southern Australia.
- Water storage in the Murray–Darling Basin (MDB) decreased by 287 gigalitres (GL) between 17 March 2022 and 24 March 2022. The current volume of water held in storage is 21,921GL, which represents 88 per cent of total capacity. This is 55% or 7,797 GL more than at the same time last year.
- Allocation prices in the Victorian Murray below the Barmah Choke decreased from $60 per ML on 17 March 2022 to $55 per ML on 24 March 2022. Prices are lower in the Goulburn-Broken, Murrumbidgee and regions above the Barmah choke due to the binding of the Goulburn intervalley trade limit, Murrumbidgee export limit and Barmah choke trade constraint.
Climate
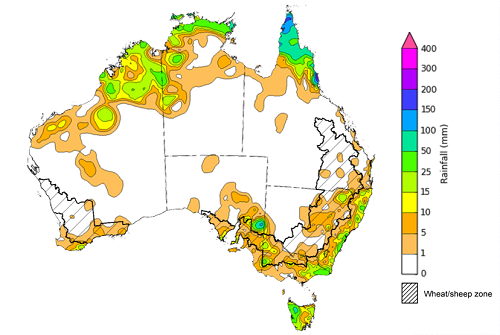
For the week ending 23 March 2022, low-pressure troughs across northern and eastern Australia resulted in moderate rainfall in northern Australia and isolated falls in the south-east. In the south, high-pressure systems resulted in clear, dry conditions for large areas of central and western Australia, while cold fronts off the Southern Ocean produced moderate falls in Tasmania.
Rainfall totals of between 10 and 50 millimetres were recorded across scattered areas of eastern New South Wales, eastern and western Victoria, the south-east of South Australia, as well as northern parts of Western Australia and the Northern Territory, and Tasmania. Rainfall totals in excess of 50 millimetres were recorded across northern Queensland. Remaining parts of Australia received little to no rainfall.
In cropping regions, rainfall totals of between 10 and 25 millimetres were recorded across isolated parts of New South Wales, Victoria and South Australia. Little to no rainfall was recorded across cropping regions in remaining parts of New South Wales, Victoria and South Australia, as well as Queensland and Western Australia.
Harvesting of early sown summer crops have continued across northern New South Wales and southern Queensland on the back of continued dry conditions. For late sown summer crops in Central Queensland, close to average soil moisture conditions have likely supported ongoing plant growth and development. For early sown summer crops with long growth periods, such as cotton, soil moisture levels have remained above average to average across most summer cropping regions, likely supporting boll filling in southern regions. Meanwhile, the dry conditions across northern regions have allowed harvesting of cotton to start.
Rainfall for the week ending 23 March 2022
Note: The rainfall analyses and associated maps utilise data contained in the Bureau of Meteorology climate database, the Australian Data Archive for Meteorology (ADAM). The analyses are initially produced automatically from real-time data with limited quality control. They are intended to provide a general overview of rainfall across Australia as quickly as possible after the observations are received. For further information go to http://www.bom.gov.au/climate/rainfall/
Throughout autumn the climate drivers with the largest potential impact on Australia’s climate patterns are the El Niño–Southern Oscillation (ENSO), Southern Annular Mode (SAM) and the Madden-Julian Oscillation (MJO). These climate drivers are likely to influence the growth and development of later planted summer crops in northern growing regions, pasture growth across both northern and southern Australia and planting opportunities for winter crops.
Atmospheric and oceanic indicators suggest that a La Niña remains active in the tropical Pacific. La Niña events typically increase the likelihood of tropical cyclones within the Australian region, as well as increasing the chances of above average rainfall across large parts of eastern Australia during autumn. The strengthening of trade winds in the western Pacific Ocean have delayed the decline of the current La Niña event. Nevertheless, the event is expected to dissipate over the coming months. Despite the easing of La Niña atmospheric and oceanic patterns, they are likely to continue influencing rainfall patterns in northern and eastern Australia over the coming months.
The MJO is also expected to influence rainfall patterns in Australia over the coming weeks, increasing the likelihood of above average rainfall across northern Australia, and also across tropical regions to Australia's north.
The Southern Annular Mode (SAM) is neutral and is forecast to remain neutral over the coming three weeks. A neutral SAM has little influence on Australian climate.
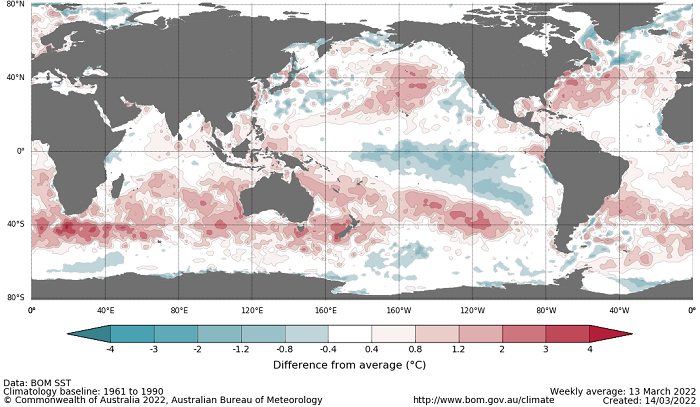
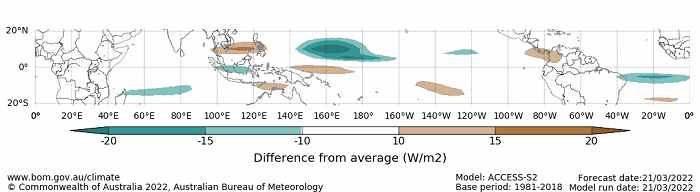
Below average sea surface temperature (SST) anomalies have continued to move eastward in the tropical Pacific Ocean over the past two weeks. SSTs in the equatorial Pacific are expected to begin warming as sub-surface waters become warmer, although the strengthening of trade winds have stalled this process. Current SST anomalies reflect typical La Niña patterns, with below average SST along the equator, and warm SST anomalies to the north and south.
Difference from average sea surface temperature observations 7 to 13 March 2022
International climate model outlooks for the NINO 3.4 region in April 2022
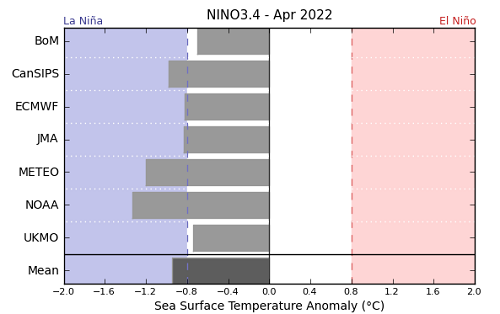
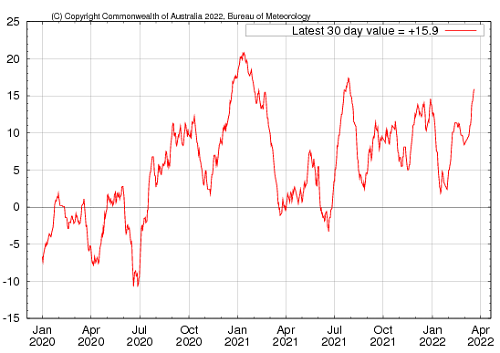
The La Niña event in the Pacific Ocean is now past its peak and is expected to continue to dissipate through autumn. Most climate models surveyed by the Bureau of Meteorology expect the La Niña event to continue into April due to recent strengthening in trade winds. However, only one of the seven models expecting it to remain active in June 2022. ENSO events are most active throughout spring and summer, then decay and return to neutral conditions in autumn. For the period ending 21 March 2022, the 30-day SOI was +15.9 and the 90-day SOI was +8.7, both above the La Niña threshold of +7. Above average SST anomalies have continued across parts of the Maritime Continent. Trade winds across the western tropical Pacific have increased in strength and remain stronger than average, while cloudiness near the Date Line has been consistently below average since June 2021.These indications are consistent with the ongoing La Niña event.
30-day Southern Oscillation Index (SOI) values ending 21 March 2022
As at 21 March 2022 a pulse of the Madden–Julian Oscillation (MJO) is strengthening over the Indian Ocean. Most climate models suggest the MJO is likely to progress eastwards into the Maritime Continent in the coming week. The MJO is a pulse of cloud and rainfall that moves eastward along the equator and increases the chance of above average cloudiness and rainfall across northern Australia.
Madden–Julian Oscillation (MJO) daily index
These climate outlooks are generated by ACCESS–S (Australian Community Climate Earth-System Simulator–Seasonal). ACCESS–S is the Bureau of Meteorology's dynamical (physics-based) weather and climate model used for monthly, seasonal and longer-lead climate outlooks.
For further information, go to http://www.bom.gov.au/climate/ahead/about/
The Bureau of Meteorology’s latest rainfall outlook indicated wetter than average conditions are expected across parts of northern and eastern Australia during April. The ACCESS-S climate model suggests there is close to a 60% chance of exceeding median April rainfall totals across parts of eastern Australia, and an 80% chance of exceeding median rainfall totals in parts of northern Australia.
The outlook for April 2022 indicates that there is a 75% chance of rainfall totals between 10 and 100 millimetres across eastern New South Wales, eastern and northern Queensland, eastern and southern Victoria, the far-north and far-south of Western Australia, the north of the Northern Territory and Tasmania. Rainfall totals in excess of 100 millimetres are expected in parts of northern Queensland, the north of the Northern Territory and western Tasmania.
Across cropping regions there is a 75% chance of rainfall totals of between 10 and 25 millimetres across most of New South Wales, Queensland, eastern and southern Victoria and isolated parts of South Australia and Western Australia. There is a 75% chance of rainfall less than 10 millimetres for western Victoria, as well as much of South Australia and Western Australia. The wetter than average conditions are expected to boost soil moisture levels and provide a favourable start to the winter season in most eastern Australian cropping regions and support late sown summer crops in Central Queensland. On the flipside, wetter than average conditions might limit field access and interfere with the timely planting of winter crops and harvesting activity for summer crops.
Rainfall totals that have a 75% chance of occurring April 2022
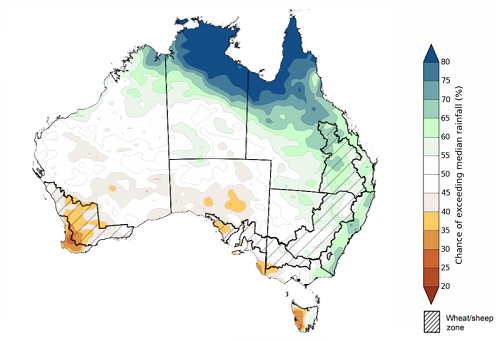
The rainfall outlook for April to June 2022 suggests there is a greater than 60% chance of exceeding median rainfall across coastal parts of New South Wales, much of south-central Queensland and far-northern parts of the Western Australia. For much of northern Queensland and the Northern Territory, there is a greater than 70% chance of exceeding median rainfall. Between April and June 2022, below average rainfall is expected for south-western Western Australia, isolated parts of Victoria and South Australia, as well as western Tasmania. For remaining regions of Australia, there is roughly an equal chance of above and below median rainfall (Bureau of Meteorology ‘National Climate Outlook’, 17 March 2022).
Bureau of Meteorology rainfall outlooks for April to June have greater than 55% past accuracy across most of Australia. Outlook accuracy is greater than 65% across large areas of eastern, northern and western Australia. However, there is low past accuracy for isolated parts of South Australia.
Chance of exceeding the median rainfall April to June 2022
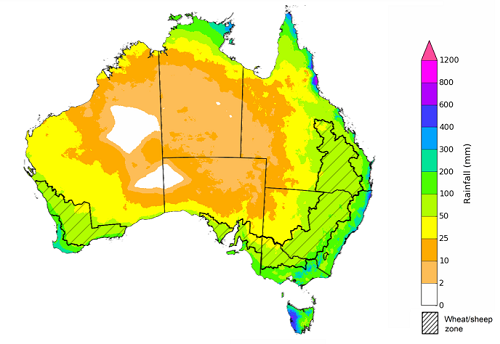
The outlook for April to June 2022 suggests there is a 75% chance of rainfall totals between 50 and 200 millimetres across much of eastern New South Wales, eastern and northern Queensland, much of Victoria, southern parts of South Australia, the south-west of Western Australia, northern parts of the Northern Territory and eastern Tasmania. Rainfall totals in excess of 200 millimetres are forecast for parts of New South Wales and Queensland, alpine regions of New South Wales and Victoria, northern parts the Northern Territory and western Tasmania.
Across cropping regions, there is a 75% chance of receiving between 50 and 100 millimetres across much of New South Wales, Queensland, southern Victoria, southern and western parts of South Australia and much of Western Australia. Totals of less than 50 millimetres are expected across remaining cropping regions in northern Victoria, the north-east of South Australia and isolated parts of Western Australia.
Root zone soil moisture levels are above average to average across most eastern and southern cropping regions but is below average to average in western cropping regions. The above average rainfall in eastern cropping regions is likely to support yield potentials for late sown summer crops in northern cropping regions, as well as aiding the germination and establishment of winter crops. However, the wetter conditions may limit field access, delaying harvesting and planting activity. In cropping regions of Western Australia, the expectation of below average rainfall over the next three months is likely to provide a less than ideal start to the winter cropping season, with a likely deterioration in soil moisture levels.
Rainfall totals that have a 75% chance of occurring April to June 2022
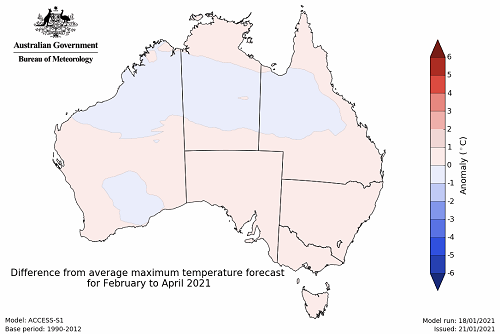
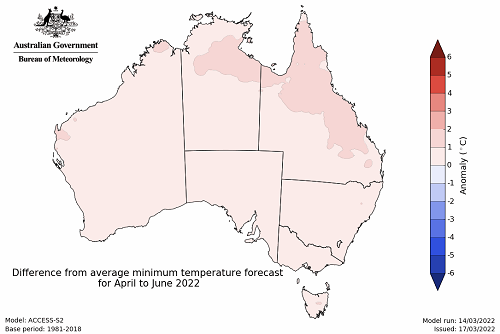
The temperature outlook for April to June 2022 indicates that maximum temperatures across most of Australia are likely to be close to the 1990-2012 average (- 1°C to 1°C). Minimum temperatures are expected to be slightly above average for parts of Queensland and the Northern Territory, and close to average for the rest of Australia (Bureau of Meteorology ‘National Climate Outlook’, 17 March 2022).
Predicted maximum temperature anomaly for April to June 2022
Predicted minimum temperature anomaly for April to June 2022
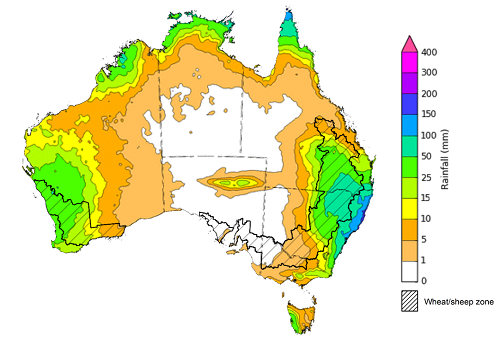
Over the 8-days to 31 March 2022, low-pressure troughs are expected to bring rainfall to eastern and northern Australia, with movement of Tropical Cyclone Charlotte off the west coast resulting in heavy rainfall in parts of Western Australia. Meanwhile, high pressure systems are expected to bring mostly dry conditions to central and southern Australia.
Rainfall totals of between 10 and 50 millimetres are forecast for eastern New South Wales, south-eastern and northern Queensland, parts of eastern Victoria, western and northern parts of Western Australia, western Tasmania, as well as central South Australia and the north of the Northern Territory. Rainfall in excess of 100 millimetres is expected for north-eastern New South Wales and northern Queensland.
In Australian cropping regions, rainfall totals of between 10 and 50 millimetres are expected across northern and central New South Wales, southern and central Queensland, as well as western and central Western Australia. Little to no rainfall is forecast for all remaining cropping regions during the next 8-days.
The wet conditions forecast across northern New South Wales and southern Queensland will likely interfere with harvesting of early sown summer crops. The rainfall may also delay senescence of summer crops with longer growth periods. However, the rainfall will boost soil moisture levels and support winter crops as planting gets under way in the coming months. Cropping regions of Central Queensland and southern New South Wales are expected to largely miss out on the heaviest of falls, but soil moisture levels in these regions remain close to average, which will support ongoing crop development. The forecast rainfall for western cropping regions will help boost soil moisture, where it is currently below average.
Total forecast rainfall (mm) for the period 24 March to 31 March 2022
Water
Water storages, water markets and water allocations - current week
The Tableau dashboard may not meet accessibility requirements. For information about the contents of these dashboards contact ABARES.

Commodities
Information on weekly price changes in agricultural commodities is now available at the Weekly commodity price update.