
Performance between 2000–01 and 2017–18
Author: Nathan Pitts
Introduction
ABARES publishes agricultural forecasts in the Australian crop report and Agricultural commodities publications. These cover domestic and global production, consumption, exports and commodity prices. ABARES bases these forecasts on economic and agronomic assessments of data and information from various sources—supported by discussions with industry experts, use of quantitative analytical tools and professional judgement. Observed outcomes can differ from forecasts for a number of reasons. The most apparent is when critical forecast assumptions are not realised and are revised in later publications.
Forecasts issued in September are used to examine historical ABARES forecast performance in this snapshot. These forecasts are issued with a minimum of 9 months remaining in the forecast financial year—depending on the availability of observations. Between 2000–01 and 2017–18, ABARES September forecasts have an average forecast error of:
- 11 per cent for total winter crop production.
- 2 per cent for total meat production.
- 10 per cent for global indicator prices averaged across major commodities.
- 6 per cent for the total value of agricultural exports.
- 15 per cent for export volumes averaged across major commodities.
Forecast errors generally decrease in later releases, when ABARES updates its previous assumptions to account for new information. Furthermore, total agricultural forecast error is lower than the forecast error of its components, due to lower forecast errors for major agricultural commodities.
[expand all]
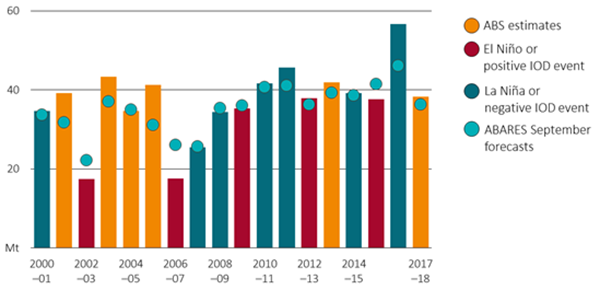
Winter crop production
Since 2000–01 September forecasts of total winter crop production have an 11 per cent forecast error and are downward biased by 1 per cent (this means that on average, ABARES underestimates winter crop production by 1 per cent). Forecast error is higher for seasons with significant climatic events, especially those influenced by the positive and negative phases of the El Niño–Southern Oscillation and Indian Ocean Dipole (IOD). If the seasons affected by an El Niño or positive IOD event are excluded, average forecast error decreases to 8 per cent. Forecast error is lower for growing seasons affected by a La Niña or negative IOD event since the crop production effects are generally smaller.
Compared to ABARES forecasts, a naïve model that uses a rolling 10–year average to forecast winter crop production has a significantly higher forecast error of 25 per cent. This is due to the variability of Australian winter crop production.
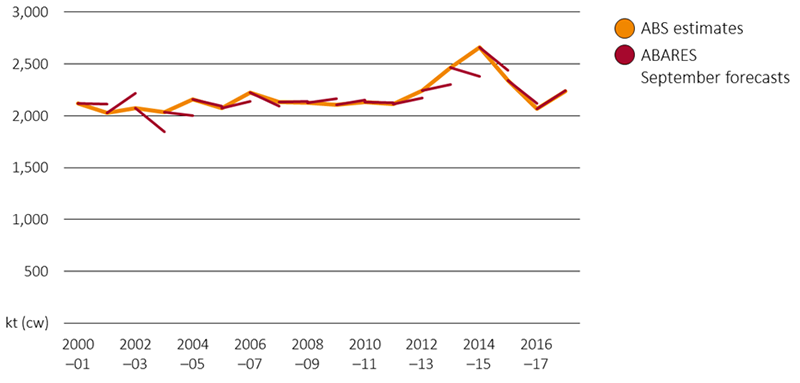
Livestock production
The forecast error for livestock production is lower than for crop production. This is because flock dynamics connect livestock production across years, reducing year-on-year fluctuations. Between 2000–01 and 2017–18, the total meat production forecast has a 2 per cent forecast error. The forecast errors for beef and veal (4 per cent), chicken meat (5 per cent), and lamb (4 per cent) are generally uncorrelated. Total meat production forecasts are downward biased by 1 per cent.
Indicator prices
Since 2000–01 September indicator price forecasts have an average forecast error of 10 per cent. Over this period, 64 per cent of all ABARES September price forecasts for major commodities were within 10 per cent of actual values, with 81 per cent within 15 per cent. This indicates that average forecast error is strongly influenced by a minority of observations with higher forecast error, partially due to higher average forecast errors for sugar. Price forecasts over this period were downwards biased by 2 per cent. Alternatively, if forecasts are made by a naïve model that uses the average of observed prices between July and September of that year, average forecast error increases to 19 per cent.
| Average forecast
error | Forecast bias a | Proportion of forecasts
within 10% of actuals | Proportion of forecasts within
15% of actuals | Naïve model forecast
accuracy b | |
|---|---|---|---|---|---|
| Wheat | 9% | -2% | 72% | 83% | 15% |
| Barley c | 10% | -2% | 61% | 78% | 21% |
| Canola d | 12% | 3% | 50% | 67% | 18% |
| Sugar | 18% | -1% | 50% | 67% | 37% |
| Cotton | 11% | -1% | 67% | 78% | 23% |
| Beef | 5% | -2% | 89% | 100% | 11% |
| Lamb | 10% | -4% | 67% | 83% | 12% |
| Wool | 9% | -5% | 67% | 83% | 16% |
| Milk | 9% | -5% | 56% | 89% | na |
Notes: a Forecast bias is defined as the average percentage difference between ABARES September forecasts and actual observations. b Naïve forecasts use the average of observed prices between July and September as a fiscal year forecast. c Before 2010–11, a US no. 2 yellow corn, fob Gulf series was used as the coarse grains indicator price rather than a barley indicator price. As a result, barley forecast accuracy accounts for accuracy of coarse grains prices between 2000–01 and 2010–11 and barley prices between 2011–12 and 2017–18. d Before 2010–11 a US no. 2 soybeans, fob Gulf was used as an oilseeds indicator price rather than a canola indicator price. As a result, canola forecast accuracy consists of oilseeds price forecasts between 2000–01 and 2010–11 and canola prices between 2011–12 and 2017–18.
With a high share of Australian agricultural production exported, returns to Australian producers are highly dependent on global market developments. Furthermore, forecast error is correlated across some commodities, due to global climatic conditions that have similar production impacts on multiple commodities. Forecast errors for corn, soybean and wheat indicator prices were highly correlated between 2000–01 and 2017–18 due to shared major producers across commodities and consistent feed demand drivers.
Export values and volumes
Export value errors can potentially arise from errors in export unit values and changes in export volumes. Forecasts of export values since 2000–01 have a forecast error of 17 per cent averaged across major commodities. There is an average forecast error of 14 per cent for total grains, oilseeds and pulses, 14 per cent for total meat exports and 6 per cent for total agricultural export values. Total agricultural export forecast error is lower than forecast error of its components because forecast error is largely uncorrelated across cropping and livestock industries. Export unit values—the trade weighted average of export prices – have had a forecast error of 11 per cent.
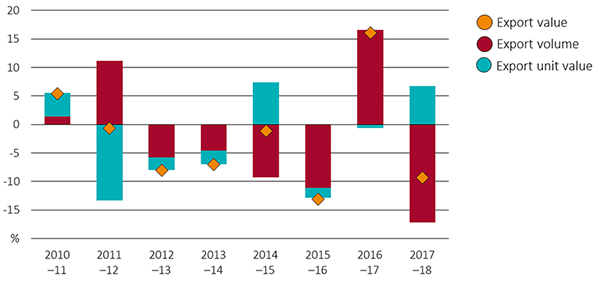
ABARES uses a number of indicators to assist in forecasting export unit values, including global and domestic prices. Forecast unit export values can diverge from those later observed because of exchange rate fluctuations and differences between export prices and other indicator prices, and differences in the timing of exports and domestic purchases.
Barley exports in 2017-18 provide an example of the influence of these factors. In 2017–18 Australian prices rose more than global prices due to low Australian production and strong feed demand from Australian livestock industries, combined with stringent biosecurity requirements for imports. Barley export unit values did not rise as much since most exports occurred in early 2017–18 when prices were lower, before high domestic feed prices led to reduced feed barley exports later in 2017–18. Different factors can have varying levels of influence on agricultural export prices. Between 2000–01 and 2017–18 the correlation between barley export unit values and the domestic feed barley indicator price was 72 per cent, with global indicator prices only 64 per cent, and for the AUD-USD exchange rate just 34 per cent.
Download the full report
Summary of ABARES agricultural forecasting PDF [1 MB, 7 pages]
Summary of ABARES agricultural forecasting DOCX [1 MB, 7 pages]
Unless otherwise noted, forecast error is defined as symmetric mean absolute percentage error. This is used to compare forecasts across commodities, and to not penalise positive forecast errors more than negative forecast errors. Please see Hyndman and Koehler (2006) for further information.
Symmetric mean absolute forecast error is calculated using the formula
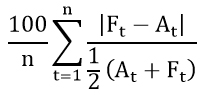
where Ft is the forecast in period t, Atis the actual observation in period t, and n is the number of observations.
Major commodities includes barley, beef and veal, canola, cheese, chickpeas, cotton, lamb, sugar, wheat and wine.