ABARES regularly reviews the economic performance of selected Commonwealth fisheries by surveying fishers and publishing a range of economic indicators. These indicators are used to assess the effectiveness and efficiency of management performance against the economic objective of the Fisheries Management Act 1991 — to maximise net economic returns (NER) to the Australian community from the management of Australian fisheries.
Economic performance is evaluated by assessing whether potential NER is being limited by prevailing management arrangements in the fishery. To do this, indicators are used to describe current economic trends in a fishery before assessing the drivers of those trends and the extent to which existing fishery management arrangements are allowing NER to be maximised.
NER is a major indicator of a fishery's economic performance, showing the difference between the revenue earned each year and the economic costs incurred in a fishery. Any remaining return is attributed to the fishery resource itself. Maximising NER is about maximising the return attributed to the resource. At zero NER fishers are generating a return on their capital and labour used in the fishery, but any returns attributed to the resource itself are lost. Measures of fishery productivity (specifically, total factor productivity) and terms of trade together can evaluate the drivers of changes in NER over time, including whether a fishery is moving towards its potential maximum NER.
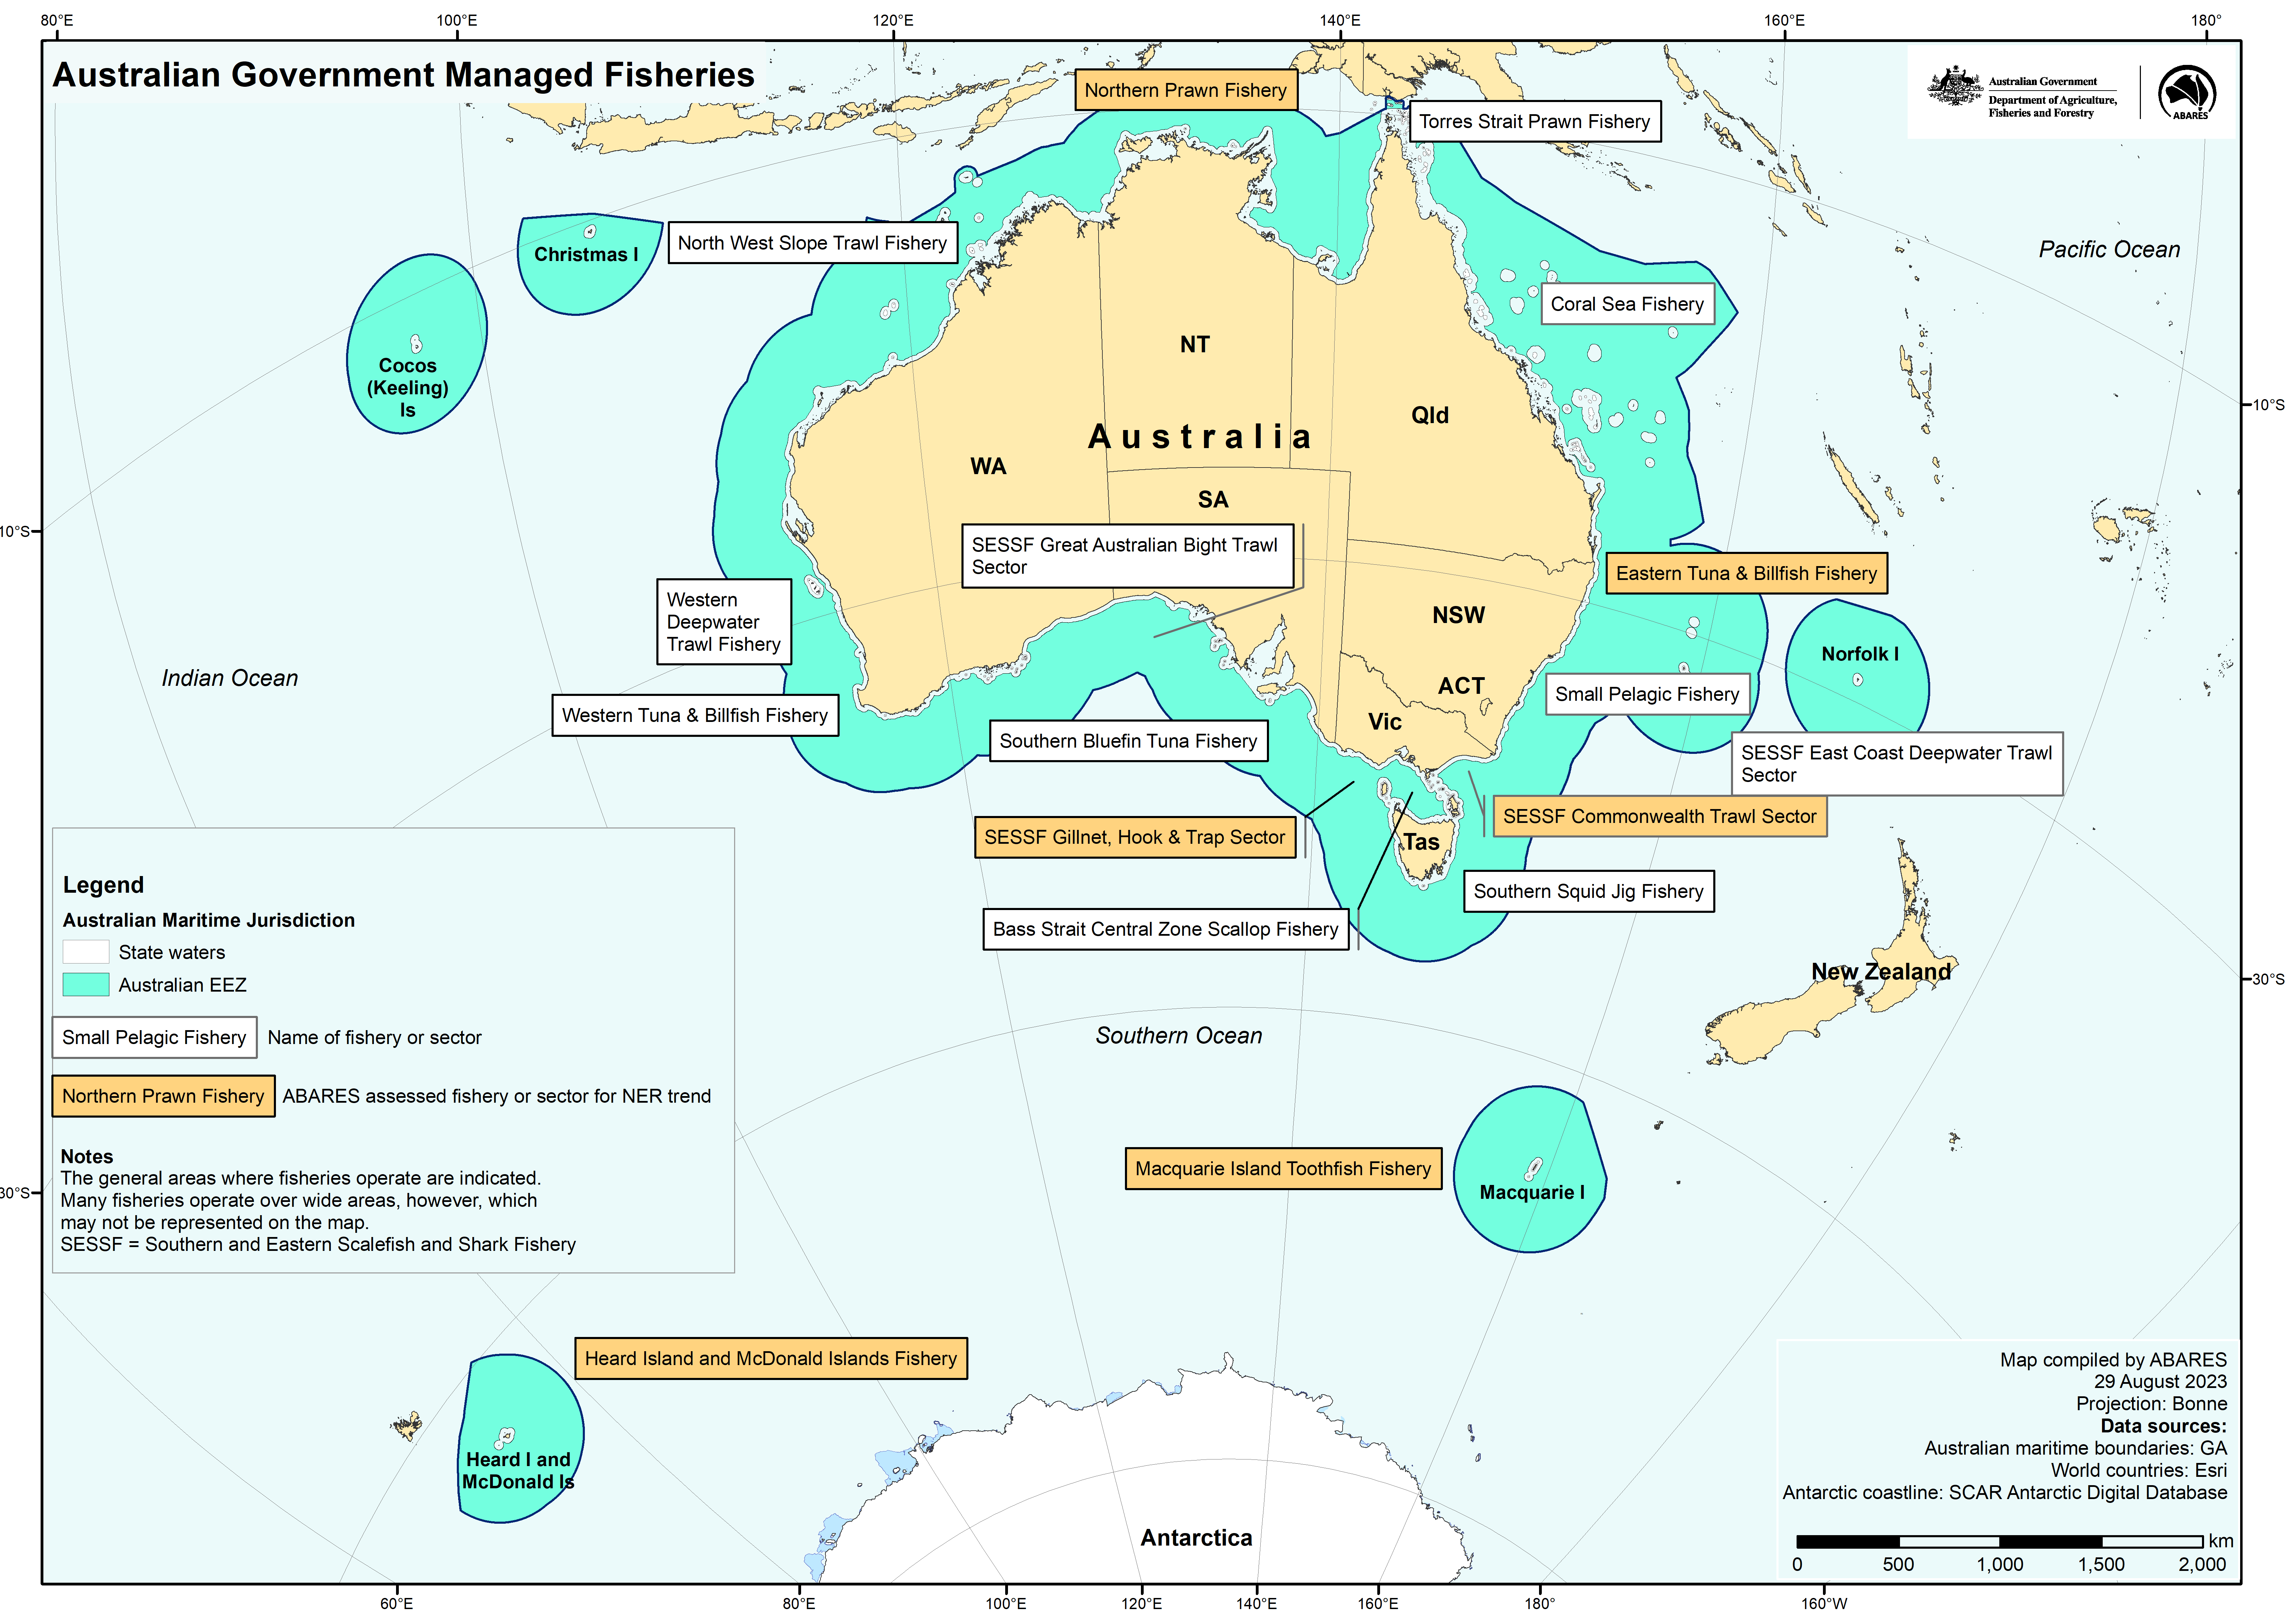
In the past, ABARES estimated NER from surveys of financial performance of vessels operating in the fishery, adjusted to reflect the economic costs to the community of operating the fishery. These costs include fuel, crew, repairs, fishery management, depreciation, and the opportunity cost of capital and owner operator labour. The major fisheries regularly surveyed in the past were the Eastern Tuna and Billfish Fishery, the Northern Prawn Fishery and two sectors of the Southern and Eastern Scalefish and Shark Fishery (the Commonwealth Trawl Sector and the Gillnet, Hook and Trap Sector). These 4 fisheries together represent 51% of the estimated $399 million total Commonwealth fishery gross production value (GVP) in 2024–25. Other minor fisheries, including the Torres Strait Prawn Fishery and the Bass Straight Central Zone Scallop Fishery, were surveyed less regularly. Following declining survey response rates, ABARES has more recently developed an experimental, non-survey approach as an alternative to formal surveys to continue reviewing the economic performance of major Commonwealth fisheries. This new approach uses a variety of existing administrative and public data sourced mainly from government agencies to estimate NER, terms of trade and total factor productivity indexes for Commonwealth fisheries.
Figure 1 Location of Commonwealth fisheries and sectors
Economic indicators dashboard
This data visualisation presents estimates of NER, together with indexes of fishery-level total factor productivity and terms of trade, for previously surveyed fisheries. Results for the Eastern Tuna and Billfish Fishery reflect a combination of survey-based and non-survey estimates.
Note: For some years, data represent non-survey forecasts (NER) or interpolations (TOT and TFP). These years are: for the Gillnet, Hook and Trap Sector, 2017–18 and 2018–19 (NER); for the Northern Prawn Fishery, 2020−21 (NER, TFP and TOT) and 2022–23 (NER); for the Commonwealth Trawl Sector, 2017–18 and 2018–19 (NER, TFP and TOT) and 2021–22 and 2022–23 (NER). For the Eastern Tuna and Billfish Fishery, data from 2002–03 to 2016–17 are survey-based, and data from 2017–18 to 2023–24 are derived from ABARES non-survey methodology.
Historical data tables containing a range of other economic indicators—including fishery gross value of production, management costs and vessel-level financial performance—are available in the data section of the individual fisheries below. These indicators are explained in Concepts and Methodology.
Australian fisheries economic indicators dashboard – 2025 update
If you have difficulty accessing these files, contact us for help.
Using a non-survey-based approach for the ETBF, ABARES has estimated NER — and measures of productivity and terms of trade — for the financial years 2010–11 to 2023–24.
Key findings and results
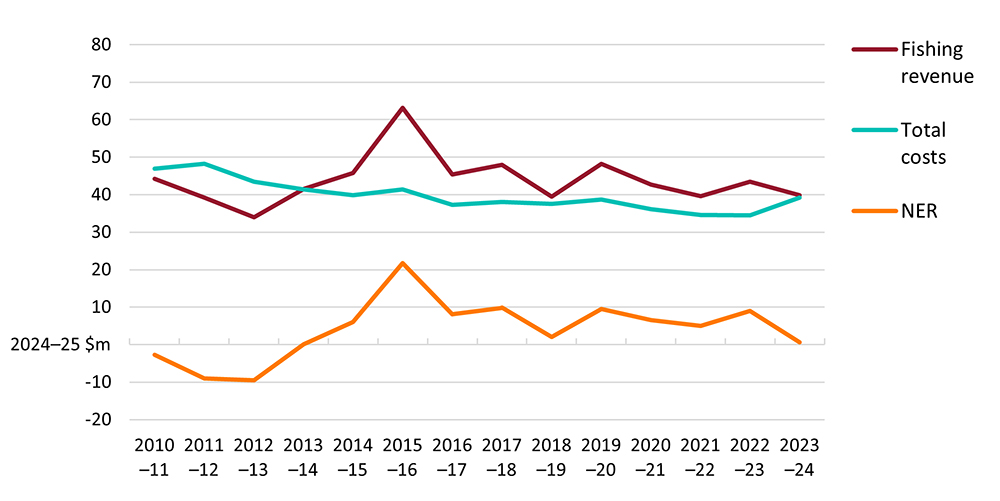
NER for the ETBF has trended downwards since 2015–16 to nearly zero ($0.7 million) in 2023–24 in real terms (Figure 1).
- This is due to both productivity and terms of trade reversing – productivity fell and output prices at best matched the rise in input costs.
- Real fishing revenue has trended downwards since 2015–16 to reach $39.8 million in 2023−24, driven largely by reducing catch volumes of key commercial species.
- Real costs also trended downwards over most of the estimation period, from $48.2 million in 2011–12 to $34.5 million in 2022–23 (a 28% decrease over this period), then increased by 13% in 2023–24 to $39.2 million.
Given the relatively greater variability in fishing revenue compared to total fishery costs, changes in NER over time in the ETBF are driven by movements in fishing revenue.
Figure 1 NER is trending downwards
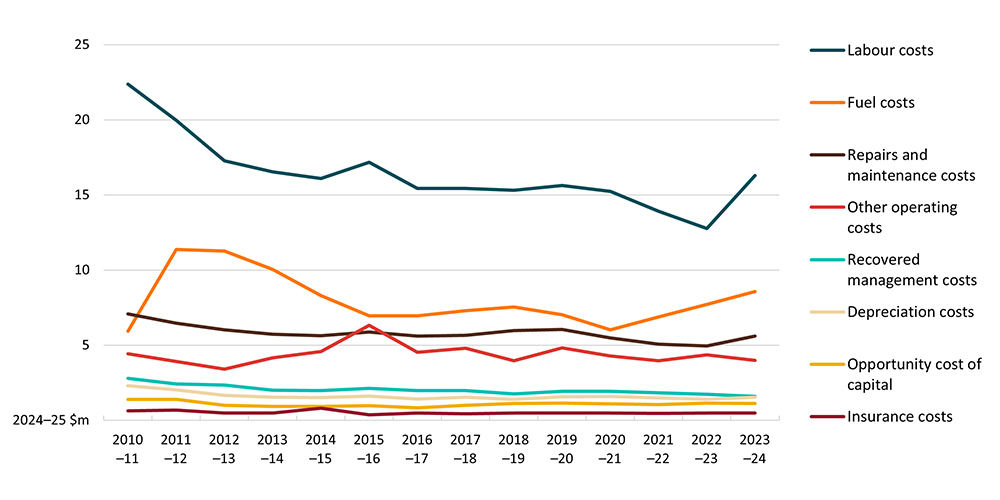
Operating costs are the most significant cost category incurred in the ETBF and comprise labour, fuel, repairs and maintenance, insurance and other operating costs (Figure 2). Costs of labour, fuel, and repairs and maintenance together account for around 85% of total operating costs and total operating costs represent around 88% of total fishery costs.
Figure 2 Operating costs are the largest cost category
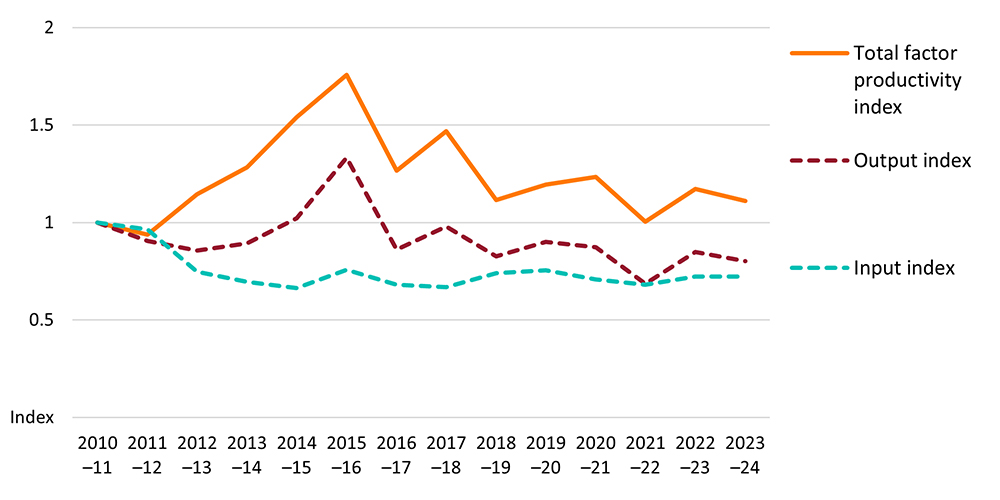
The total factor productivity index of a fishery measures changes in the quantity of output produced (i.e. fish caught) that is not explained by changes in the quantity of inputs used (such as labour, capital and fuel). The downward NER trend in the ETBF between 2015–16 and 2023–24 was driven largely by a decline in productivity (Figure 3). Significantly lower output over this period, particularly catch volume of all key tuna species and broadbill swordfish, was the main reason for declining productivity. In contrast, fishers’ use of inputs since 2015–16 remained relatively stable.
Figure 3 Lower catch is driving the decline in productivity
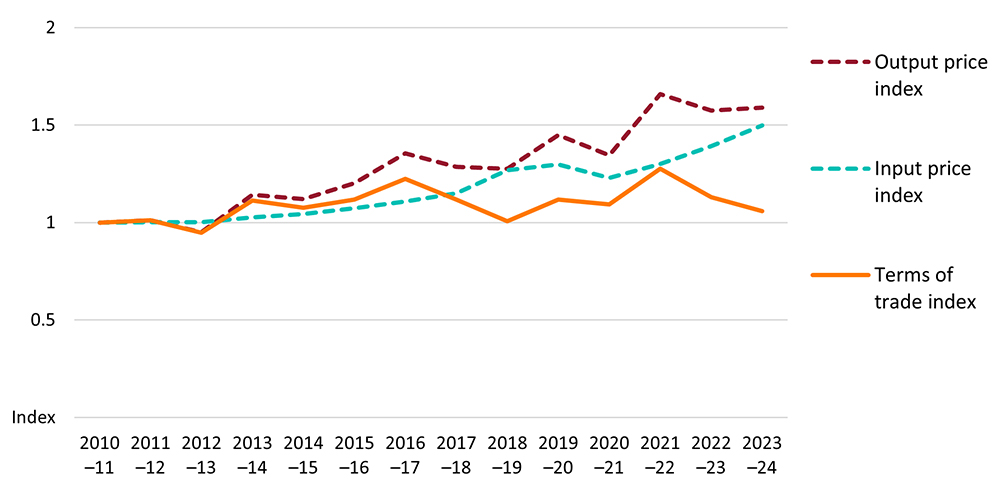
Fisher terms of trade—which measure how fish prices received have changed relative to input prices paid—have had less consistent (and more short-term) impacts on the downward trend in NER than productivity changes (Figure 4). Input prices increased steadily for most of the estimation period—particularly between 2021–22 and 2023–24—reflecting the relatively strong increases in fuel, capital and repairs and maintenance costs in recent years. Most recently in 2023−24, decreased terms of trade magnified the effect of lower productivity on a decline in NER.
Figure 4 Terms of trade have deteriorated in recent years
Economic performance estimates in Commonwealth fisheries: an experimental, non-survey approach
If you have difficulty accessing these files, contact us for help.
In 2020–21 the gross value of production (GVP) of the Eastern Tuna and Billfish Fishery (ETBF) was $35.6 million, accounting for 10% of total Commonwealth fishery production value.
ABARES conducted a survey of the ETBF in 2018. The results include survey-based estimates of financial performance of the average vessel and economic performance in 2015–16 and 2016–17, and non survey based estimates of economic performance in 2017–18 and 2018–19. Other indicators presented include total factor productivity (TFP), fishers’ terms of trade (TOT), quota latency and management costs.
The ongoing COVID-19 pandemic and the current Ukraine-Russia conflict are not reflected in the results as the surveys pre-date these events. The impacts of these global shocks are being felt across industries, including fisheries. Future surveys will aim to capture the effects of these events on fishery economic performance.
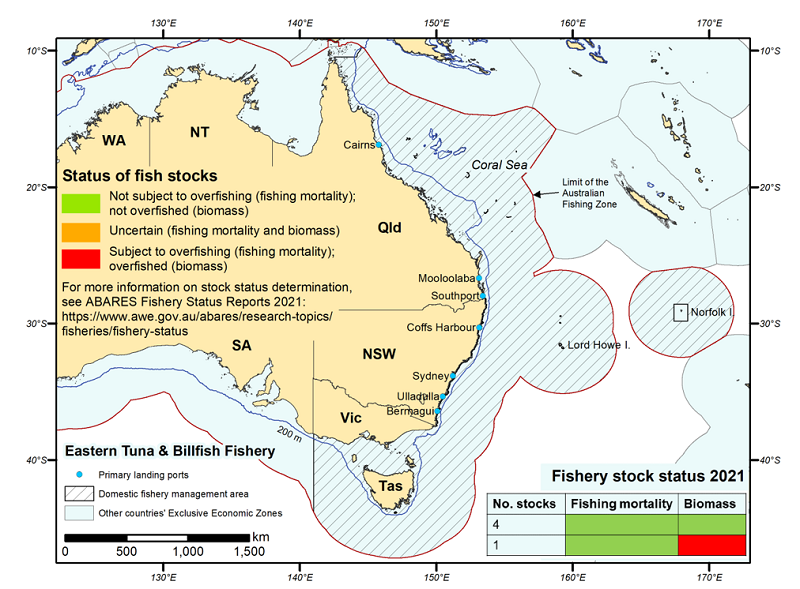
Figure 2 Area of the Eastern Tuna and Billfish Fishery
Key findings and results
Net economic returns (NER) demonstrated a persistent long-term positive trend since 2002–03. TFP has also improved over the long term. Improved TOT since 2012–13, combined with improving TFP, has supported the rising trend in NER. The shift to individual transferable quotas, which allows fishers to minimise fishing costs and maximise revenue for a given level of catch, and the reduction in the size of the fleet, are consistent with improved TFP and NER.
Improved TOT in 2015–16 combined with TFP improvements had a multiplying effect on the level of NER earnt from the fishery and was a driver for the record NER achieved that year. Further improvements in TOT during the following year partially offset a reduction in TFP in 2016–17.
Overall the positive trend in NER and TFP, while key target fish stocks have been relatively stable over the reporting period (as reported in ABARES Fishery status reports 2021), indicates that resource rents from the fishery are being realised and not dissipated through over-capitalisation or liquidation of the fish stock. Striped marlin, which was classified as overfished in ABARES Fishery status reports 2021, has a large habitat range including the South West Pacific Ocean that comprises the ETBF. This species has made only a minor contribution to GVP over the period 2008–09 to 2018−19 and is not a key target species in the fishery.
Other fishery and vessel-level indicators
Gross value of production peaked in 2015–16
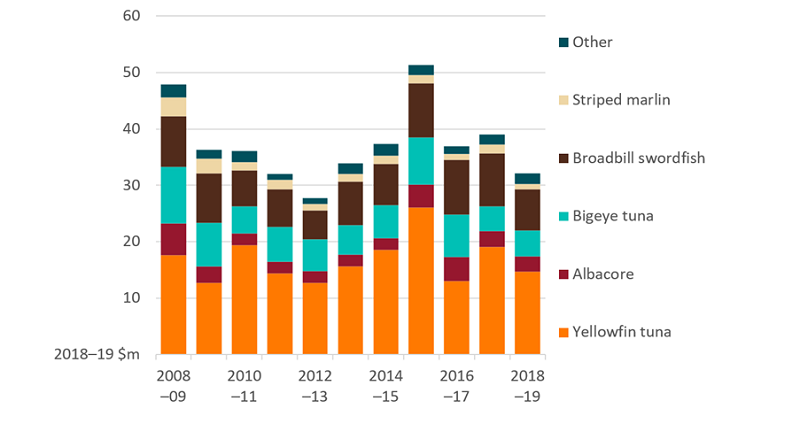
In 2015-16 the fishery’s GVP reached an 11-year high in real terms (2018−19 dollars) of $51.4 million because of increased catch and generally improved prices that year (Figure 3). GVP has since remained below the value achieved in 2015–16. The decline in GVP has been largely the result of falling catch volumes. GVP in the ETBF decreased by 16% in 2018–19 to $32.1 million and was largely the result of lower catch value of key targeted ETBF species—mainly yellowfin tuna and swordfish.
The value of Australian exports of albacore, bigeye tuna and yellowfin tuna (the three key species of tuna caught in the ETBF) declined by 29% in 2018–19 to $11.0 million. Export value declined across all three tuna species and reflected a combination of lower export prices and lower export volumes. Swordfish is typically the second most valuable species group landed in the ETBF after yellowfin tuna. In 2018–19 the value of swordfish exports declined by 42% to $3.9 million.
Figure 3 GVP for Eastern Tuna and Billfish Fishery. GVP peaked in 2015–16 with yellowfin tuna accounting for increasing share of total GVP
Management costs have declined indicating increasing efficiency and effectiveness in fishery management expenditure
Total management costs in the ETBF generally declined between 2002–03 and 2016–17. Management costs as a share of GVP fell from 11% in 2005–06 to 4% in 2016–17. Such a decline in the proportion of management costs, linked to increasing TFP and NER, indicates increasing efficiency and effectiveness in management expenditure in the fishery.
Latency exists, indicating limited binding constraints on fishing activity
The extent to which latency (i.e. unused quota) exists in the fishery and the way this latency fluctuates may provide an indication of the economic incentives for operators to target particular species. The level of latency in the ETBF, measured by the proportion of total allowable commercial catch (TACC) not caught in the fishery, has varied across the key species since 2011.
- In the 2015 fishing season, very low latency levels were recorded for yellowfin tuna and striped marlin.
- In contrast, latency for albacore (a relatively low unit value species) remained high in the 2015 season—nearly two-thirds of the TACC remained uncaught that season.
- Between the 2015 and 2018 seasons, latency increased for yellowfin tuna and striped marlin, decreased for swordfish, and remained largely unchanged for albacore and bigeye.
Crew payments and freight and marketing expenses driving costs
The two largest costs in the ETBF are crew payments, and freight and marketing expenses. These costs tend to move in line with total seafood receipts—as crew may be paid as a proportion of receipts, and freight and marketing expenses are likely related to the volume of catch. In contrast, fuel (another major cost component) tends to be less directly related to seafood receipts and is instead influenced by fishing effort as well as fuel prices.
- Average vessel fuel costs increased by 21% in 2016–17, driven by higher fuel prices that year.
- The largest share of cash costs in 2015–16 and 2016–17 were crew costs (25% and 22%, respectively) and freight and marketing expenses (23% in both years).
- Profit at full equity for the average ETBF boat was $263,916 in 2015–16 and $259,982 in 2016−17.
Download
Australian fisheries economic indicators report 2018: Financial and economic performance of the Eastern Tuna and Billfish Fishery (PDF 1.5 MB)
Australian fisheries economic indicators report 2018: Financial and economic performance of the Eastern Tuna and Billfish Fishery (DOCX 2.5 MB)
Data
The Northern Prawn Fishery (NPF) is a major source of fresh and frozen prawns to domestic and international markets. Key targeted stocks in the NPF that have relatively high commercial value include species of tiger prawns, banana prawns and endeavour prawns. A significant portion of the banana prawn catch is sold to supermarkets in Australia, while tiger prawns are regularly exported.
The results of the most recent ABARES survey of the NPF presented here include estimates of financial performance of the average vessel and economic performance of the fishery in 2021–22 based on information provided by fishers for those years. Financial performance estimates for 2020−21 are not available because the survey sample for that year is not representative of the NPF fleet in terms of vessel size.
A non-survey-based forecast of NER for the NPF is available for 2022−23. Other fishery indicators presented include total factor productivity, fishers’ terms of trade and management costs. These indicators are explained in Dylewski and Curtotti (2024).
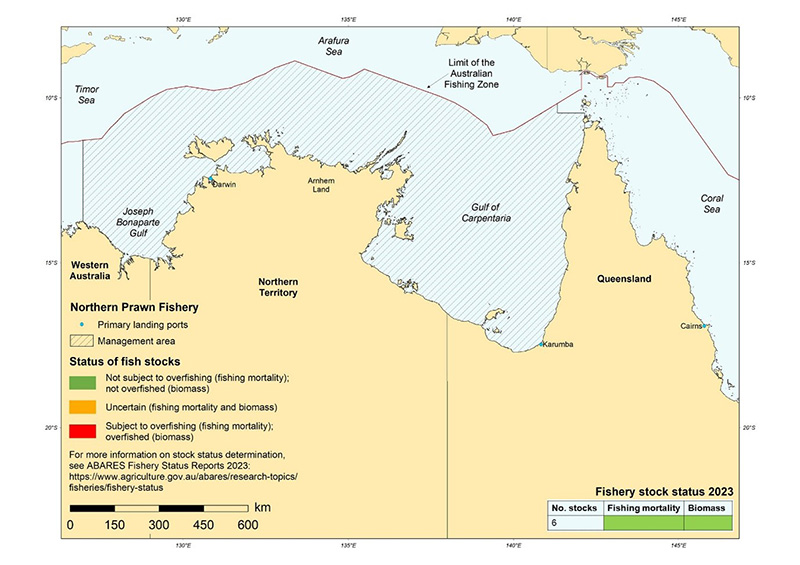
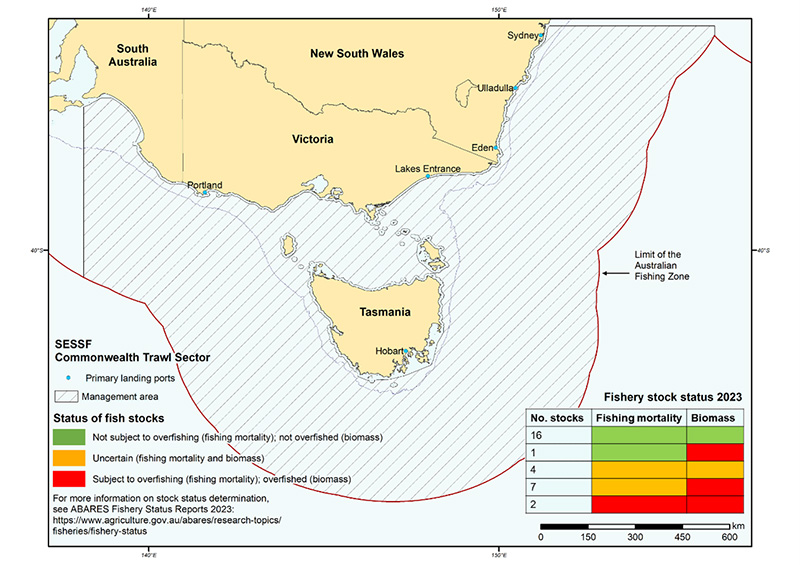
Figure 4 Area and stock status of the Northern Prawn Fishery, 2023
Key findings and results
Net economic returns (NER) measures the total return to the fishery resource as the difference between fishing revenue and the economic costs incurred in a fishery (Rose et al 2000). NER in real terms (adjusted for inflation and in 2023–24 dollars) increased significantly over the period 2004–05 to 2015–16 from −$20.8 million to $38.0 million. Since then, real NER are estimated to have fallen to $4.4 million in 2021−22; and forecast to have increased in 2022–23 to $9.3 million driven by significantly higher banana prawn catch, but will remain well below the level achieved in 2015–16.
Fisher terms of trade (TOT) measure how fish prices have changed relative to input prices. Total factor productivity (TFP) measures how well fishers use inputs to produce outputs over time. Together TOT and TFP are important indicators as they can help to interpret the drivers of movements in NER.
The declining trend in NER over the period 2015–16 to 2021–22 coincided with a period of falling TOT, driven by increasing input prices and generally decreasing output prices.
The growth in TFP since 2004–05 was driven by a reduction in inputs used in the fishery, which coincided with a period of growth in outputs. In the early part of this period, a reduction in the number of vessels operating is likely to have led to a more efficient fleet structure. In the latter part, improved conversion of inputs to outputs has played a greater role in improving TFP. Since 2015–16 TFP has varied with no trend, so the declining TOT are a least partly responsible for falling fishery NER.
Other fishery and vessel-level indicators
Higher banana prawn catch driving an increase in GVP
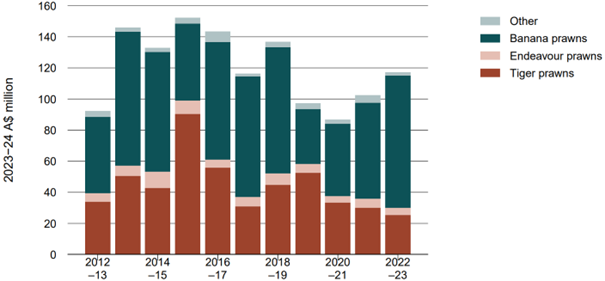
The gross value of production (GVP) of the NPF is strongly influenced by catch composition of banana prawns and tiger prawns, both key targeted and relatively high unit value species. The catch of these species can be variable from year to year. For example, annual catch levels of banana prawns can fluctuate significantly between fishing seasons, caused by annual rainfall variation in the northern Australian wet season.
Between 2020–21 and 2022–23 banana prawn catch increased significantly (reaching a 12 year high in 2022–23), offsetting lower tiger prawn catch and GVP and driving higher fishery GVP.
Figure 5 GVP of the Northern Prawn Fishery
Management costs are trending lower
Only the cost-recovered component of total management costs in the NPF is available. This component decreased between 2010–11 and 2022–23 from $3.7 million to $2.2 million in real terms (2023–24 dollars), a period during which the number of active vessels in the fleet was relatively stable. Management costs as a percentage of GVP also decreased over this period, from 2.9% to 1.8%. Lower management costs over time may indicate improved efficiency of management, however efficiency is also about ensuring the right level of management services is provided and that it provides the highest possible net benefits (Gooday and Galeano 2003). This second element has not been assessed.
Downloads
Australian fisheries economic indicators report 2023: Financial and economic performance of the Northern Prawn Fishery (PDF 492 KB)
Australian fisheries economic indicators report 2023: Financial and economic performance of the Northern Prawn Fishery (DOCX 874 KB)
Data
The Commonwealth Trawl Sector (CTS) of the Southern and Eastern Scalefish and Shark Fishery (SESSF) is a major source of fresh fish to wholesale markets in eastern Australia. Key targeted species of relatively high commercial value in the CTS include blue grenadier, tiger flathead, orange roughy, pink ling, and eastern school whiting.
The results of the most recent ABARES survey of the CTS presented here include estimates of financial performance of the average vessel and economic performance of the fishery in 2019–20 and 2020–21 based on information provided by fishers for those years.
Non-survey-based estimates and forecasts of net economic returns (NER) to the CTS are available for:
- 2017–18 and 2018–19: the years for which information was not collected from fishers because of the COVID-19 pandemic
- 2021–22 and 2022–23: forecasted to provide more recent information on economic performance.
Other fishery indicators presented include total factor productivity, fishers’ terms of trade, quota latency and management costs. These indicators are explained in Dylewski and Curtotti (2024).
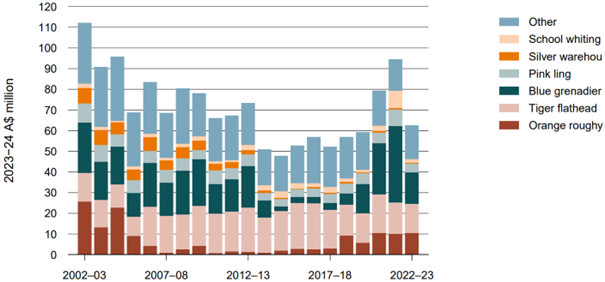
A significant driver of the fishery’s gross value of production (GVP) is blue grenadier catch. From time-to-time factory-freezer vessels operate in the CTS, fishing the winter spawning aggregations of blue grenadier. Between 2019–20 and 2022–23 several factory-freezer vessels operated in the CTS. The combined amount of blue grenadier caught by these vessels averaged over 80% of the total blue grenadier catch in the CTS in those years and is therefore a significant component of the fishery. However, ABARES has been unable to secure any of these factory trawlers in the sample of boats in the most recent survey. The results presented here should therefore be interpreted as representing the fishery excluding the winter spawning blue grenadier component of the fishery.
Figure 6 Area and stock status of the Commonwealth Trawl Sector of the Southern and Eastern Scalefish and Shark Fishery, 2023
In response to concerns about the sustainability of several SESSF species, the Australian Fisheries Management Authority (AFMA) has implemented several changes in the CTS:
- The 2022–23 season total allowable catches (TACs) for certain CTS species were reduced.
- Large areas of the CTS were closed from 1 May 2023 (the start of the 2023–24 fishing season) to reduce catches of overfished stocks such as eastern jackass morwong, redfish and john dory.
In addition, the Australian Government delivered a structural adjustment program in 2022–23 to support fishers in the CTS to adjust to the new arrangements. This program provided CTS operators the opportunity to sell their boat Statutory Fishing Rights.
It is difficult at this stage to quantify the impact of the management changes on NER in the fishery. The overfished stocks now represent only a minor part of the fishery’s total catch and gross value of production (GVP) but are caught in association with other stocks which contribute more significantly to GVP. Eastern jackass morwong, redfish and john dory combined averaged around 5% of total fishery catch and GVP in the 10 years to 2014–15, but accounted for only around 1% of total catch and GVP in 2022–23.
Some of the fishery area closures are associated with medium-to-high fishing intensity and Butler et al (2023) notes these closures are expected to reduce future catches of at-risk species as well as future catches of flathead, a key targeted species. Flathead contributes significantly to total fishery GVP and this contribution has varied over the past decade from 16% (in 2021–22) to 42% (in 2015−16). Lower catches of flathead and other species are anticipated to reduce fishery revenue and fishers may incur greater costs by shifting their operations to next-best fishing grounds that may be less profitable relative to the areas closed. If the closures allow the overfished stocks to rebuild then these larger stocks would likely improve NER in the long run.
Key findings and results
Net economic returns (NER) measures the total return to the fishery resource as the difference between fishing revenue and the economic costs incurred in a fishery (Rose et al 2000). NER in real terms (adjusted for inflation and in 2023–24 dollars) are forecast to have decreased and be negative in 2021−22 to −$1.5 million, and to have further decreased in 2022–23 to –$4.9 million. This continues the downward trajectory in NER since 2010–11 from a real NER level of $9.1 million, though with some improvements to NER in about 2015 and 2020 due to more favourable input prices (most importantly, lower fuel prices).
Fisher terms of trade (TOT) measure how fish prices have changed relative to input prices. Total factor productivity (TFP) measures how well fishers use inputs to produce outputs over time. Together TOT and TFP are important indicators as they can help to interpret the drivers of movements in NER.
TOT have fluctuated over the last 20 years but have not demonstrated a noticeable trend. This suggests that changes in TOT over time have not driven the downward trend in NER. TOT improvements in 2020–21 were driven by improving prices for target species and a short-term reduction in fuel price, which both supported a short-term improvement in NER in that year.
High growth in TFP between 2002–03 and 2010–11 drove increased NER over this period. Most of the growth in TFP occurred after the implementation of the Securing our Fishing Future structural adjustment package, which was announced and implemented from 2006. The vessel buyback of eligible concessions effectively removed effort from the sector, resulting in over half of the vessels operating in the sector in 2002–03 exiting by 2007–08. From 2007–08 to 2018–19 around 50 vessels operated in the sector. Coinciding with this period of vessel reduction was a strong increase in TFP as less efficient vessels exited the sector.
Since 2010–11 TFP has declined and has coincided with a reduction in NER. The reason for the falling TFP is not clear, but emerging issues around the non-recovery of some overfished stocks (see Butler et al, 2023) may be contributing to declining TFP.
Other fishery indicators
Blue grenadier now a driver of changes to GVP
In recent years blue grenadier has contributed a large proportion of total CTS GVP. Between 2019–20 and 2022–23 a few large factory-freezer vessels accounted for over 80% of total blue grenadier catch and a significant proportion of the GVP of the fishery overall. However, excluding blue grenadier in the last 4 years, the remaining fishery GVP has been relatively stable since 2013–14 (averaging $50 million in real terms).
Figure 7 GVP of the Commonwealth Trawl Sector
Management costs are trending lower
Only the cost-recovered component of total management costs in the CTS is available. This component decreased between 2007–08 and 2022–23 from $5.5 million to $3.2 million in real terms (2023–24 dollars), a period during which the number of active vessels in the fleet was relatively stable. Management costs as a percentage of GVP also decreased over this period, from 8.0% to 5.2%. Lower management costs over time may indicate improved efficiency of management, however efficiency is also about ensuring the right level of management services is provided and that it provides the highest possible net benefits (Gooday and Galeano 2003). This second element has not been assessed.
Lower NER in 2020–21 to 2022–23 coincides with increase in quota latency for target species
Some key CTS target species have low latency but many species have high latency. Between the 2020–21 and 2022–23 fishing seasons (May to April), latency for blue grenadier, pink ling, silver warehou and eastern school whiting increased to around 60%, though TACs increased over this period for all species except pink ling, contributing to the higher observed latency. Higher latency over this period is associated with estimated NER continuing its downward trend and suggests that operators are unlikely to find further fishing profitable.
High levels of quota latency in the CTS over a broad range of species, associated with declining NER warrants further investigation, noting the difficulty of interpreting TAC latency in a complex multi species and multi-sector fishery. The full reasons why TACs are uncaught are not always clear and may reflect causes that fishery managers cannot control (for example, bad weather), as well factors that will take time for managers to adjust to (for example changes to species productivity to climate change). Knuckey et al (2018) and DAWR (2016) provide a range of explanations for why quota is not fully caught in the SESSF.
Downloads
Australian fisheries economic indicators report 2022: Financial and economic performance of the Commonwealth Trawl Sector of the Southern and Eastern Scalefish and Shark Fishery (PDF 543 KB)
Australian fisheries economic indicators report 2022: Financial and economic performance of the Commonwealth Trawl Sector of the Southern and Eastern Scalefish and Shark Fishery (DOCX 946 KB)
Data
In 2020–21 the gross value of production (GVP) of the Gillnet, Hook and Trap Sector (GHTS) of the Southern and Eastern Scalefish and Shark Fishery (SESSF) was $28.8 million, accounting for 8% of total Commonwealth fishery production value.
ABARES conducted a survey of the GHTS in 2018. The results comprise survey-based estimates of financial performance of the average vessel and economic performance in 2015–16 and 2016–17, and non survey based estimates of economic performance in 2017–18 and 2018–19. Other indicators presented include total factor productivity (TFP), fishers’ terms of trade (TOT), quota latency and management costs.
The ongoing COVID-19 pandemic and the current Ukraine-Russia conflict are not reflected in the results as the surveys pre-date these events. The impacts of these global shocks are being felt across industries, including fisheries. Future surveys will aim to capture the effects of these events on fishery economic performance.
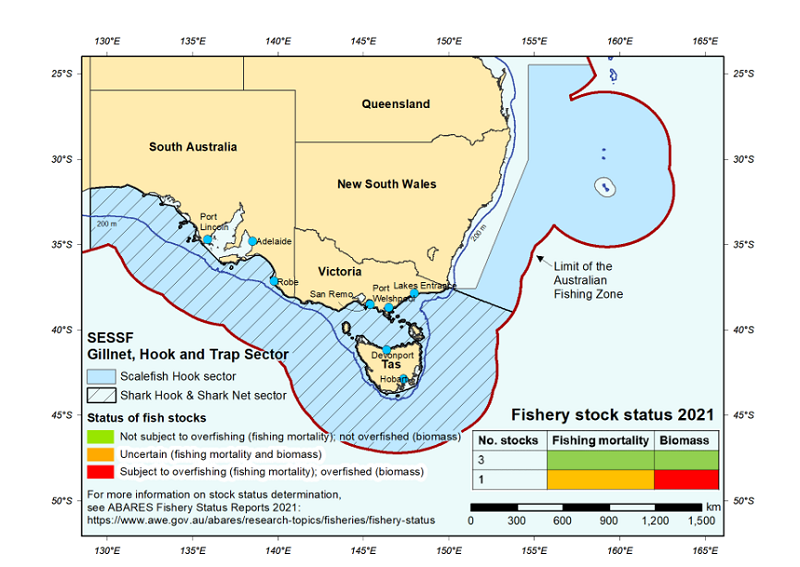
Figure 8 Area of the Gillnet, Hook and Trap Sector of the Southern and Eastern Scalefish and Shark Fishery
Key findings and results
Net economic returns (NER) were variable between 2002–03 and 2018–19. Strongly negative results were observed between 2009–10 and 2014–15, declining from $6.0 million in 2008−09 to a low of −$7.6 million in 2013–14. Since 2013–14 NER has increased and is estimated as positive in the most recent non-survey year.
TOT declined between 2002–03 and 2016–17, driven by input prices growing faster than output prices. Most of the decline in TOT occurred from 2009 to 2014, which coincided with falling NER over this period and indicates that TOT were a strong contributing factor to declining NER over this period. Rising TOT between 2013–14 and 2016–17 supported growth in NER.
TFP has increased since 2002–03, mainly driven by a reduction in input use. The number of active boats has reduced from 129 vessels in 2002–03 to 66 vessels in 2016–17.
In 2010 significant spatial closures were introduced in the GHTS that prohibited the use of gillnets in the fishing grounds off the South Australian coastline. These closures were put in place to protect and reduce interactions with protected marine mammals, including Australian sea lions and dolphins. These closures resulted in a structural shift of gillnetting activity toward Bass Strait. This structural shift of the fleet to alternate gillnet grounds likely contributed to the decline in NER after 2008–09. Improved NER since 2013−14 suggests that fishers have adapted to the changed operating environment during this period.
As reported in ABARES Fishery status reports 2021, the status of key target species in the GHTS indicates that current levels of NER are sustainable and are not being achieved by compromising the sustainability of fish stocks. Of the four shark species that together account for most of the sector’s GVP, only school shark has been classified as overfished over the reporting period. This species is no longer actively targeted in the fishery and is under a long-term rebuilding strategy.
Other sector and vessel-level indicators
Gross value of production on rising trend from 2013–14
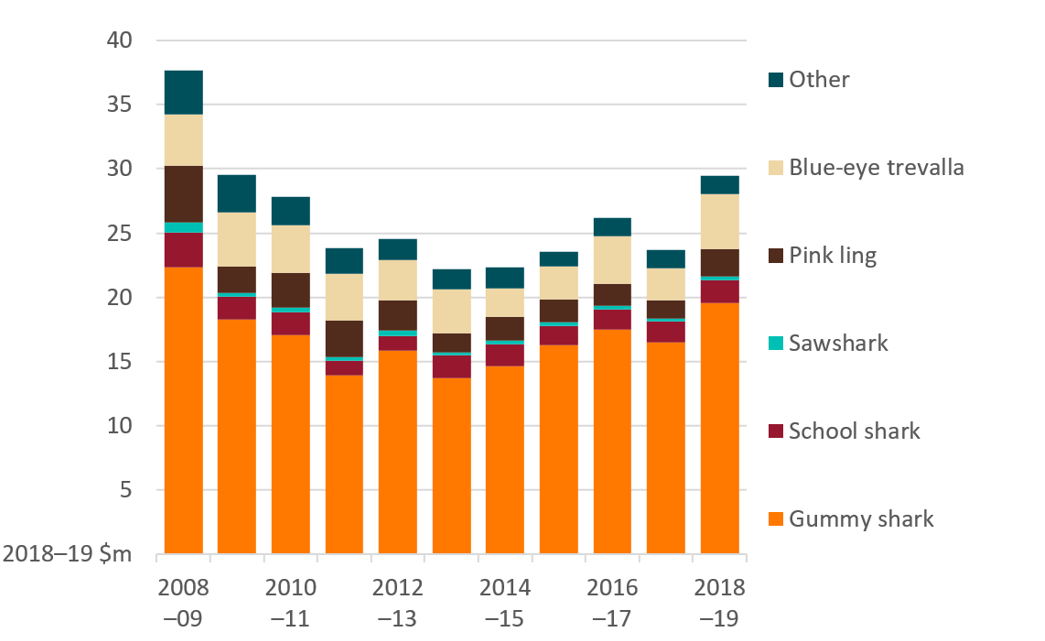
The gross value of production (GVP) of the GHTS declined rapidly after the introduction of gillnet closures in 2010 in areas off the coast of South Australia. Real GVP (2018−19 dollars) increased from a low of $22.2 million in 2013–14, reaching $29.4 million by 2018–19. Gummy shark accounts for over half of the sector’s GVP and this share rose from 62% in 2013–14 to 67% in 2018–19 (Figure 9). School shark has in the past contributed to the GVP of the fishery, but depleted levels for this stock mean that it is no longer actively targeted.
Figure 9 GVP of the Gillnet, Hook and Trap Sector of the Southern and Eastern Scalefish and Shark Fishery. GVP declined between 2004–05 and then followed a rising trend to 2018–19
Management costs per active boat stable in three years to 2018–19
Total management costs in the GHTS declined in real terms (2018–19 dollars) from $3.3 million in 2002−03 to $2.5 million in 2018–19. Management costs as a percentage of the sector’s GVP have been variable and shown no clear trend over the last 10 years (2009–10 to 2018–19), averaging 10% over this period.
Quota latency influenced by area closures and protection of school shark stocks
Gummy shark accounts for the largest proportion of GVP (around 70%) and means that changes in stock and total allowable catch for gummy shark can significantly affect economic performance in the GHTS. High levels of quota latency for gummy shark have declined in recent years as fishers adjusted to the 2010 gillnet fishing ground closures. School shark quota is set at minimal levels to allow some bycatch to occur when targeting gummy shark, and quota latency for school shark has been low. The two major targeted scalefish species—pink ling and blue eye trevalla—for the scalefish line component of the GHTS have exhibited varying levels of latency.
- Latency for gummy shark declined from 23% in the 2013 fishing season to 10% in in 2018.
- School shark quota is typically fully caught with latency falling frequently below 10%.
- Pink ling was fished close to quota (shared with the CTS) from 2004 to 2014, with some latency developing between 2015 and 2018 (21% for the 2018 season).
- Blue-eye trevalla often shows latency (25% in the 2018 fishing season).
Crew costs, fuel, repairs and maintenance are significant cost items
The cost items that contribute most to overall cash costs in the GHAT are crew, fuel, and repairs and maintenance. These items together accounted for around 62% of total cash operating costs in 2016−17. Crew costs accounted for the largest share of cash costs in 2016–17, followed by repairs and maintenance and fuel.
Higher fuel prices in 2021–22 are expected to increase the operating costs of vessels operating in the GHAT and to impact negatively on economic returns from the sector.
- Crew costs as a share of total cash costs increased from 2015–16 to 2016–17, averaging 36% of boat cash costs in 2015–16 and 41% in 2016–17.
- Over the survey years 2015–16 and 2016–17, the contribution of fuel to total cash costs was steady at 10% of total cash costs.
- Profit at full equity for the average GHTS vessel was $229,366 in 2015–16 and $148,803 in 2016−17.
Downloads
Australian fisheries economic indicators report 2018: Financial and economic performance of the Gillnet, Hook and Trap Sector of the Southern and Eastern Scalefish and Shark Fishery (PDF 589 KB)
Australian fisheries economic indicators report 2018: Financial and economic performance of the Gillnet, Hook and Trap Sector of the Southern and Eastern Scalefish and Shark Fishery (DOCX 1.77 MB)
Data
This report presents results of the 2013 Torres Strait Prawn Fishery survey. The results comprise survey-based estimates of financial performance of the average vessel and economic performance in 2010–11 and 2011–12, and non survey-based estimates of economic performance in 2012–13. Other indicators presented in the report include total factor productivity, fishers’ terms of trade and management costs.
Key findings and results
- Net economic returns (NER) remained negative at −$2.1 million in 2010−11 and decreased to −$2.7 million in 2011−12.
- Non-survey-based projections indicate that NER is likely to have been −$2.3 million in 2012−13.
- Negative NER in the fishery is mainly attributed to the high costs associated with operating in a remote fishery.
Vessel-level indicators
- Profit at full equity for the average vessel in the fishery was −$89,491 in 2010–11 and −$87,366 in 2011–12. The change was primarily attributed to higher cash receipts leading to higher vessel cash income.
Downloads
Australian fisheries economic indicators report 2013 - Torres Strait Prawn Fishery (PDF 1.68 MB)
Australian fisheries economic indicators report 2013 - Torres Strait Prawn Fishery (DOCX 983 KB)
Data
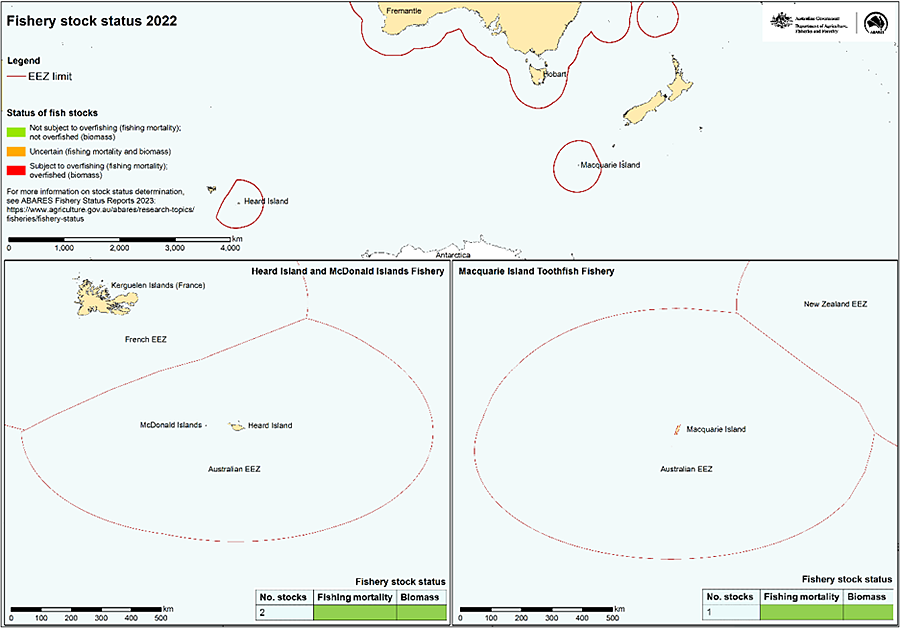
Despite having a high value, there has been limited economic analysis of Australia’s main sub-Antarctic fisheries, the Heard Island and McDonald Islands (HIMI) fishery and Macquarie Island Toothfish Fishery (MITF).
Formal surveys of these fisheries are not possible owing to the low number of individual businesses operating in these fisheries, and the HIMI and MITF have not been formally surveyed by ABARES.
This report provides a first attempt to use non survey methods to estimate the net economic returns (NER) trend for the HIMI and MITF. It complements reporting already undertaken in the Commonwealth fishery status reports, which have in recent years assessed these fisheries as having low levels of quota latency for the primary target species, Patagonian toothfish, with a high landing value, indicating positive NER for these fisheries.
The method developed to determine the NER trend for the HIMI and MITF is highly suited to fisheries with high quality catch and effort data and well-defined fleet characteristics, in particular engine capacity, vessel size, and the replacement capital cost of vessels operating in the fisheries.
Key findings and results
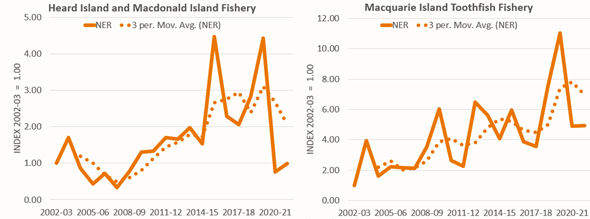
Using a non-survey-based approach, the NER trend for the HIMI and MITF is assessed for the period 2002–03 to 2021–22 financial years.
These fisheries supply both Patagonian toothfish and mackerel icefish to world markets, and both these species are covered in this analysis.
- HIMI and MITF experienced a generally rising trend in NER from 2008–09 to 2019–20, followed by a sharp decline from the onset of the COVID-19 pandemic. Contributing to this decline has been the recapitalisation of the fleet, with 2 significant and new upgraded vessels entering the fishery in 2019–20 and 2020–21.
- The negative effect on NER from the recent recapitalisation of the fleet is likely to subside as older vessels are retired from the fishery and as increased efficiency from the operation of the new vessels is realised.
- The period 2008–09 to 2018–19 contrasts with a period of declining or steady NER from 2002–03 to 2008–09. The rising trend in NER from 2008–09 to 2018–19 coincides with a period of transition for the fleet, from trawl to almost entirely automatic longline operations.
Real NER trend in the Commonwealth Heard Island and Macdonald Island Fishery and the Macquarie Island Toothfish Fishery, 2002-03 to 2021–22
- NER is likely to have improved in 2021-22. Strong price recovery occurred in the first half of 2022. Potential NER may however not be met as crewing of trips has become more challenging and the increase in the price of fuel in early 2022 is likely to have resulted in above average fishing costs for the period.
Download the full report
Estimating net economic returns from Australia’s sub-Antarctic fisheries: a non-survey approach PDF
Estimating net economic returns from Australia’s sub-Antarctic fisheries: a non-survey approach DOCX
If you have difficulty accessing these files, contact ABARES.
Eastern Tuna and Billfish Fishery
Northern Prawn Fishery
Southern and Eastern Scalefish and Shark Fishery
Concepts and methodology
Australian fisheries economic indicators reports: Concepts and methodology (2022)
The document below outlines concepts and methodologies used in the Australian fisheries economic indicators reports. These include the general use of economic indicators in fisheries management; definitions of key financial performance variables and net economic returns (NER); survey methods; and ABARES methodologies for survey-based and non-survey-based estimation of NER, and productivity and terms of trade analysis.
Download
Australian fisheries economic indicators report 2024: Concepts and methods (PDF 576 KB)
Australian fisheries economic indicators report 2024: Concepts and methods (DOCX 432 KB)

