
ABARES Australian fisheries and aquaculture outlook report contains ABARES forecasts for the value of Australian fisheries and aquaculture production and exports, including for the key species rock lobster, salmonids, abalone, tuna and prawns. For detailed historic data of fisheries and aquaculture production, consumption and trade see Australian fisheries and aquaculture statistics.
Outlook for Australian fisheries and aquaculture
Key points
- The nominal value of Australian fisheries and aquaculture production is forecast to rise in 2023–24 by 0.5% to $3.56 billion.
- Despite differences across individual commodities, the real value of Australia's fisheries and aquaculture production is projected to remain steady over the period 2024–25 to 2028–29, averaging $3.48 billion.
- Across the sector, softening real average prices are expected in the period 2023–24 to 2028–29, due to increasing global supply and an appreciating Australian dollar.
- Salmonid's share of Australia's fisheries and aquaculture production has grown strongly in the last two decades to 37% in 2023–24. Despite global growth in salmonid production which is dampening prices, Australian production is expected to grow moderately over the medium term. This is expected to offset falls in the value of production for other key commodities such as rock lobster and abalone due to lower real prices.
- Aquaculture is expected to continue its trend of increased overall contribution to seafood production, increasing from 60% of production value in 2023–24 to 64% by 2028–29 with the overall real value of aquaculture reaching $2.21 billion by 2028–29. Growth over this period is driven by expected production increases across a range of aquaculture species, but salmonid aquaculture production remains a major determinant of this trend.
The nominal value of Australian fisheries and aquaculture production is forecast to rise in 2023−24 by 0.5% to $3.56 billion. Higher forecast production volumes across all major species during the year are expected to be offset by lower prices for some key species with overall production value remaining relatively unchanged. Total production volume is expected to reach 296,000 tonnes by 2024–25, a 1% increase from 2022–23.
Figure 1 Real gross value of Australian fisheries and aquaculture, 2008–09 to 2028–29
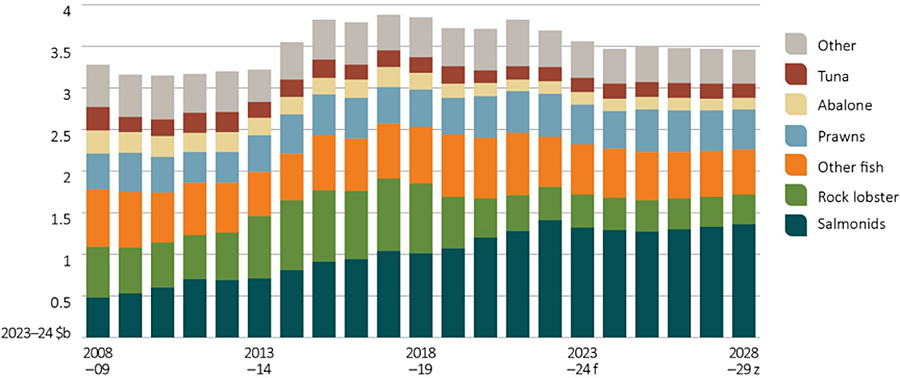
Source: ABARES
Over the period 2024–25 to 2028–29, the real value of fisheries and aquaculture production is projected to remain steady, averaging $3.48 billion (Figure 1). Over the medium term, the composition of real fisheries and aquaculture production value is expected to change slightly—with increases seen in salmonids and prawns, and falls in rock lobster. Other commodity groups remain steady in terms of their contribution to sector real value over the period. Declining prices for key species (Figure 2) are expected to be offset by an overall increase in production volumes. Declining prices are expected to result from slow growth in export demand for Australian seafood, following an expected appreciation of the Australian dollar.
Production volumes are projected to rise by around 4% over the medium term, reaching 307,000 tonnes by 2028–29. Growth in volumes produced is driven by further growth in salmonids and prawn aquaculture and increased tuna production.
Figure 2 Real price of Australian fisheries and aquaculture species by species, 2008–09 to 2028−29
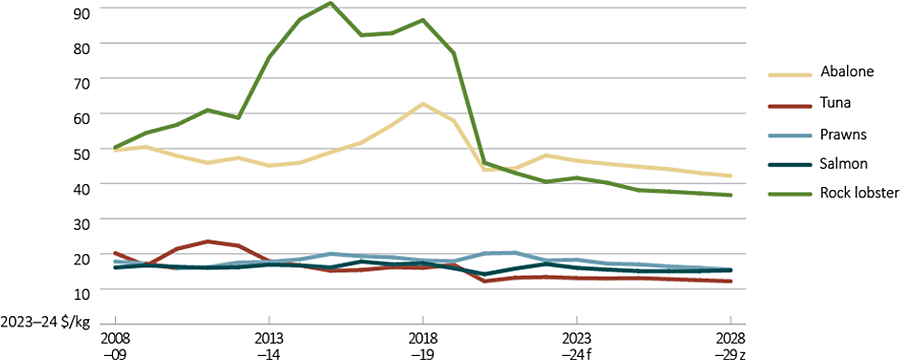
Source: ABARES
The value of the aquaculture industry is forecast to grow by 3% in nominal terms between 2022-23 and 2024-25, to $2.17 billion. Growth of aquaculture is projected to continue over the medium term, increasing by 5% in real terms to reach $2.21 billion by 2028–29 (Figure 3). Real prices for salmonids, prawns, abalone and tuna are expected to ease over the medium term, but growth in production volumes for these species will support further aquaculture industry growth as a whole.
The significant expansion of Tasmanian aquaculture in the previous two decades is anticipated to continue, though at a slower pace, as Australia’s broader aquaculture industry matures. Marine farming in Macquarie Harbour is currently subject to consideration under the Environment Protection and Biodiversity Conservation Act 1999 (EPBC Act). Depending on the outcome of this consideration, salmon production in Macquarie Harbour may be impacted.
The onset of the COVID-19 pandemic together with trade disruptions, particularly the ceasing of direct export of rock lobster to China, led to significant falls for real export prices of trade exposed wild-caught species. Though wild-caught production volumes remained relatively stable, the decline in prices caused a significant fall in the value of the industry from 2018–19 to 2021–22. Forecast continued high inflation over the medium term combined with an expected appreciation of the Australian dollar is expected to lead to further declines in wild-caught real prices. Over the medium term, wild-caught production is expected to remain stable as most wild-caught fisheries in Australia are at sustainable levels with limited opportunity for further growth.
Figure 3 Real value of Australian aquaculture and wild-caught fisheries, 2003–04 to 2028−29
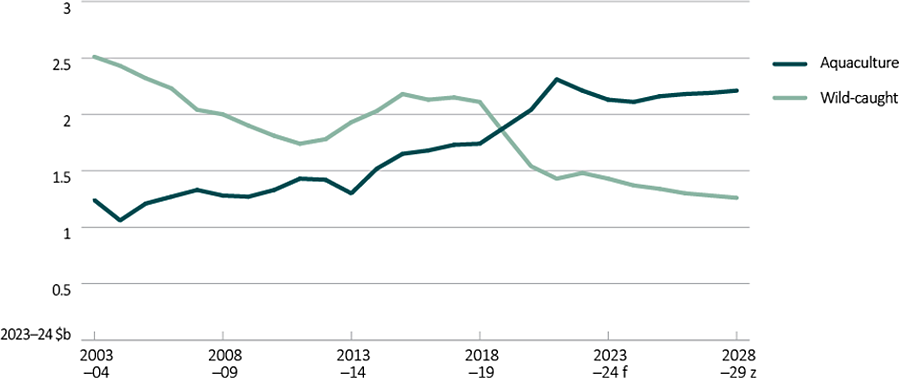
Source: ABARES
The value of fisheries and aquaculture product exports is forecast to fall by 2% in nominal terms to $1.43 billion in 2023–24 (Figure 4), followed by a further 4% fall in nominal terms to $1.37 billion in 2024–25. This reflects lower expected export volumes and prices for salmonids in 2023–24 and rock lobster in 2024–25. Slowing consumption of seafood in some Asian countries will also contribute to the decline in Australian seafood exports in these years.
Over the period 2024–25 to 2028–29 Australia’s exports of rock lobster are expected to continue to be disrupted by ongoing commodity-specific trade issues. These factors have affected aggregate export value in 2023 and early 2024 calendar years and are assumed to continue into 2025 and over the medium term.
Figure 4 Real value of Australian fisheries and aquaculture exports, 2008–09 to 2028–29
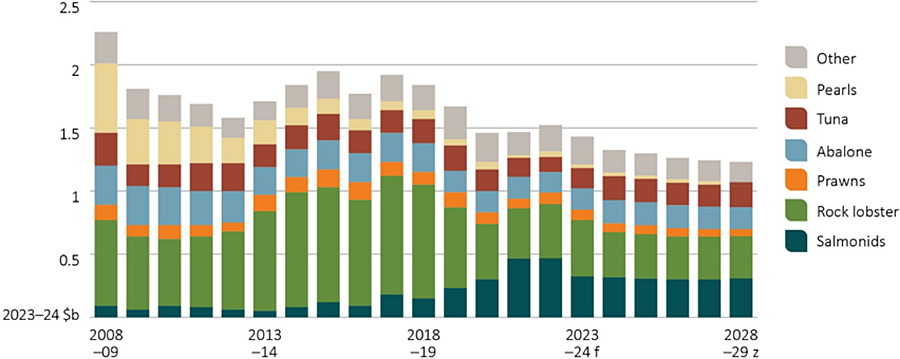
Source: ABARES
Over the medium term the real export value of fisheries and aquaculture products is projected to fall by around 2% a year to $1.23 billion by 2028–29. An expected appreciation of the Australian dollar is projected to lower beach prices received by producers over this period.
At an international level other risks and uncertainty may impact Australian seafood exports. Climate change is a significant uncertainty affecting the export sector as it has the potential to substantially impact global seafood production and the pattern of seafood trade. Other uncertainties include the increased focus to limit the environmental impact of seafood production (particularly in China) and a recent (yet to enter into force) agreement at the World Trade Organisation to limit subsidies in capture fisheries. How the Australian seafood sector more broadly repositions itself in the face of these challenges, including the extent to which it continues to diversify export markets and trade channels, will help determine the longer-term recovery in export value.
Outlook for key species
Key points
- The nominal production value of rock lobster is forecast to increase in 2023−24 to $403 million in nominal terms, due to higher prices from tight supply of live lobster exports to key Asian markets from North America.
- Production and export value is expected to fall from 2024−25 due to lower projected real landing prices, as an expected appreciation of the Australian dollar dampens export prices (Figure 5).
- Export diversification is expected to be limited, but steadily continue, away from China to other destinations in the north Asia and ASEAN regions and to the United States. The resumption of direct export of rock lobster to China remains a key uncertainty for the projections in this outlook. If this resumes, production and export values would likely be higher than those projected here.
Figure 5 Rock lobster real gross value and real export value, 2008−09 to 2028–29
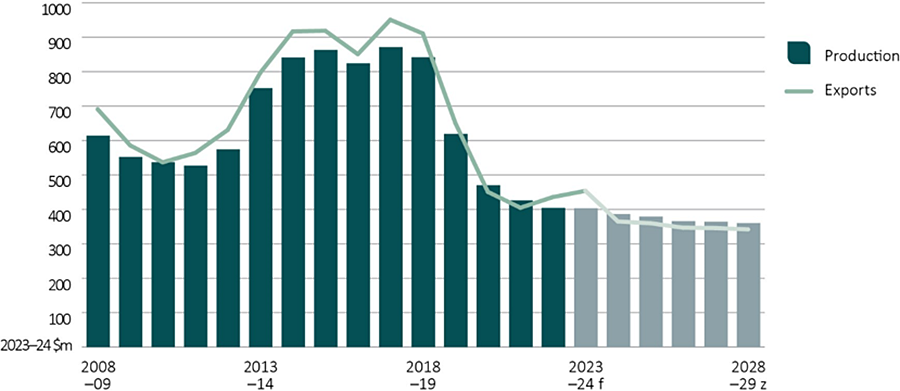
Source: ABARES
Key points
- The nominal production value of salmonids is forecast to fall by 2% to $1.32 billion in 2023–24 and decline in 2024–25 in real terms due to global growth of salmonids production putting downward pressure on domestic farmgate prices.
- Over the medium term the real value of salmonids production is projected to increase by 1% annually (a slower pace than the last two decades), reaching $1.36 billion, driven by a moderate rise in production volumes (Figure 6). The projected growth in volumes produced is expected to be sufficient to maintain current levels of per person consumption of salmonids in Australia, at around 2 kg per person.
- Marine farming in Macquarie Harbour is currently subject to consideration under the EPBC Act. Depending on the outcome of this consideration, salmon production in Macquarie Harbour may be impacted.
Figure 6 Salmonids real gross value and real export value, 2008−09 to 2028–29
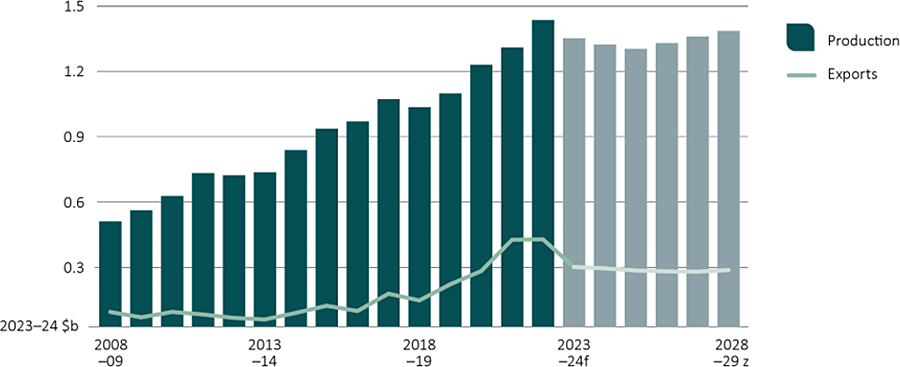
Source: ABARES
Key points
- In 2023–24 the nominal production value of abalone is forecast to increase by 2% to $152 million, driven by higher prices and remain stable in real terms in 2024–25.
- Abalone is predominantly exported. Over the medium term, production value is projected to decline annually by 1% on average a year, due to lower real prices of abalone exports as an expected appreciation of the Australian dollar dampens export prices (Figure 7).
- Australia accounts for 30% of global wild-caught abalone production and is the world's second largest exporter of wild-caught abalone product, which attracts a premium in the export market. Prospects for further growth of aquaculture abalone remain positive with aquaculture projects being assessed for commercialisation in several regions. Aquaculture is projected to grow its share and represent 38% of production by 2028–29.
Figure 7 Abalone real gross value and real export value, 2008−09 to 2028–29
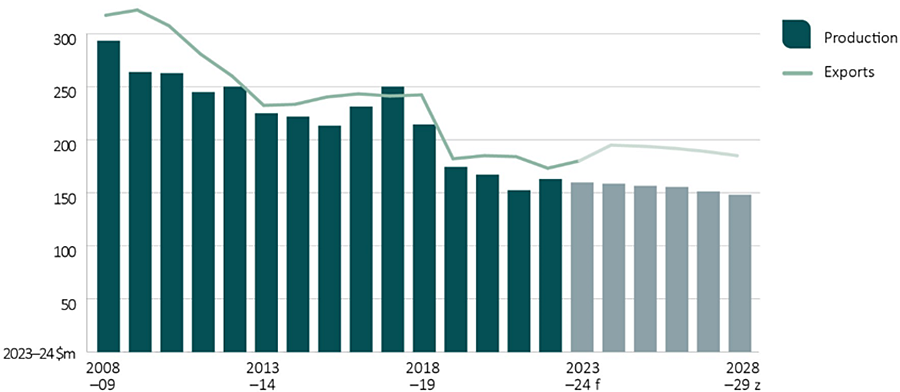
Source: ABARES
Key points
- In 2023−24 the nominal production value of tuna is forecast to increase by 3% to $165 million and then grow by a further 14% in 2024−25 due to higher southern bluefin tuna production after an increase to the global total allowable catch.
- Real production value of tuna is forecast to peak at $185 million in 2025−26 and then ease to $171 million by 2028−29 (Figure 8), reflecting lower expected real prices over the medium term.
- Tuna production is predominantly exported with the value of exports influenced by overall total allowable catch settings and exchange rate movements. Nominal tuna export value is forecast to peak at $196 million in 2024−25, following a rise in the total allowable catch of southern bluefin tuna, and then decline in real terms through to 2028−29 as an expected appreciation of the Australian dollar dampens export prices.
Figure 8 Tuna real gross value and real export value, 2008–09 to 2028–29
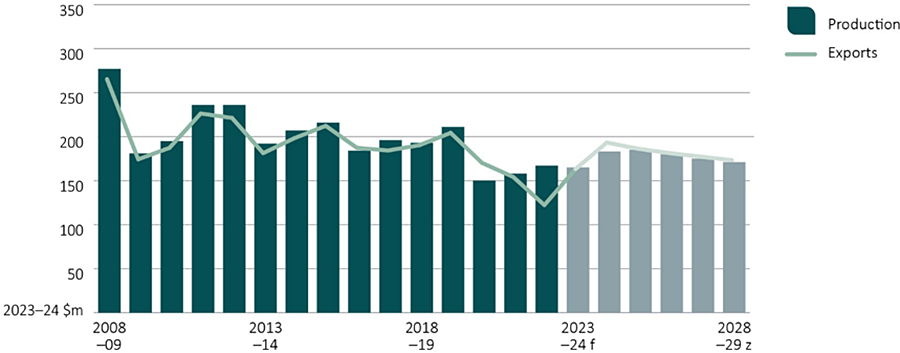
Source: ABARES
Key points
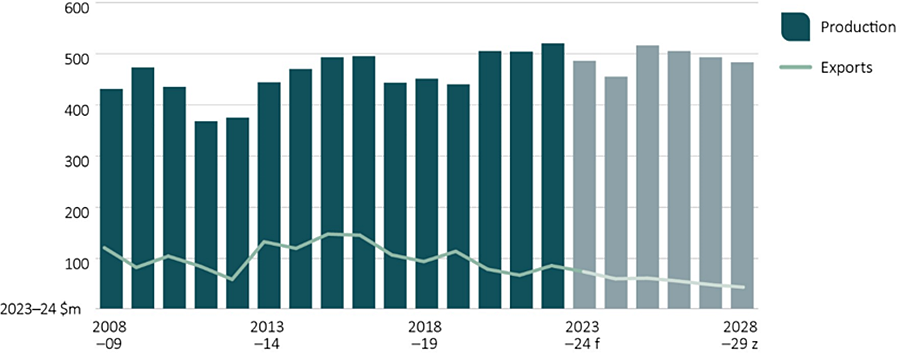
- In 2023−24 the nominal production value of prawns is forecast to decrease by 3% to $484 million following a bumper season for wild-caught catch in 2022−23, then decline by a further 3% to $467 million in 2024−25 as a result of lower wild-caught catch and lower international prawn prices.
- Over the medium term, real production value of prawns is forecast to peak at $514 million in 2025−26 as a result of the planned expansion of the prawn aquaculture, before declining to $481 million by 2028−29 as the expected rise in the Australian dollar increases import competition and dampens domestic prices (Figure 9).
- There are limited opportunities for major wild-caught fisheries to expand catch.
Figure 9 Prawns real gross value and real export value, 2008–09 to 2028–29
Source: ABARES
Download the report
Australian fisheries and aquaculture outlook to 2028–29 (PDF - 1.2 MB)
Australian fisheries and aquaculture outlook to 2028–29 (DOCX - 1.8 MB)
Outlook tables – Agricultural commodities: March quarter 2024 (XLSX - 195 KB)
Statistical tables – Agricultural commodities: March quarter 2024 (XLSX - 552 KB)
Previous reports
ABARES Annual Fisheries Outlook – March 2023 PDF [1.36 MB]
ABARES Annual Fisheries Outlook – March 2022 PDF [1.17 MB]
ABARES Annual Fisheries Outlook – March 2021 PDF ![]() [1.7 MB]
[1.7 MB]
ABARES Annual Fisheries Outlook – March 2020 PDF ![]() [1.2 MB]
[1.2 MB]