
Authors: Nyree Stenekes, Jenifer Ticehurst and Tony Arthur
How to use this dashboard*
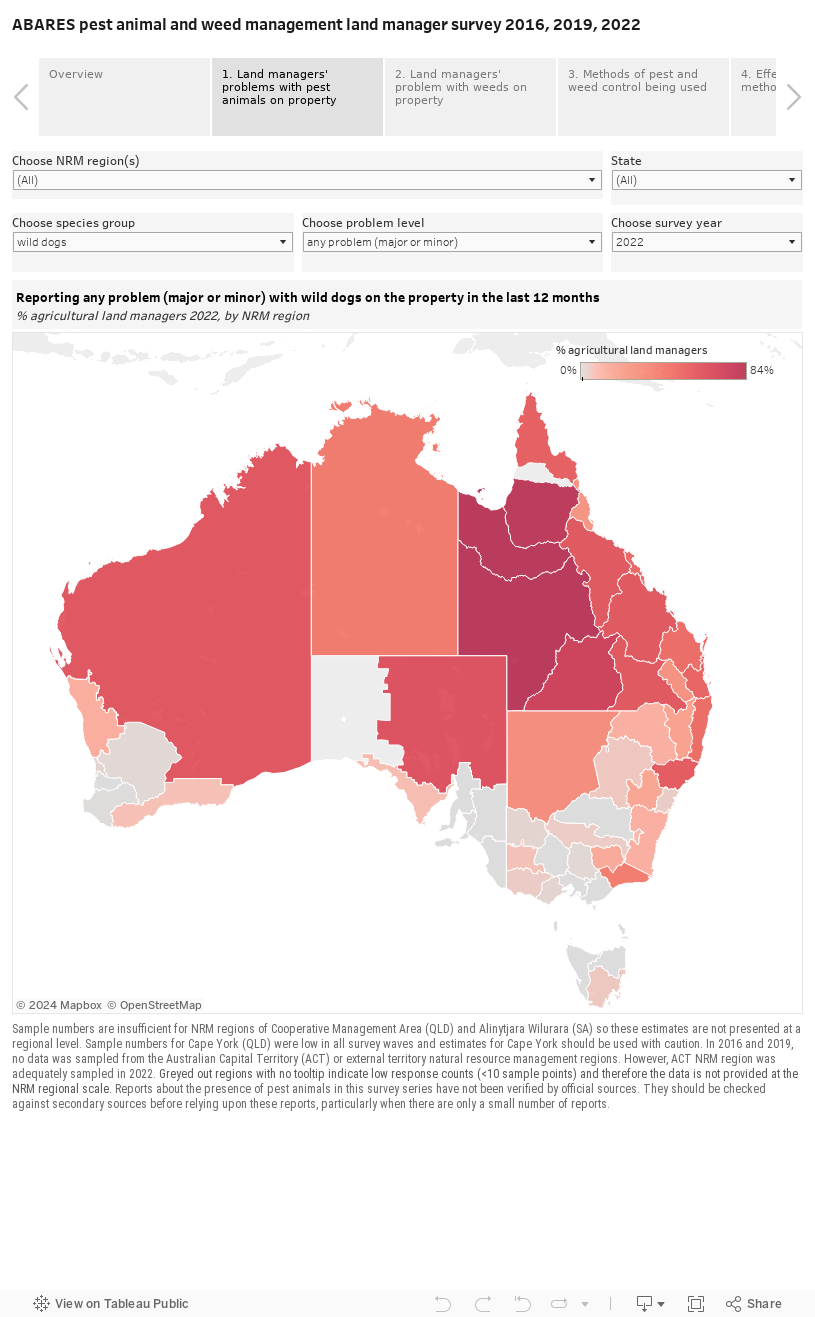
- Scroll left and right across the numbered topics in the banner at the top of the dashboard, then select a topic of interest.
- Then down the page, on the map, hover over a region to see information pop up about the region.
- Then choose from filters that are available in the drop-down menus above the map (such as NRM regions, State or species group) to show that selected information on the map. Note that the legend will change with each map selection. If a blank map or chart appears, just select a different filter in the drop-down menus.
- To download the data behind each viz, click the ‘Download’ button in the ribbon under the viz, and select file format ‘Crosstab’ to generate a spreadsheet with the data.
This Tableau dashboard may not meet accessibility requirements. For information about the contents of these dashboards contact ABARES.
Introduction
This report presents the key results from a national survey of agricultural land managers about pest and weed management on their property and local area undertaken by ABARES in 2016, 2019 and 2022. The pest animal and weed management survey series are funded through the Department of Agriculture, Fisheries and Forestry’s established pest animal and weed programs.
The survey respondents represented land managers across broadacre, horticulture, dairy and other livestock (poultry, deer, goats, horses, bee-keeping) industries, each with an estimated value of agricultural operations (EVAO) of $5000 per year or more, across 53 natural resource management regions in Australia.
The data were collected through a combination of hardcopy postal and online versions of the survey. The survey was completed by 6221, 7751 and 5380 sampled agricultural land managers, in 2016, 2019 and 2022, respectively. This equated to a response rate of 52% in 2016 and 2019, and 41% in 2022. There was an increase in the proportion of ‘return to sender’ (address not known) and ‘out of scope’ agricultural businesses (e.g. not farming) in 2022. To account for the sample design, and better represent the total farming population from the survey respondents, new methods have been applied to weight the estimates for all three survey results. Consequently, some values presented here for 2016 and 2019 differ from those published in previous reports.
About 77% of responses received were via the postal survey in 2016, while in 2019 56% were from the postal option, and in 2022 55% were postal returns. This shows a sustained preference for paper response options among the farming population, but an increasing willingness to participate using online modes.
This report contains a summary of national results on topics including:
- the level of the problem with pest animals and Weeds of National Significance (WoNS)
- impacts of pest animals and weeds
- pest animal and weed management activities on the property and in the local area
- information sources and participation in local support networks
- and changes between 2016, 2019 and 2022.
Changes in many of the results presented on pest animal and weed management between the 2016, 2019 and 2022 surveys are potentially linked to the differences in the level of agricultural activity and practices used on farms due to many factors. These may include changes in land manager perceptions or tolerance of pest / weed species, landuse changes, the effectiveness of any wide-spread management, and responses to climatic conditions or natural ecological events such as droughts, floods, or plagues that occurred between the surveys. These changes are likely to have influenced the distribution, abundance and impacts of pest animals and weeds and the levels of activity around their management.
Key national findings
- At least 85% of land managers reported feral animal problems on their property in all surveys since 2016.
- Most common problem species/groups across all three surveys were foxes, rabbits/hares, rats or mice and native animals and birds, with about 50% of land managers, or more, reporting these.
- There was a decline in the proportion of land managers having problems with foxes (59% in 2016 to 54% in 2022) and rabbits/hares (57% in 2016 to 48% in 2022), and there was minimal change in the proportion of land managers reporting other species (including native animals and birds which stayed at about 60%; and introduced birds, feral cats, wild dogs feral pigs and ‘other’ pests which stayed at about 25%).
- Despite a small change in survey design, the proportion of land managers reporting a major problem with rats and/or mice in 2016 and 2019 was no more than 11%, but in 2022, 20% of land managers reported a major problem with mice alone.
- Around 60% of land managers reported Weeds of National Significance (WoNS) problems on their property in the 2019 and 2022 surveys.
- Of the 32 Weeds of National Significance (WoNS), Blackberry (reported by 22.9% of land managers), African Boxthorn (13.5%), Lantana (12.7%) and Fireweed (11.4%) were the most common weeds reported for creating problems in 2022.
- The percent of land managers reporting problems with Blackberry and Broom had a meaningful change from 2019 to 2022. Those reporting problems with Blackberry decreased from 26.5% to 22.9%, and those reporting Broom increased from 2.2% to 3.3%.
- The proportion of land managers reporting various impacts from pests and weeds varied greatly across years, and between impacts.
- In 2022 it was common for native animals and birds, insects and other pests to damage crops or decrease crop production (reported by > 50% of land managers with pest animals on property).
- Native animals and birds also commonly cause damage to property (43% of land managers with pest animals reported this in 2022).
- Feral animals most commonly cause crop damage or decreased crop production (reported by 45% of land managers with pest animals), decreased livestock production (48%) and damage to property/infrastructure (47%) in 2022.
- The most commonly reported weed impact was a decrease in the value of production. The proportion of land managers reporting this impact has remained about the same in 2022 as 2019, after a substantial drop from 2016 (72% in 2016, 51% in 2019 and 52% in 2022 of those who reported any weed impact).
- Other common impacts from weeds include decreasing value of property and increasing fire risk (reported by ≈20% and ≈15% of land managers who reported any weed impact, respectively in 2022).
- About three-quarters of land managers continue to manage pest animals on their properties.
- Ground shooting was the most common management activity on pest animals, used by about 75% of land managers reporting any pest management activities, and it was reported as being very or moderately effective by about two-thirds using it. Pesticide and/ or insecticide use and ground baiting were also popular control measures (used by about 50% of land managers), and were rated as effective (reported as very or moderately effective by 93% and 80% of land managers using it, respectively in 2022).
- Of those reporting any pest management, the proportion of land managers using aerial baiting doubled from 2016 to 2019, and then remained stable (3.4% to 7.6% in 2016 and 2019 and stayed at 7.6% in 2022). Of those who were using this method, the proportion of land managers who rated it as very or moderately effective dropped from 71% in 2016, to 42% in 2019 and then back up to 79% in 2022.
- More than 80% of land managers are actively managing weeds on their properties.
- The application of herbicides continues to be the most common weed management activity, used by about 90% of land managers who manage weeds, and it continues to be an effective management option, rated as very or moderately effective by more than 90% of the land managers using the method.
- There was variability in the reported use of biological controls for weed management across surveys. This ranged from 3.8% of land managers using biological control in 2016, to 9.6% in 2019, and then back to 4.4% in 2022. Of those using biological controls, 67% of land managers rated it as effective (very effective plus moderately effective) in 2016, dropping to 41% in 2019, and back to 62% in 2022.
- 86% of land managers spent on average about $21,950 on pest and/or weed management in 2022. This was a similar proportion to the 84% of land managers who invested in management in 2019, but they only spent about $15,200 on average. In 2016 substantially more land managers (94%) invested in management, and their average expenditure per property was more ($23,600). Note that all spend figures for 2016 and 2019 have been adjusted for inflation using the consumer price index (CPI) so they can be compared with 2022 figures.
- The average expenditure on pest management increased from 2016 to 2022 ($7,480 in 2016, $8,867 in 2019 and $10,434 in 2022). The pattern in average spending on weed management was variable ($15,796 in 2016, dropping to $8,849 in 2019, then $13,750 in 2022).
- Across all farms, owner/operators spend about 4 times as many days (on average about 60 days a year) managing pests and weeds compared to contractors, employees and other people (on average about 13 additional days). Terrestrial weed management takes the most time of land managers (about 22 days a year per property), with contractors spending another 5 days a year on average per property.
- About 5% of land managers received a government grant for pest and weed management in the 12 months prior to the 2022 survey, and over half (57%) said that it covered no more than 20% of their total expenditure on pest and weed management for the property in that time.
- In 2022, 50% of land managers reported that pest animal management activities were being undertaken in their local area by an agency or group, similar to 2019 (52%). These are lower proportions reported compared to 65% in 2016.
- Ground baiting, ground shooting and the use of pesticides and/or insecticides were the most common practices in the local area, reported by about 30%, 25% and 15% of land managers. There was a drop in use of all three practices across the survey periods.
- Fewer land managers reported that pest management activities in their local area were effective in 2022 compared to 2019 and 2016. The greatest drop in effectiveness being for fox management (42% of land managers thought it was effective in 2016, 33% in 2019, 32% in 2022). There was a lot of uncertainty about the effectiveness of local area management activities on some pests with about 75% (or more) being unsure about the effectiveness of management on feral camels, feral horses/donkeys and freshwater pests, although the number of people reporting these pests are small.
- Of those reporting weed management in the local area, about 40% of land managers rated terrestrial weed management in the local area as effective, and 12% rated aquatic weed management as effective.
- The most common activities and programs, in which about 10% of land managers participated, were delivered by local government, regional NRM/Catchment Management Authority/Local Land Services agencies, and Landcare groups. About 70% of land managers were not aware that these service providers’ activities were happening in their local area.
- In 2022, 9.7% of land managers were members of at least one pest or weed management group. This had not changed much since 2019, but there was a meaningful increase from 7.6% in 2016.
- In 2022, 79% of land managers who were members of pest management groups reported that the group had a management plan, which was more than for weed management groups (58%).
Read the full national report
Download
A revised version of the report with an errata was published on 1/2/2024.
Pest Animal and Weed Management Survey 2016/2019/2022 National land manager survey results with errata (PDF 641 KB)
Pest Animal and Weed Management Survey 2016/2019/2022 National land manager survey results with errata (DOCX 1.87 MB)
If you have difficulty accessing these files, visit web accessibility for assistance.
Additional analysis
NSW land manager survey custom results 2016/2019/2022
Custom survey results for NSW were derived from the ABARES national survey to support an independent state-wide review into invasive species management for NSW being conducted by the NSW Natural Resource Commission (NRC).
Download
Pest animals and weed management survey 2016/2019/2022 – NSW land manager survey custom results (PDF 688 KB)
Pest animals and weed management survey 2016/2019/2022 – NSW land manager survey custom results - Report (DOCX 1.05 MB)
If you have difficulty accessing these files, visit web accessibility for assistance.
Previous pest animal and weed management survey national reports
We advise you to use the most recent national survey report, because we have refined our data analysis and some values may have been updated. However, if you require previous ABARES national survey reports, they are available from the archive in the ABARES Publications Library at the links below.
Download
Pest Animal and Weed Management Survey 2016 National landholder survey results
Pest Animal and Weed Management Survey 2016-2019 National land manager survey results
If you have difficulty accessing these files, visit web accessibility for assistance.