
2021–22 to 2023–24
Recent farm performance
- Around 39% of Australian farm businesses are classified as broadacre livestock farms (34,000 farms), of which 22,100 were beef specialists, 8,900 were sheep specialists, and around 3,000 produced a mix of beef cattle and sheep (see Methodology).
- Farm incomes for livestock farms are estimated to have fallen in 2023–24 because of lower prices for beef cattle, sheep, lambs and wool. However, increased turnoff of cattle and sheep is expected to have moderated this decrease.
- At the national level, average farm cash income for specialist beef farms is estimated to have decreased by around 66% to $65,000 per farm in 2023–24. This estimate is 60% below the average in real terms (see Methodology) for the 10 years to 2022–23 (Figure 1).
- For specialist sheep farms, average farm cash income is estimated to have decreased from around $91,600 per farm in 2022–23 to an estimated loss of $23,000 per farm in 2023–24. This estimate for 2023–24 is well below the average in real terms (see Methodology) for the 10 years to 2022–23 of $128,400 (Figure 1).
- The gap between farm cash income and farm business profit has widened from 2022–23 to 2023–24 for both specialist sheep and beef farms, due to the decrease in the value of trading stocks as a consequence of reduced sheep and cattle numbers.
The PowerBI dashboard may not meet accessibility requirements. For information about the contents of these dashboards contact ABARES.
Figure 1 Farm cash income, livestock farms, Australia, 1999–2000 to 2023–24
average per farm
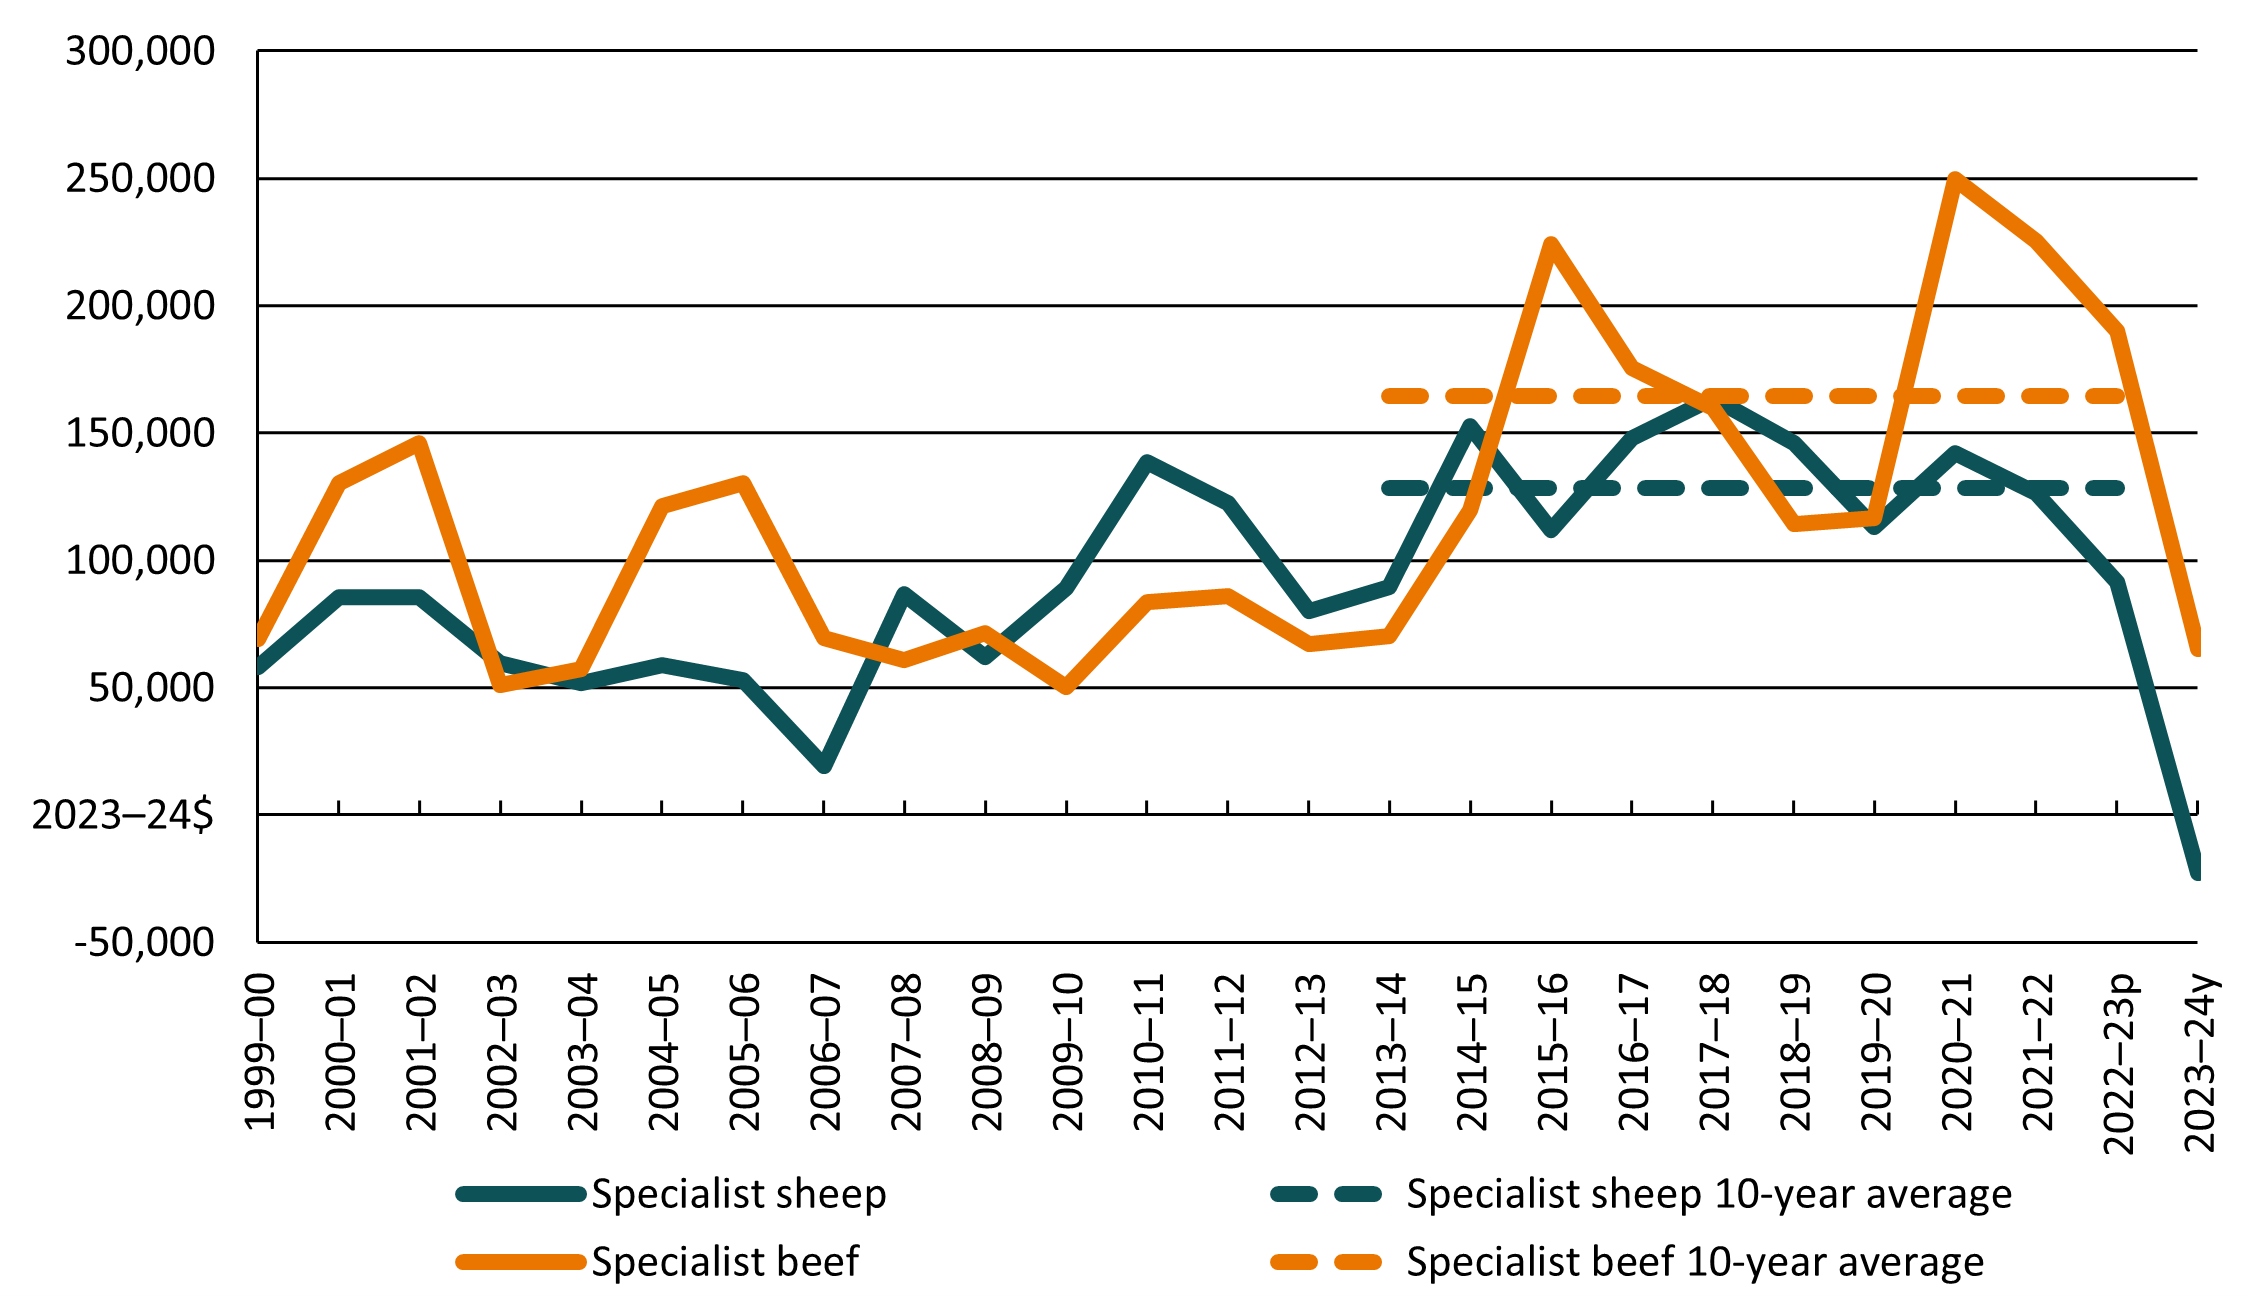
Source: ABARES Australian Agricultural and Grazing Industries Survey
Changes in farm numbers
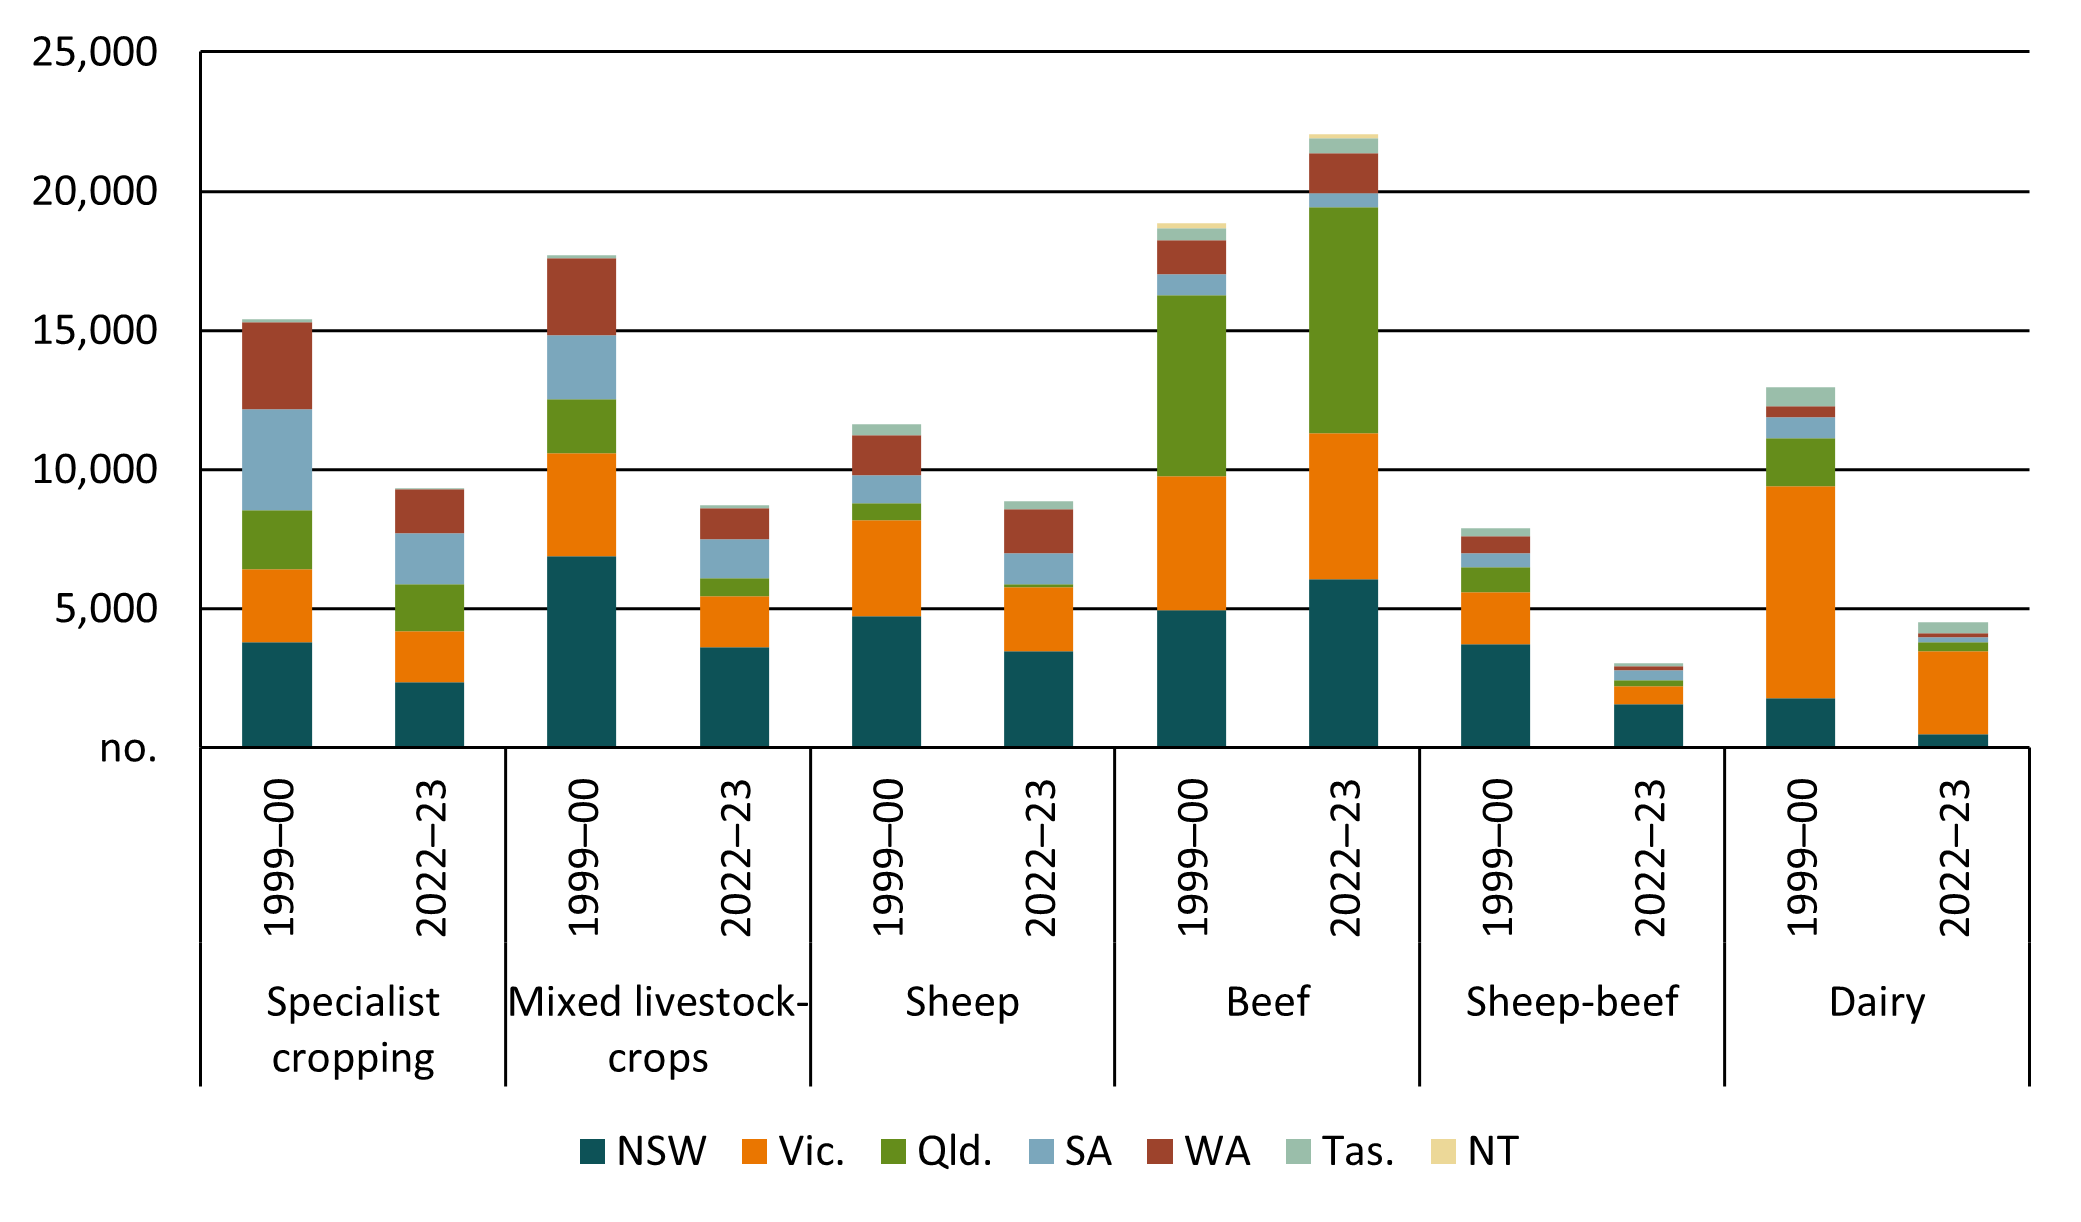
- The number of broadacre and dairy farms in Australia declined by around 33% from 1999–2000 to around 56,500 farms in 2022–23. The number of specialist beef farms increased by 17%, with many specialist sheep farms (down by 24%) and sheep-beef farms (down by 61%) switching to beef production (Figure 2).
- The number of specialist beef producers increased in all states from 1999–2000 to 2022–23 except for South Australia (down 34%) and Northern Territory (down 27%). The largest increases were in Queensland (25%) and New South Wales (23%).
- The largest declines in specialist sheep farms were in New South Wales (27%), Victoria (33%) and Queensland (82%), while the number of specialist sheep farms increased in South Australia (12%) and Western Australia (10%).
Figure 2 Change in number of farms, by industry and state
Changes in enterprise mix, receipts and costs
Specialist beef farms
- Total cash receipts for specialist beef farms increased at an annual average rate of 2.3% a year over the period from 1999–2000 to 2022–23. On average, around 85% of total cash receipts for specialist beef farms was from sales of beef cattle. This proportion remained unchanged over the period.
- Total cash costs for specialist beef farms increased at an annual average rate of 1.5% a year over the period from 1999–2000 to 2022–23.
- The ratio of cash receipts to cash costs has improved over the longer term at an annual average rate of 0.8% a year, reflecting small improvements in farm productivity.
Specialist sheep farms
- Total cash receipts for specialist sheep farms increased at an annual average rate of 1.5% a year over the period from 1999–2000 to 2022–23. The mix of receipts from sheep, lambs and wool changed significantly over the period. Receipts from sheep and lambs increased from around 21% of total cash receipts in 1999–2000 to 42% in 2022–23. Conversely, receipts from wool declined from around 38% of total cash receipts in 1999–2000 to 28% in 2022–23.
- Total cash costs for specialist sheep farms increased at an annual average rate of 1.4% a year over the period from 1999–2000 to 2022–23.
- The ratio of total cash receipts to total cash costs has improved slightly over the longer term at an annual average rate of 0.1% a year, reflecting small improvements in farm productivity.
- Sustained industry growth and resilience relies on businesses continually investing to improve efficiency, increase scale or replace older capital items with newer and more efficient technologies.
- Over the past decade, the amount invested each year by livestock farms making capital additions fluctuated broadly in line with movements in farm cash incomes. That is, spending on new capital tended to rise and fall in line with changes in farm profitability (Figure 3).
- In high income years many farmers invest surplus funds in farm development or purchasing capital equipment. Increases in incomes also provide additional funds to invest and/or stronger cashflows to service additional debt. However, the level of investment varies by farm size, with smaller farms often increasing their holdings of liquid assets in high income years rather than reinvesting back into their farm business.
Figure 3 Farm cash income and capital additions, livestock farms, 1999–2000 to 2022–23
average per farm
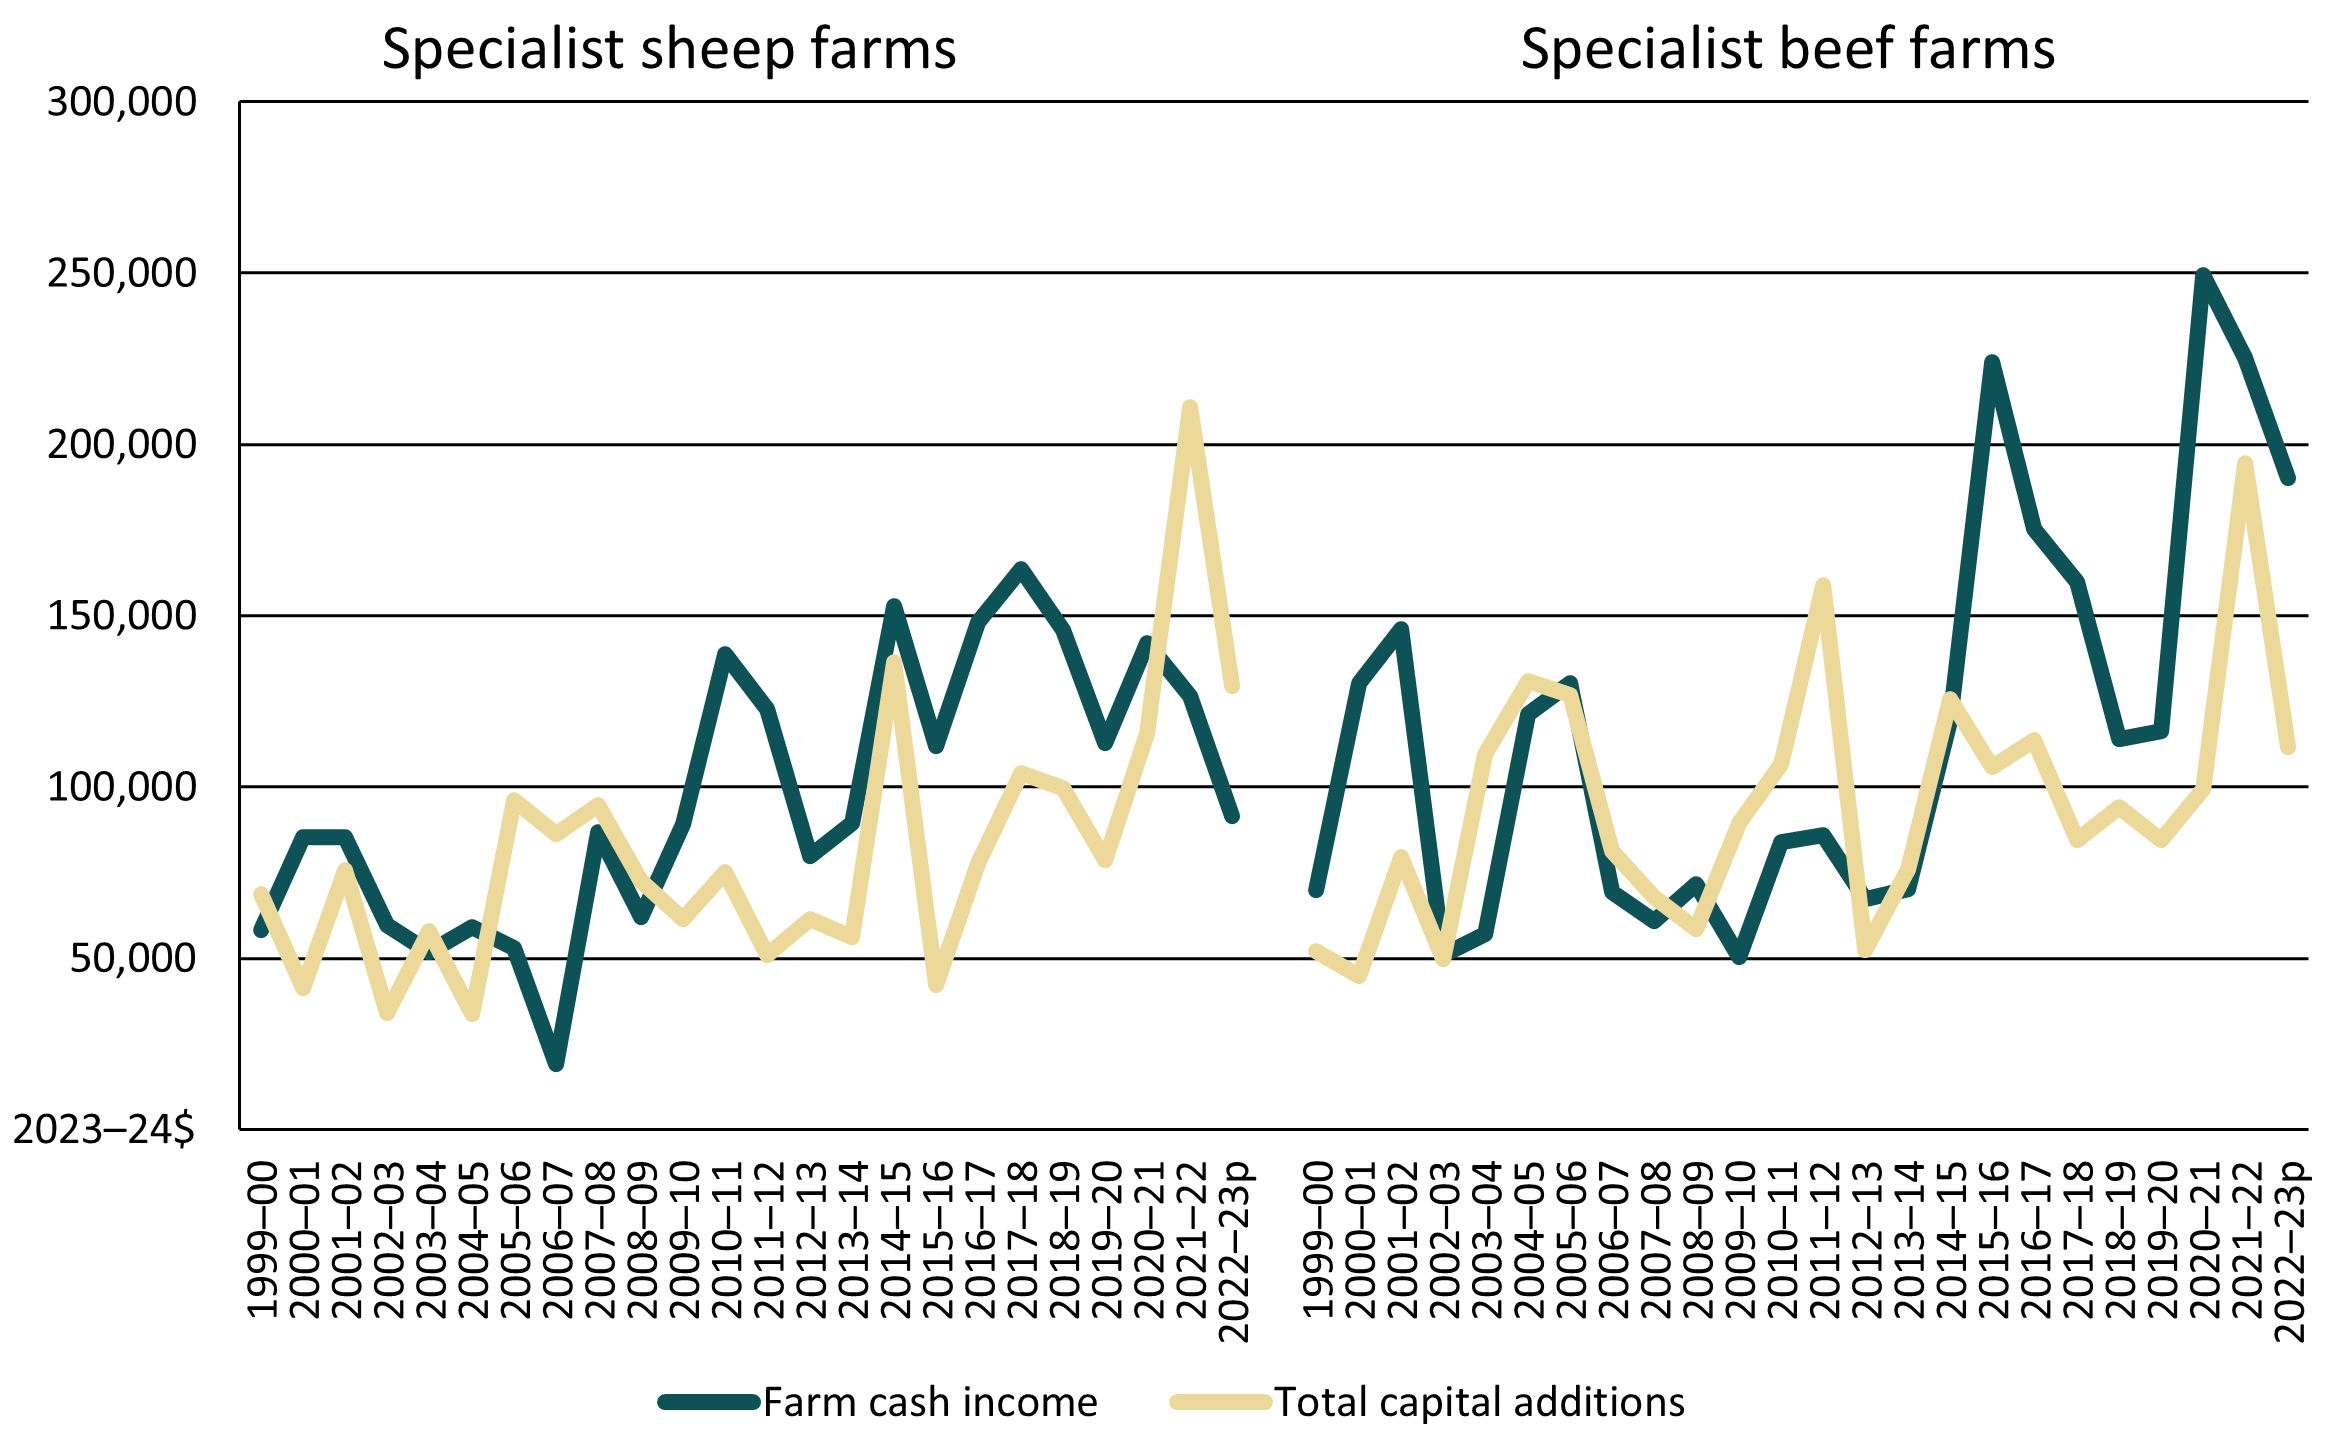
Source: ABARES Australian Agricultural and Grazing Industries Survey.
- The proportion of livestock farms investing in new capital each year averaged 55% for specialist sheep farms and 51% for specialist beef farms over the 10 years to 2021–22. In 2022–23—the most recent year for farm investment data—the proportion of livestock farms making capital additions declined, reflecting lower farm incomes in that year (Figure 4).
Figure 4 Percent of farms making capital additions, livestock farms, 1999–2000 to 2022–23
average per farm
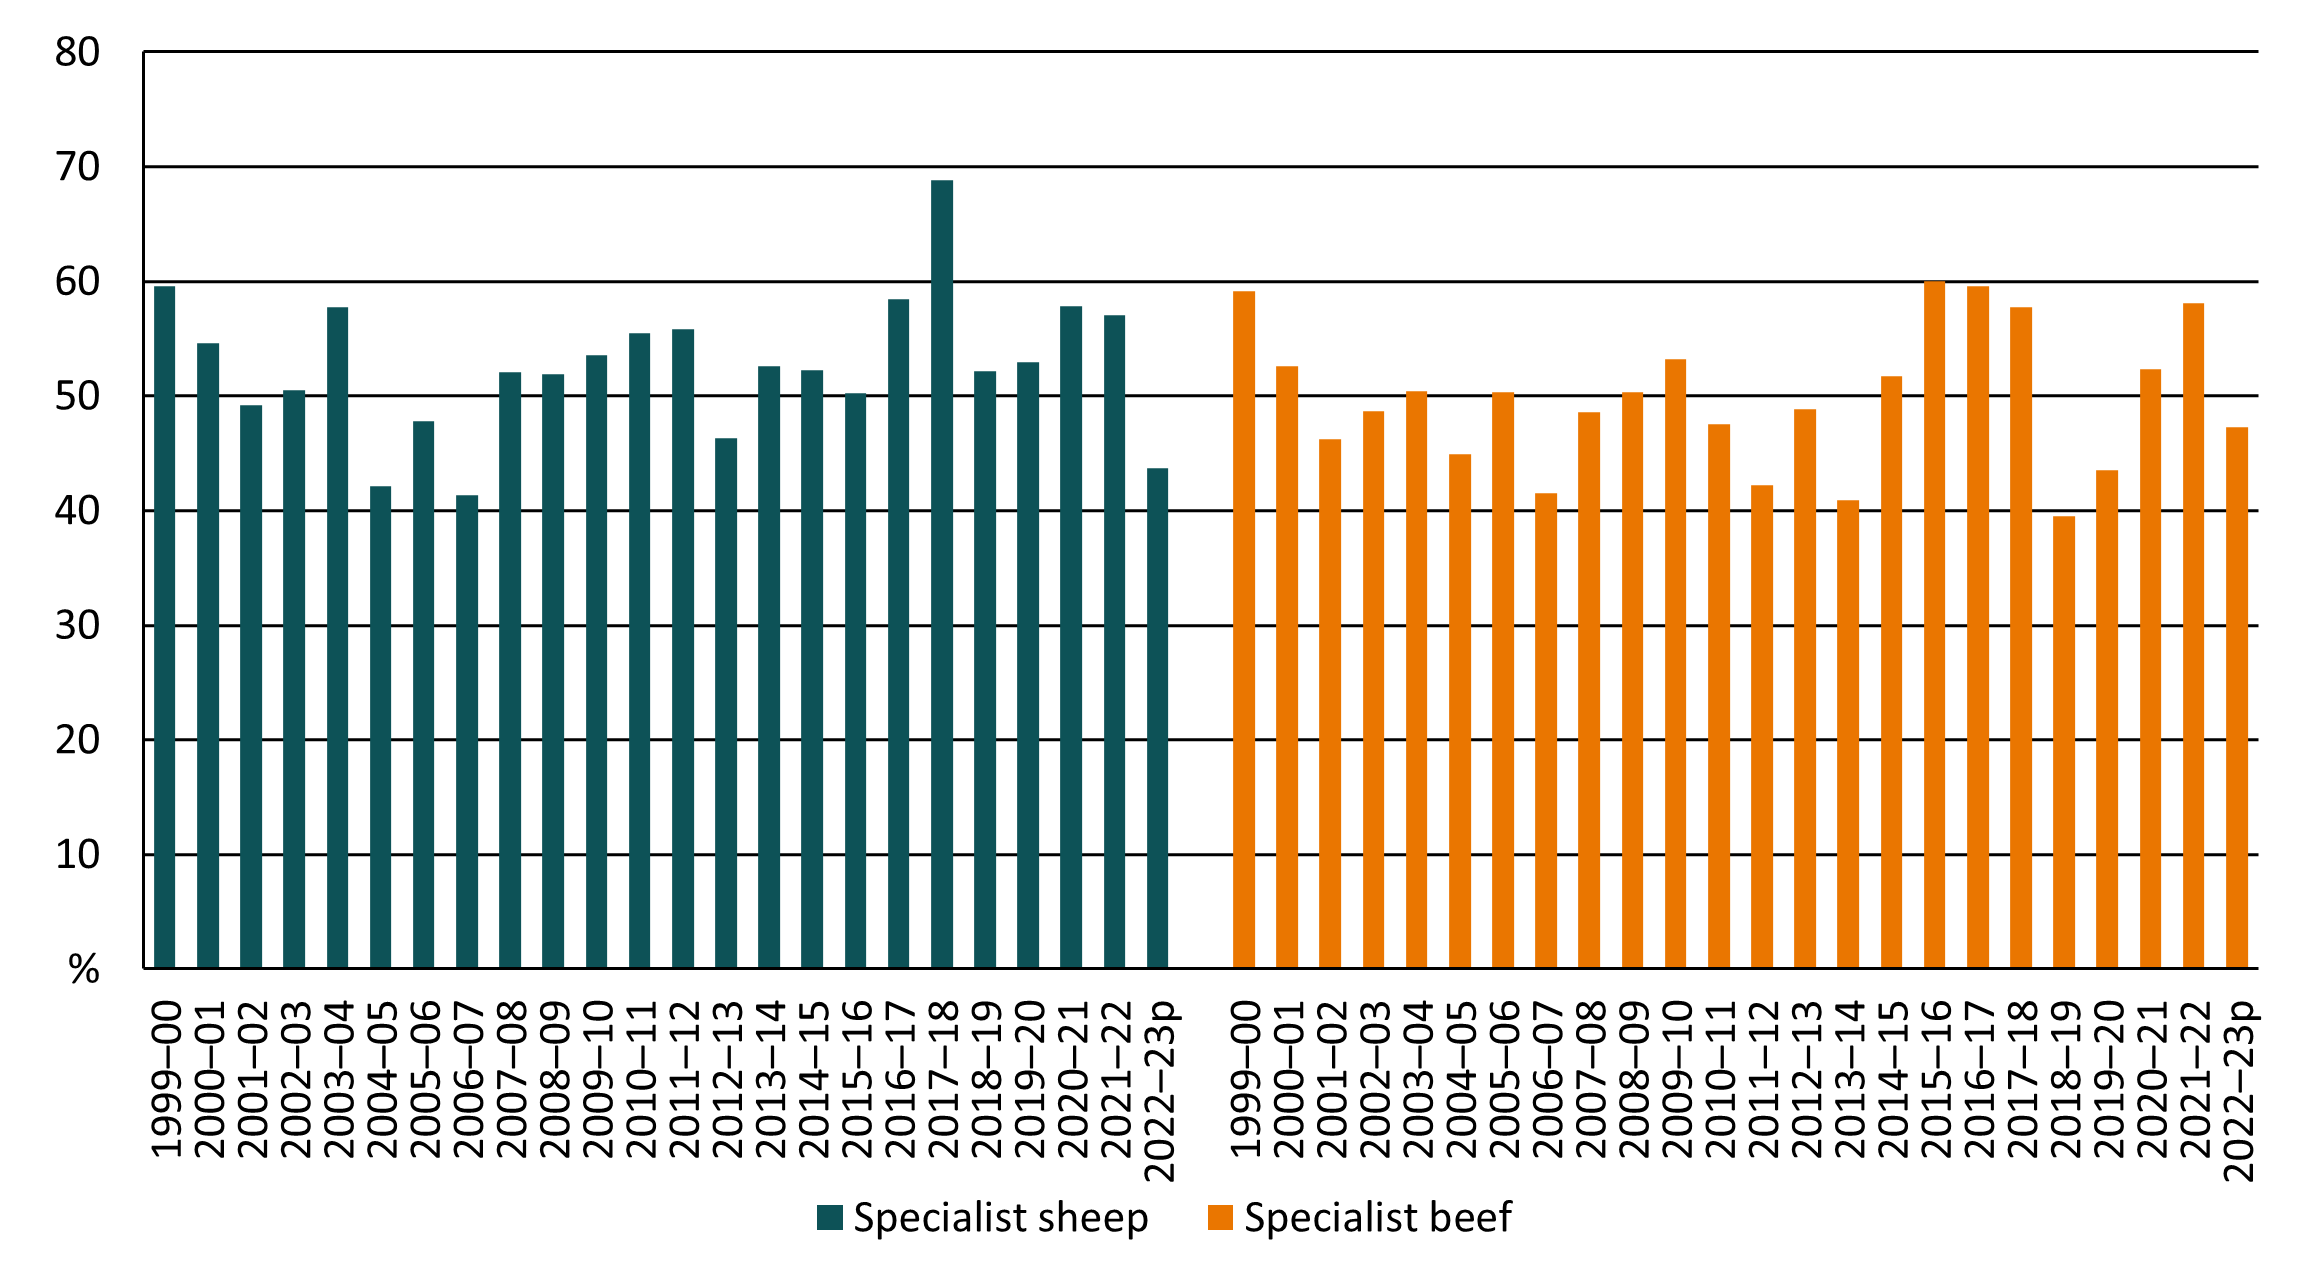
Source: ABARES Australian Agricultural and Grazing Industries Survey.
Types of farm capital
- The dominant type of capital used in Australian agriculture is ‘land’ capital. In 2022–23 land capital accounted for 85% of the total value of capital for specialist beef farms and 89% for specialist sheep farms (Figure 5).
Figure 5 Components of farm capital, broadacre and dairy farms, 2020–21 to 2022–23
average per farm
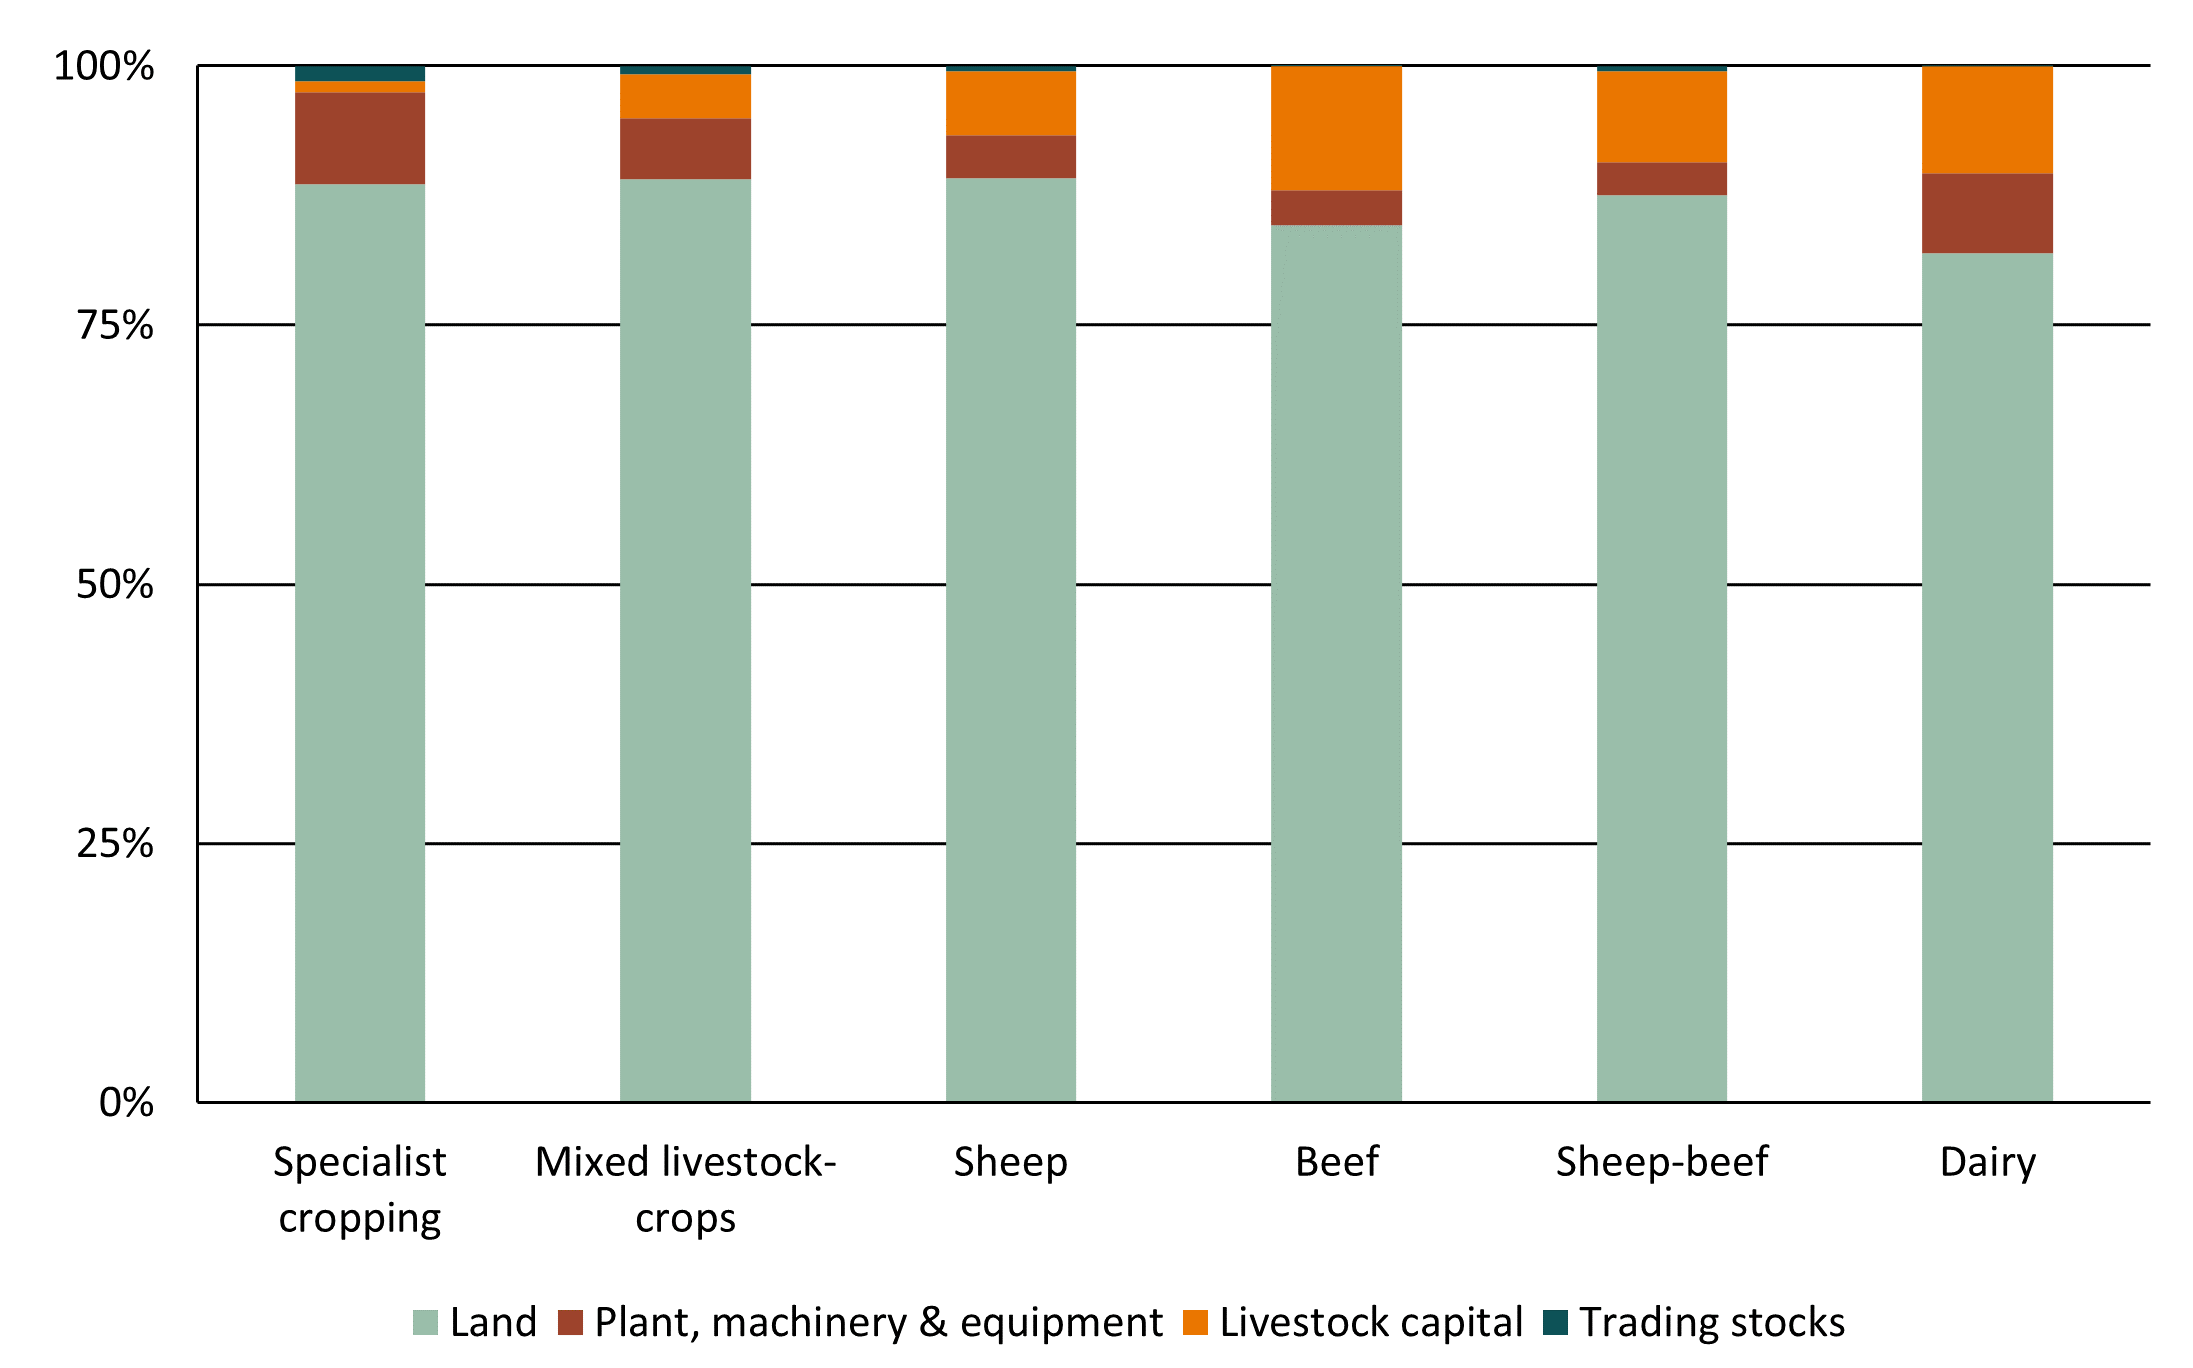
Notes: ‘Land’ capital is the market value of the land including the value of any fixed improvements such as buildings and structures, and permanently installed irrigation infrastructure. Trading stocks include the capital value of on-farm stocks of hay, fodder and grain.
- Many livestock farms have substantial holdings of liquid assets relative to farm household income that makes them well placed to withstand short-term downturns in income, although there is wide distribution across farm sizes (Figure 6).
- Non-farm income increases business resilience to shocks to farm financial performance for many farms. In particular, small livestock farms sourced the majority of their household incomes (farm cash income plus non-farm income) from non-farm sources from 2020–21 to 2022–23. The proportion of non-farm income was substantially lower for larger farms.
- Farm Management Deposits (FMDs) are an important financial risk management tool for many livestock farms and forms part of their liquid assets. At 30 June 2023, an estimated 21% of livestock farms held FMD accounts, at an average value of $307,700 per farm.
Figure 6 Farm household income and liquid assets by farm size, livestock farms, 2020–21 to 2022–23
average per farm
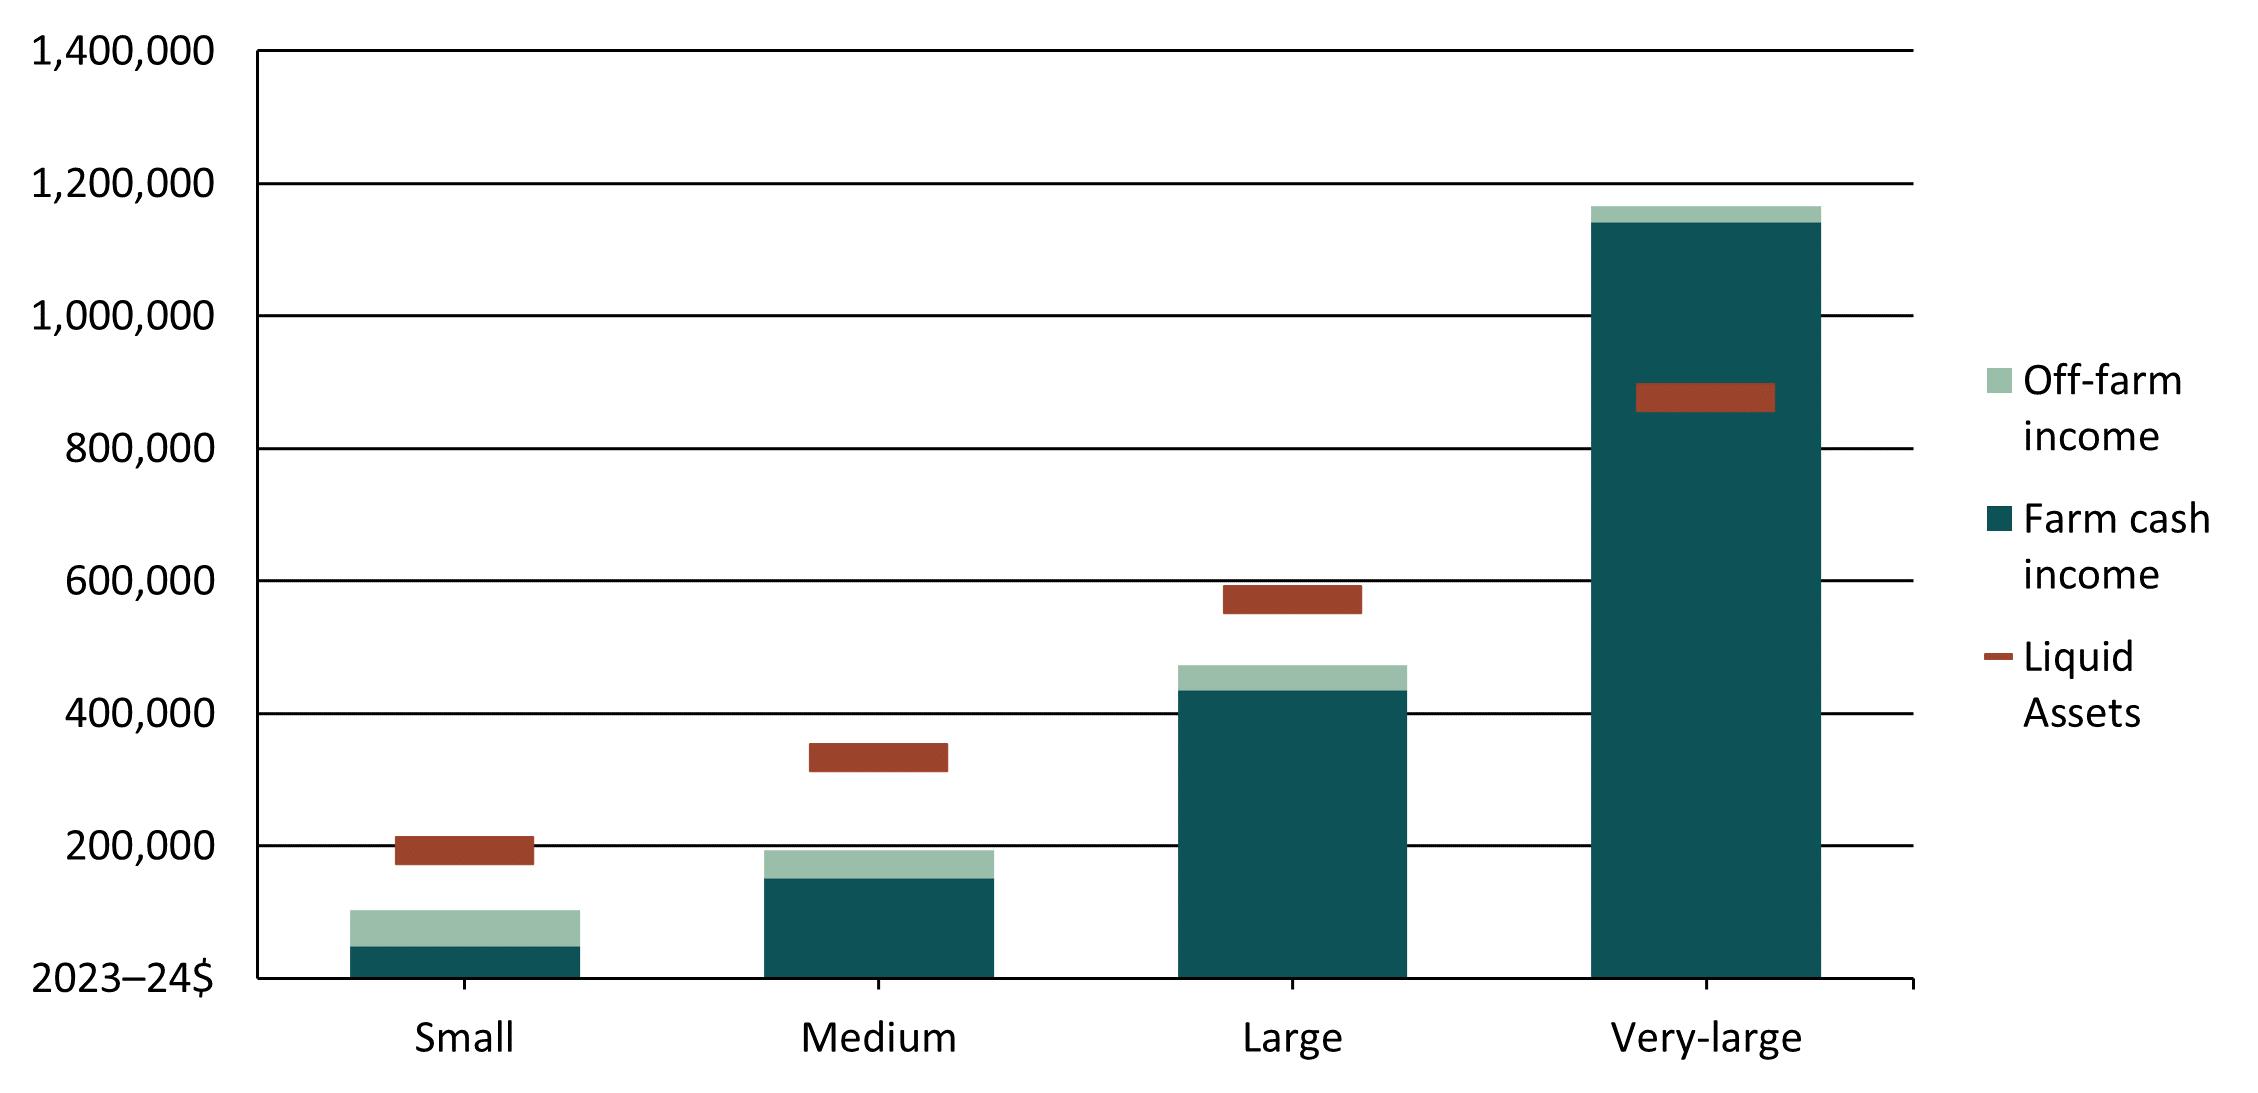
Source: ABARES Australian Agricultural and Grazing Industries Survey
The data in this report is drawn from ABARES Australian Agricultural and Grazing Industries Survey (AAGIS). AAGIS covers broadacre farms with an estimated value of agricultural operations (EVAO) greater than $40,000. Broadacre farms account for around 62% of all Australian farm businesses and they include the following industries (defined by Australian and New Zealand Standard Industrial Classification (ANZSIC)):
Cropping farms
Wheat and other crops farming: Specialised producers of cereal grains, coarse grains, pulses, and oilseeds.
Mixed livestock-crops farming: Farm businesses engaged in producing sheep and/or beef cattle in conjunction with substantial activity in broadacre crops such as wheat, coarse grains, pulses and oilseeds.
Sheep-Beef Cattle Farming: Producers who have a mix of sheep and beef cattle. Farms classified to sheep-beef industry combine sheep and beef enterprises such that neither enterprise dominates the other.
Livestock farms
Beef cattle farming: Specialised producers of beef cattle.
Sheep farming: Specialised producers of prime lambs, sheep or wool.
Sheep-beef cattle farming: Producers who have a mix of sheep and beef cattle. Farms classified to the sheep-beef industry combine sheep and beef enterprises such that neither enterprise dominates the other.
AAGIS provides a wide range of information on the current and historical economic performance of farm business units, including farm costs, receipts, income and profit, debt, assets, farm capital and labour, industry and farm size.
To reduce respondent burden and complexity of the survey ABARES developed a model-based approach to producing its projections of key estimates. Data in this report for 2023–24 are derived from this model.
Further information on ABARES farm surveys and survey methodology can be found on the ABARES website.
All dollar values in this report are expressed in real terms, adjusted to 2023–24 values. Adjusting to real terms removes the effect of inflation and allows financial values of different time periods to be compared in like terms. ABARES adjusts for inflation using the consumer price index produced by the Australian Bureau of Statistics (Australian Bureau of Statistics, 2024).
Previous versions of this and related reports.
Farm surveys definitions and methods
Further information about our survey definitions and methods.
The Farm Data Portal is an interactive tool containing all data from ABARES surveys of broadacre and dairy farms, and outputs from those surveys, all in the one location.