
Airborne electromagnetic (AEM) technology was originally developed for the mining industry where it continues to be used extensively. Subsequent technological innovation has developed and adapted AEM systems for natural resource management applications, with a number of recent AEM surveys focusing on environmental issues, such as salinity and water quality.
AEM measurements are taken using specially-equipped aircraft. The type of aircraft chosen depends on the level of spatial resolution (scale) needed. Fixed-wing AEM-equipped aircraft are typically time domain systems that measure how a signal changes over time. These are mainly used for larger survey areas and for deeper ground penetration. Frequency domain systems that measure how a signal changes across frequency bands are typically helicopter-mounted and are generally used where fine spatial resolution at shallow depth (less than 20 metres) is needed (figure 1; see also Spies & Woodgate 2005). Most AEM surveys are conducted with the aircraft flying at low altitude along straight parallel lines—called flightlines—with measurements recorded at regular intervals along those flightlines.
The aircraft are equipped with a coil running from nose to wingtips to tail, through which an electrical current is pulsed. This electrical current induces a magnetic field that penetrates the ground to depths of more than 100 metres provided the aircraft flies low enough. The magnetic field induces a weaker, secondary electrical current to flow through the ground. As the conductivity of the materials that make up the earth varies, the strength of the secondary current also varies. The secondary current moving through the ground produces a magnetic field with variations in the secondary magnetic field, which is detected by a receiver towed behind the aircraft (figure 1). It is this signal that is used to create bulk conductivity maps of the landscape. Moist salt stores are revealed by areas of high bulk conductivity; low bulk conductivities may indicate areas of fresh groundwater or dry, tight subsurface material (low porosity) or dry salt.
Figure 1: Fixed wing and helicopter mounted AEM survey equipment
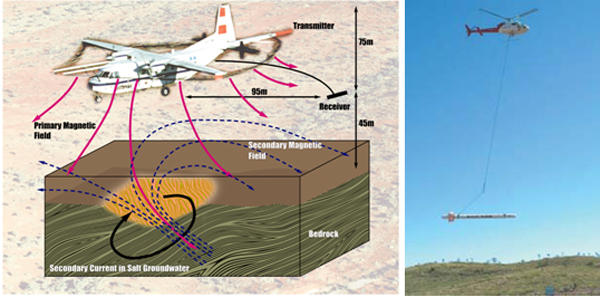
Source: Bureau of Rural Sciences and Spies and Woodgate 2005.
Calibration
The raw data produced by the airborne survey can be presented as a series of maps of the uncalibrated ‘bulk’ electrical conductivity of the earth at a series of depth intervals—from natural surface down to bedrock. Because this electrical conductivity may be caused by a number of different factors—including relative moisture, clay content or salt—the raw data needs to be calibrated to transform the bulk conductivity into maps of landscape salt stores or groundwater quality.
Bulk conductivity is a measure of how easily an electrical current can pass through a material. It is a complex function of several variables including the conductivity of solid materials and pore fluid, porosity, arrangement of pores and degree of saturation. The AEM system itself must be well calibrated with accurate knowledge of factors such as elevation above the ground, the filter settings and amplifier characteristics and the form of the transmitted wave.
The second aspect of AEM calibration is ground-truthing. This typically involves drilling a series of bores to produce a profile from surface to bedrock. Drilling also provides detailed information on the soil and regolith material, allowing analysis of its capacity to store or transmit water and salt.
Processing of AEM measurements
Processing and interpreting geophysical surveys is complex because the signal originates from a range of depths. Conversion of raw data into depth images involves a number of steps that have specific mathematical and physical assumptions. Inversion, or inverse modelling, of AEM data refers to a particular mathematical methodology for separating the earth’s geoelectric properties from observed electromagnetic interactions. Inverting essentially assigns values for apparent bulk conductivity that would produce the observed value in the AEM data. This procedure converts the corrected data into a cross-section of the earth, with the conductivity displayed vertically.
Interpretation
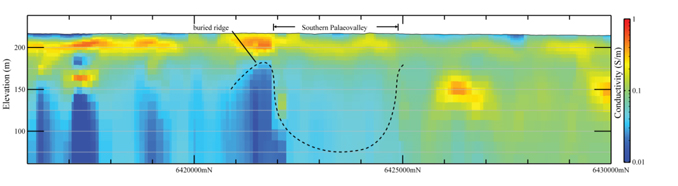
The results are presented either as vertical sections, showing how the apparent bulk conductivities change with depth along a section or line (figure 2), or in plan view, showing how the apparent bulk conductivity values of a particular depth range (for example, from 5 to 10 metres) change laterally (figure 3). These changes are usually represented by colours, typically a rainbow stretch, where the highest values of apparent bulk conductivity are represented by the red end of the spectrum and grading to the lowest conductivities at the blue end of the spectrum. Interpretation of figure 2 has identified the presence of a buried ridge and a palaeovalley in the vertical section of a flightline.
Figure 2: Flight line (0.01 – 1.0 S/m log stretch) showing the presence of a palaeovalley
Once the AEM survey data has been calibrated against the drilling information, accurate 3-D maps showing salt stores and flow paths for groundwater movement can be produced (figure 4). Interpretation requires sound knowledge of the properties of the local geomorphology and landscape, informed by ground and borehole observations. Without due diligence the data can produce misleading or erroneous results.
Figure 3: AEM depth slices 0 – 5 m, 5 – 10 m, 10 – 15 m and 15 – 20 m (colour stretch 0 – 0.5 S/m)
Figure 4: Three-dimensional view of AEM survey data
Limitations
Skilled experts, guided by ground-truthed data, need to process AEM data. Derived mapping products should state the procedures used to produce the results, including a description of assumptions and confidence limits. A clear understanding of the survey objectives can overcome common problems with AEM methods, such as selection of the most appropriate survey system and measured parameters.
There are fundamental limitations to the resolution of inductive electromagnetic techniques. For example, although AEM time-domain systems can detect conductivity distribution in the top 10 metres of the soil profile, the results for this depth range are less reliable than for deeper areas of the soil profile.
While there are some limitations to the technology, airborne geophysics provides a suite of powerful tools that can give unparalleled insight into landscape form and function, a quasi-continuous image of ground conditions and unprecedented spatial analysis of fundamental environmental features. Skilled application and use of AEM data can provide a useful source of information to contribute to the wider suite of tools available for natural resource management.
Sources
Spies, B & Woodgate, P 2005, Salinity mapping methods in the Australian context, prepared for the Natural Resource Management Ministerial Council, Department of the Environment and Heritage and Department of Agriculture, Fisheries and Forestry, Canberra.