
Agricultural production, including livestock and crops, contributed 18.2% of Australia's total GHG emissions in 2022-23 in Australia’s National Greenhouse Accounts. This does not include emissions associated with electricity, energy and fuel use in agriculture.
Emissions and sequestration associated with land management are accounted for under a separate category called land use, land use change and forestry (LULUCF). This category includes forests, land clearing, savanna fires and changes in soil carbon levels. As shown below, in 2022-23 this category was a net sink, reducing Australia’s overall emissions by 16.3%.
The following figure shows the share of total emissions by sector for 2022-23.
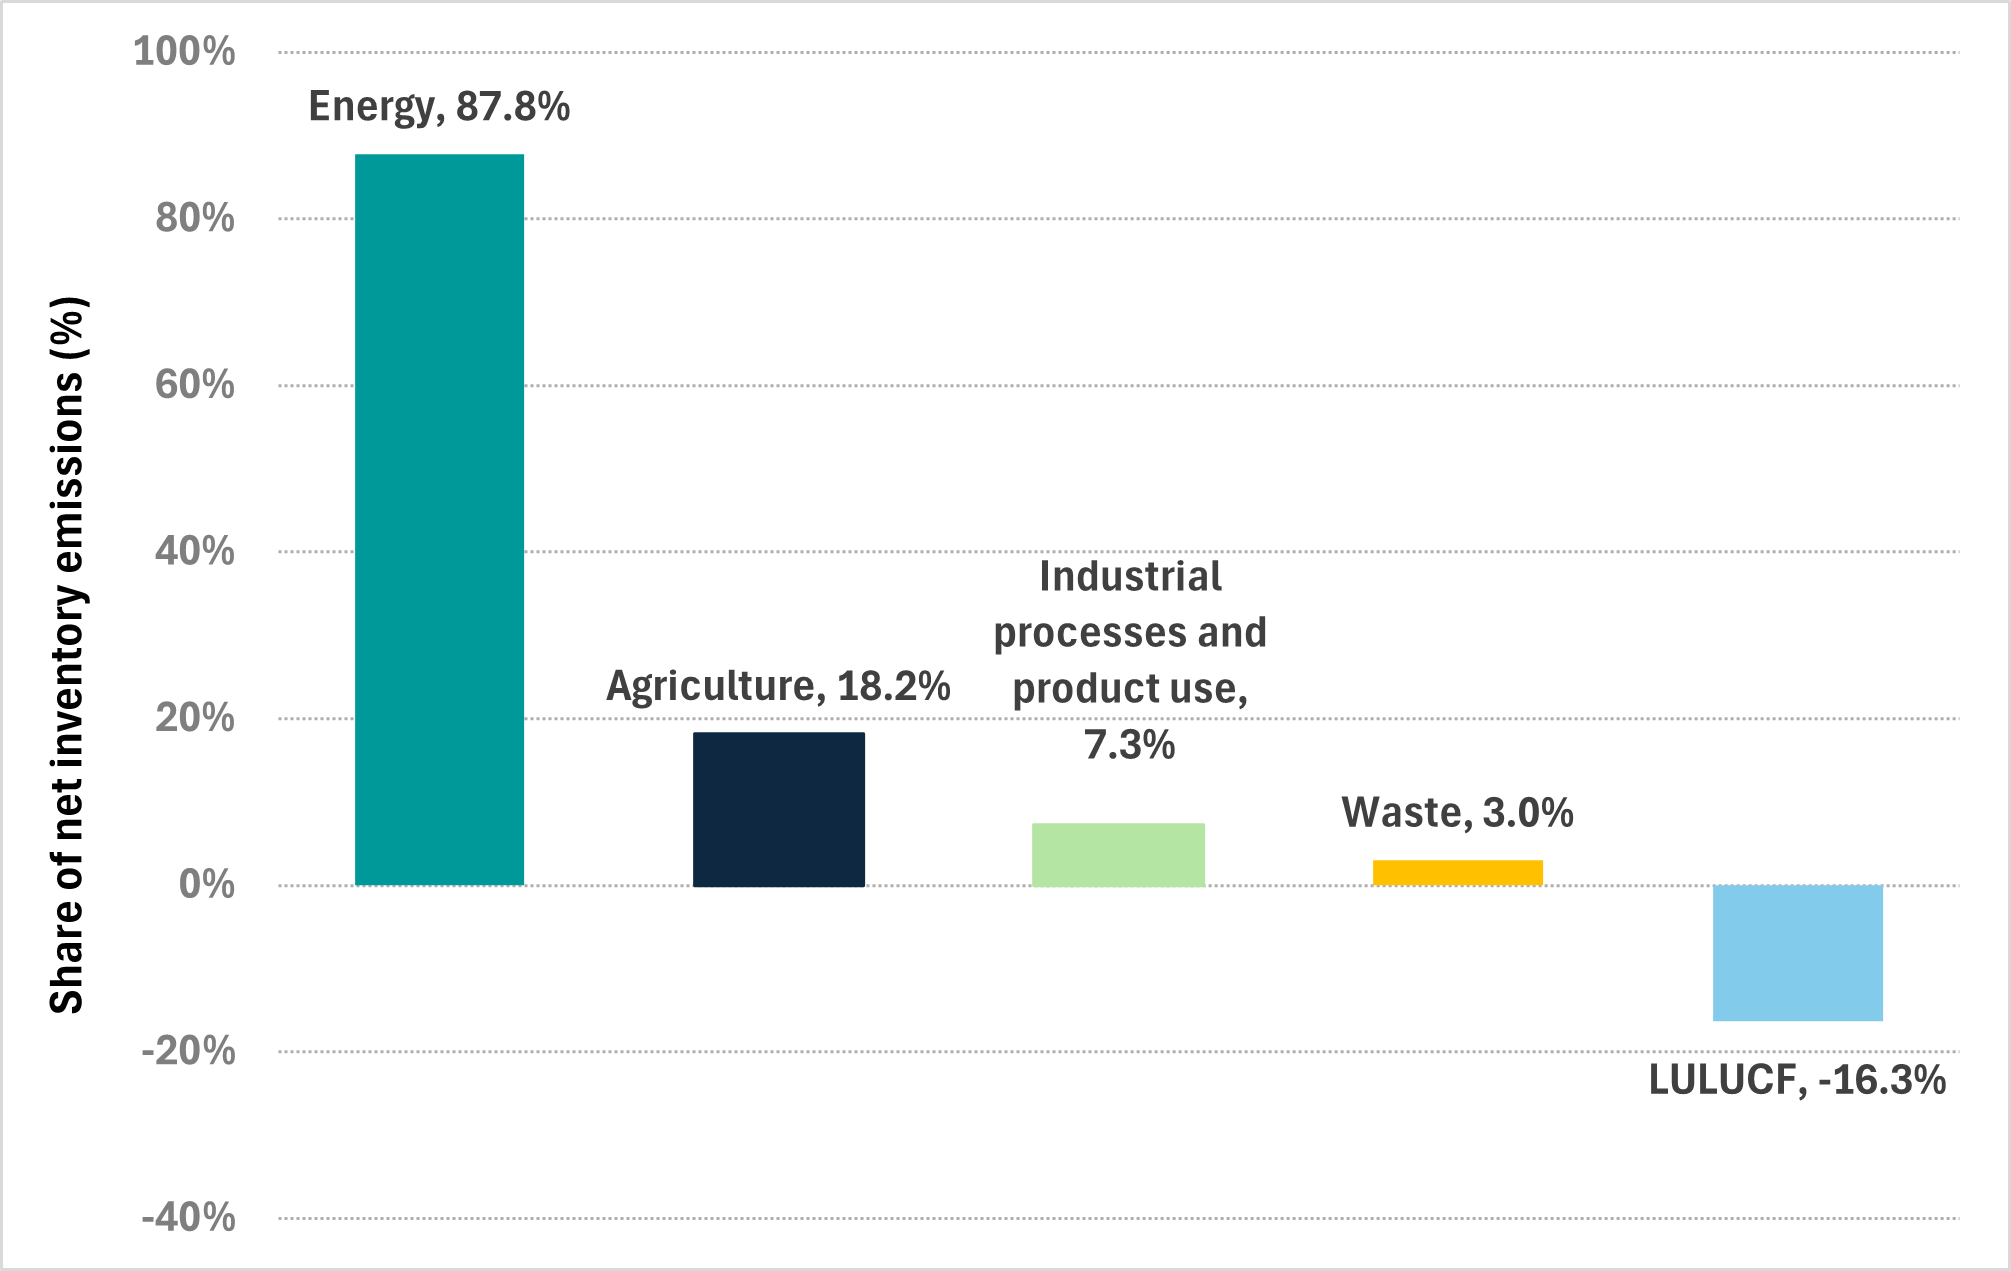
Chart created using source: National Inventory Report 2023 published May 2025.
The sectors and their shares of total emissions in 2022-23 were: energy (87.8%), agriculture (18.2%), industrial processes and product use (7.3%), waste (3.0%) and LULUCF (-16.3%).
Watch this video
In this video (9:19 minutes), Professor Richard Eckard of the University of Melbourne gives an overview of the GHGs emitted by the agriculture sector.
PROFESSOR RICHARD ECKARD: We introduce what are greenhouse gases.
Now what we know from two separate studies, and there's a number around the world you can find, they don't vary that much, that agriculture globally contributes somewhere between 13 and 14 per cent of greenhouse gas emissions. This is just the on farm emissions, not the supply chain emissions, which would include some, transport, some of the energy consumption.
So overall agriculture, food supply chain is responsible for about 22 to 25 per cent of greenhouse gas emissions globally.
Now, what makes a greenhouse gas?
A disclaimer on this slide first up is I used to run a course where a climate science expert would spend an entire day explaining what's on this slide, so forgive me when I try to do it in two minutes.
But essentially, if you think of the atmosphere, the air that you breathe, the majority of it is made up of oxygen, O2, so double bond, and nitrogen, 78 per cent of the atmosphere is nitrogen, dinitrogen, two nitrogen bonds.
That effectively makes the baseline of the vibrational frequency of the atmosphere, because those bonds are vibrating at a certain frequency.
So they would absorb a certain amount of heat and re-radiate it. Because that's the majority of the atmosphere, then that forms the baseline of the atmosphere, as I said.
Greenhouse gas emissions tend to be any molecule, any gas that has more than the baseline number of bonds. In other words, CO2’s got an oxygen, carbon and two oxygens. Methane's got a carbon and four hydrogens.
So there's four bonds involved there. So the moment you go from the baseline and you start adding more of these other gases into the atmosphere, you've got molecules that can hold more temperature, more radiation, that can absorb more wavelength radiated from the sun, and therefore re-radiate it back to the Earth. So hopefully that explains why water vapour, carbon dioxide, methane, and nitrous oxide can hold, absorb, and re-radiate more than the baseline of the atmosphere. So even though their concentration is right quite small in the atmosphere, that's where the change from the baseline is occurring.
Now, what is the effect of these major greenhouse gases? On the left, you've got the radiative forcing, and on the right, you've got the concentration in carbon dioxide equivalents.
And so you can see that the majority of the problem in the climate system is carbon dioxide from industrial fossil fuel emissions, But methane makes a fair contribution to the radiative forcing in the atmosphere, so we can't ignore it. Nitrous oxide also makes its contribution, and synthetic gases will be like sulphur hexafluoride, completely synthetic gas, but has a global warming of well over a thousand that times of CO2.
So they all make a contribution, but if we had to really address the core problem, it is industrial emissions.
On the right, you've got the difference in the global mean CO2 concentration from just CO2. So that's the blue on the left, and on the right you've got the concentration, but what the equivalent CO2 emissions would be if we added all the gases together. So clearly the other agricultural gases make their contribution as well.
Now we know that methane continues to increase in the atmosphere. This is data from the Cape Grim Research Station, which is on the northwest point of Cape Grim in Tasmania.
If you look due west from that point, there's nothing but ocean until you get to the southern tip of South America.
So it's one of the stations in the world that would be completely fully mixed air, unaffected by local pollution, and so this is where we get these results from. You can download them yourself from the CSIRO website.
The fluctuations annually is because we've got a larger landmass in the northern hemisphere than the southern, and so during the northern summer, a lot of the Siberian ice fields would melt somewhat, and you would get more methane produced from peat bogs in those extensive lands in the north.
Because the Southern Ocean dominates the southern hemisphere, there's more ocean than land, then in the southern summer we don't get as much of a pulse of methane, so we get this oscillation, but the bottom line is it continues to increase in the atmosphere.
Now we know that methane has a shorter lifetime in the atmosphere, somewhere around a half life of 11.8 years of lifetime, and the concentrations continue to increase relative to pre-industrial. On the right hand side I have given you the IPCC assessment reports from the second assessment report through to the sixth assessment report and what they published as the global warming potential either of a 20 year period or a 100 year period. These are the global warming potentials for methane. So the latest methane multiplier is 27 times that of carbon dioxide on a 100 year timescale.
Now for those of you wondering whether there is a difference between biogenic and fossil methane, there is.
It is already accounted for in the IPCC guidelines, as I have in the table there. A lot of people make a lot of fuss about this, but it doesn't actually make a big difference. Just to explain, methane is methane while it is in the atmosphere for 12 years.
The atmosphere doesn't see a difference in the methane molecule depending on where it came from. So for the duration that it's in the atmosphere, its warming is identical.
It therefore only comes back to what the original carbon molecule was before it became methane and where that came from. Was that a recent molecule from photosynthesis in the case of biogenic?
It would be in photosynthesis that went into a plant in the last 12 months and then went through the animal, came out as methane for 12 years, and then went back to the atmosphere as the original CO2 that was there 12 years prior.
Whereas fossil methane would be ancient photosynthesis that went into an ancient forest that got buried deep under the earth for millions of years and therefore when that methane breaks down, it's technically releasing a CO2 molecule that is new to the atmosphere in millions of years timescale.
So it only matters the original breakdown products of CO2 and water vapour once methane breaks down, and that's what's accounted in the difference between 27 times methane or 29.8 times methane.
Hopefully, that makes sense.
So here is the trend in nitrous oxide emissions from the Cape Grim weather station as well. You can see it is a lot more consistent because we don’t have the northern southern hemisphere issue. It is mainly driven by the expansion of food production around the world and the use of fossil fuel fertilisers.
Some of that would be legumes and the increase in livestock, but majority by the Haber Bosch process, one would argue.
Now we know that nitrous oxide has a longer residence time in the atmosphere than other greenhouse gases, so well over 110 years, somewhere around there.
But it has two actions in the atmosphere. One, it is inert in the troposphere, but it absorbs infrared radiation.
But secondly, it also causes ozone depletion in the stratosphere. So, two points of action.
Concentrations are fairly modest in the atmosphere, but it’s a very powerful greenhouse gas. And you can see from the various assessment reports that because it's a long lived greenhouse gas, 20 years versus 100 years doesn't make much of a difference to its global warming, and the multiplier has been fairly consistent over time, so 273 times that of CO2.
The average emissions from a grain farm might only be 250 grams of nitrous oxide nitrogen per hectare per year, but you have to multiply that by 273 to get the actual warming effect.
Agricultural emissions
The main sources of emissions from agriculture are:
- methane emissions from livestock (enteric fermentation) — mainly beef and dairy cattle and sheep — which together accounted for 71.9% of the agriculture sector’s emissions in 2022-23
- nitrous oxide emissions from soils — including from applying fertilisers and incorporating crop residues in soil — which totalled 13.4% of sector emissions in 2022-23
- methane and nitrous oxide emissions from managing manure (primarily from cattle, sheep and pigs), which represented 9.7% of the sector’s emissions in 2022-23.
Sources of agricultural GHG emissions
The following figure shows the contribution of each emissions source to total agricultural production emissions.
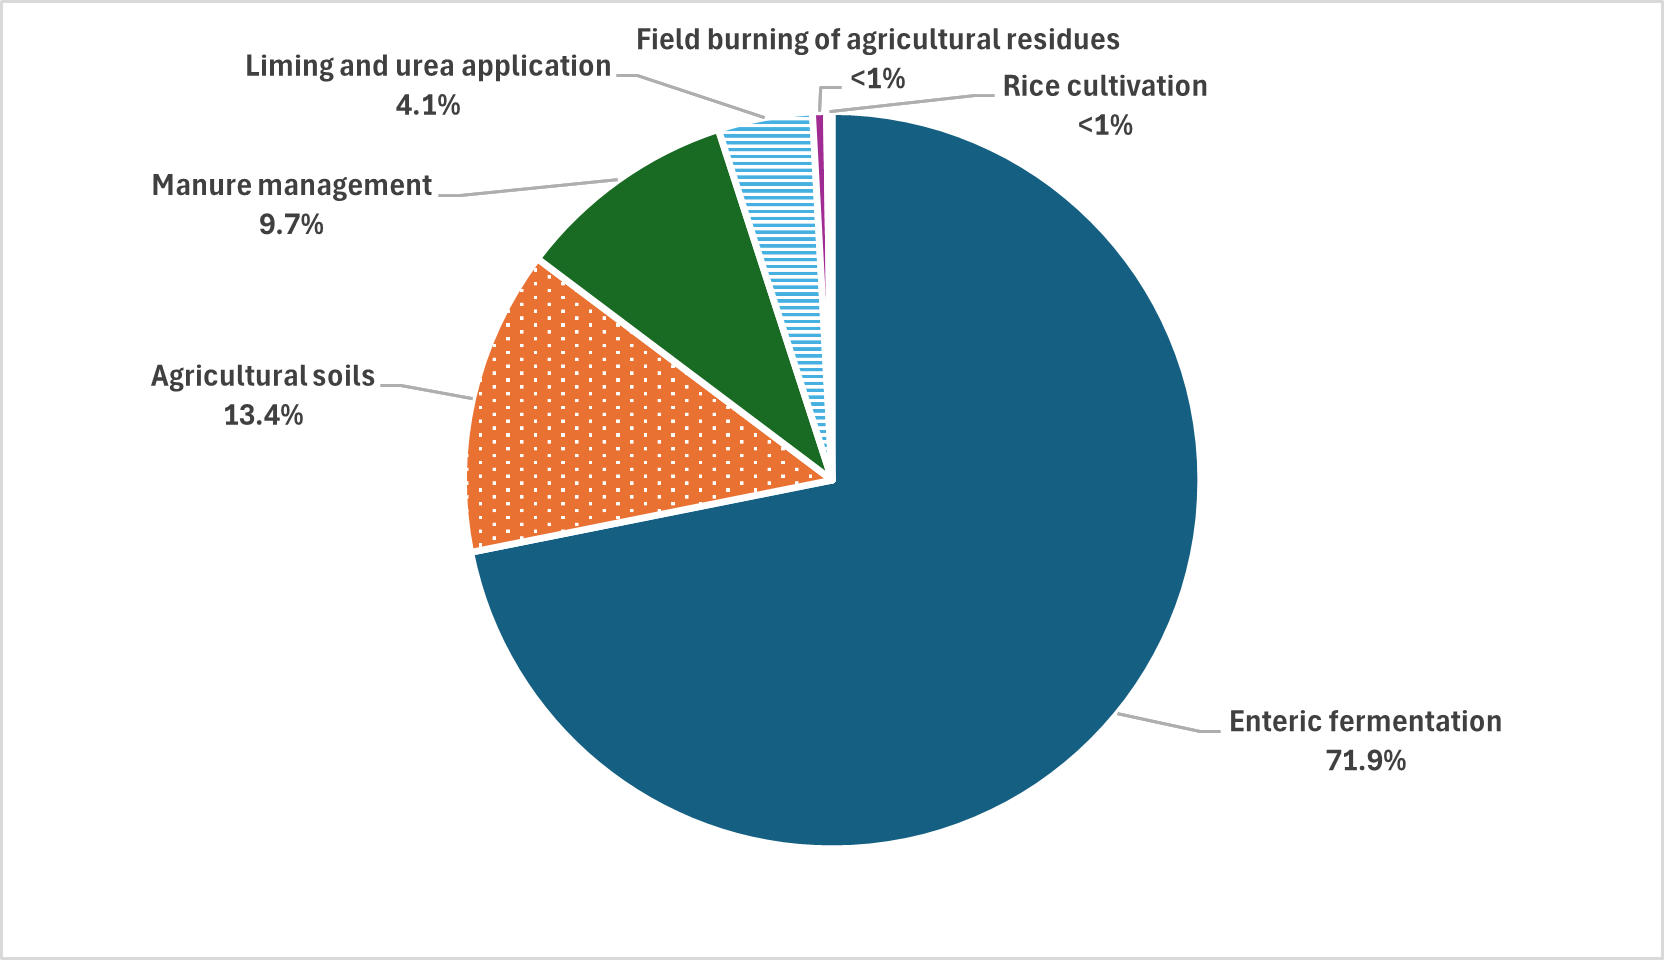
Chart created using source: National Inventory Report 2023 published May 2025.
Sources of emissions from agriculture in 2022-23 were enteric fermentation (71.9%), agricultural soils (13.4%), manure management (9.7%), liming and urea application (4.1%), field burning of agricultural residues (less than 1%) and rice cultivation (less than 1%).
For more information about methane emissions through enteric fermentation and nitrous oxide and how volumes of these emissions have changed over the last 3 decades, click a heading of interest below.
In 2022-23, methane emissions from livestock in Australia through enteric fermentation increased by 2.4%, from 55Mt of CO2-e in 2021-22 to 66.7 Mt of CO2-e. However, over the past 33 years there has been a gradual decline in methane emissions from livestock in Australia.
Enteric fermentation is the process by which microbes in the digestive system of ruminant livestock decompose and ferment food, producing methane which the animal then belches. About 6–10% of gross energy intake is lost as methane, which is energy lost from the production system that could be converted to income-generating milk or meat.
Almost all of these emissions are from cattle and sheep. The proportion of emissions coming from sheep has steadily declined since 1990, reflecting reductions in the number of sheep.
Over the 33 years to 2022–23, agriculture contributed most of Australia’s nitrous oxide emissions, which totalled 12.3 million tonnes CO2-e in 2022–23. Nitrous oxide has 265 times the global warming potential of carbon dioxide.
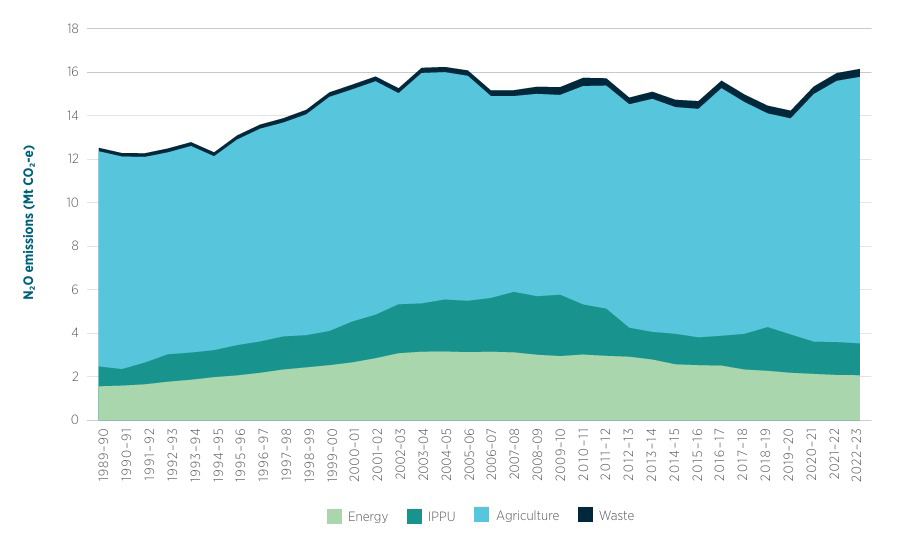
The following figure shows sources of nitrous oxide emissions from 1989-90 to 2022-23.
Source: National Inventory Report 2023.
In 2022-23, nitrous oxide emissions from each sector were (in millions of tonnes CO2-e): energy (2.3), industrial processes and product use (1.5), agriculture (12.3) and waste (0.3).
Certain bacteria produce nitrous oxide as part of the nitrogen cycle, the process by which nitrogen moves from the atmosphere into the soil, to plants and animals and back to the atmosphere. Nitrous oxide is produced:
- through the nitrification process; some soil bacteria convert ammonium to nitrate via nitrite, producing nitrous oxide as a by-product
- through the denitrification process; some soil bacteria convert nitrate and nitrite back into nitrogen gas and nitrous oxide.
The excess nitrogen from inefficient use of fertiliser can increase nitrous oxide emissions by enhancing nitrification and making more nitrate available for denitrification.
Watch this video
In this video (2:50 minutes), Professor Richard Eckard of the University of Melbourne explains the nitrogen cycle.
PROFESSOR RICHARD ECKARD: This is an animation of the nitrogen cycle in agriculture. Although this includes a grazing animal, the principles for cropping systems is much the same. While most of the nitrogen cycling in agriculture comes out of the microbial breakdown of a soil organic matter, the left-hand side of this diagram explains some of the primary input sources. Small amounts of nitrogen can come from rainfall and possibly volcanic events.
But the majority of nitrogen entering our agricultural systems comes from synthetic fertiliser, legumes fixing nitrogen from the atmosphere, or from animal dung and urine recycling nitrogen. Nitrogen can enter the soil in many forms, but would mainly be in either the ammonium form or the nitrate form. In most aerobic soils, the ammonium is then converted fairly quickly to nitrate. In cold, wet soils, common in Southern Australia, that conversion can be much slower and plants might preferentially take up ammonium.
Whereas in Northern Australia, in drier, hotter, warmer conditions, less anaerobic conditions, the conversion of ammonium to nitrate can complete in a few days. The other input of nitrogen into the soil is obviously from animal excreta in the form of dung or urine, which would largely be in the ammonium form. Plants then take up the nitrogen, either in the ammonium or nitrate form. In colder weather conditions, common in Southern Australia wet winters there could be preferential uptake of ammonia. In drier soils, there may be preferential uptake of nitrate. In the case of a livestock system, the animal then consumes the nitrogen in the plant and recycles some of this back to the soil through their excreta. Unfortunately, in most of our agricultural systems, the nitrogen is exported out of the system, down the supply chain, instead of being returned in more of a circular, closed loop nutrient cycle.
Nitrogen can be lost from the soil in three main processes. Nitrate in the soil moves readily with water. So if there's leaching of water beyond the root zone, this will carry nitrate with it into the groundwater. In waterlogged soils, nitrate can be denitrified and lost as a gas of either nitrous oxide or dinitrogen.
Nitrogen can be lost as ammonia gas, either directly from urea fertiliser being applied to soils, or livestock urine volatilising as ammonia gas.
Scope 1, 2 and 3 emissions
So far, this topic has looked at on-farm emissions, mainly methane and nitrous oxide. However, as we delve deeper into calculating emissions, we see that there are different types of emission sources of importance to farmers and land managers.
There are 3 types of emissions — called ‘scopes’ — that are part of a business’s total emissions but may not be evident at first sight. They are:
- scope 1 emissions: emissions from operations a business owns or controls; for a farm, this could include methane from livestock digestion and manure management and nitrous oxide from fertiliser use
- scope 2 emissions: indirect (off-farm) emissions from generating electricity, steam, heat or cooling the business buys
- scope 3 emissions: all indirect (off-farm) emissions (other than scope 2 emissions) that occur in the business’ value chain for a farm. This could include upstream emissions from producing and transporting fertilisers and pesticides, and downstream emissions from transporting, processing and consumption of the farming business’ products, including waste disposal.
These are important distinctions. Farmers and land managers serious about calculating their carbon footprint must follow the conventions of carbon accounting — the quantification of emissions and storage — which Topic 3 examines.