
Compiled and Published By
United States Department of Agriculture,
National Agricultural Statistics Service,
Oregon Field Office
Christopher A. Mertz, Director
Bruce A. Eklund, Deputy Director
Laura Burgess, Survey Statistician
Eric Stebbins, Data Processing
Bonnie Miller, Data Processing
Ann Clemon, Publications Assistant
Copies of this publication are available at no charge by contacting the Oregon Field
Office of USDA, NASS located at 1220 SW 3rd Ave., Room 1735, Portland, OR 97204,
1-800-338-2157, or (503) 326-2131 in the Portland area.
This report is also available on the web at http://www.nass.usda.gov/or.
Oregon Fruit Tree Inventory, 2006
Summary
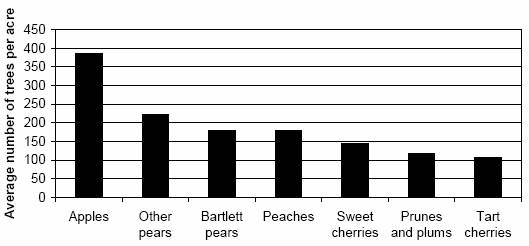
For the first time since 1993, the Oregon Field Office of USDA’s National Agricultural Statistics Service conducted a comprehensive fruit tree inventory survey. Results of the survey showed just over 7.99 million commercially grown fruit trees on 39,260 acres. The total number of Oregon fruit trees increased nearly six percent since 1993, but total fruit tree acreage was down 17 percent. Fruit tree density in Oregon has increased throughout time. The 1986 survey showed an average of 118 trees per acre; the 1993 survey showed 159 trees per acre; and the 2006 survey showed 204 trees per acre. The results of the three fruit tree inventory surveys have shown more commercial trees grown on less acreage.
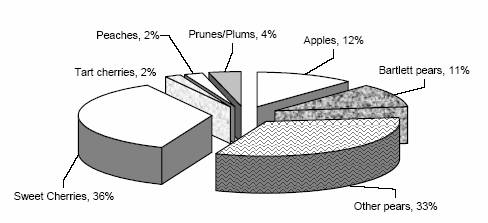
As of January 1, 2006, pears other than Bartletts accounted for the most fruit trees in Oregon with 2.87 million trees. Sweet cherries were second with 2.04 million trees, and apples were third with 1.92 million trees. Bartlett pears ranked fourth Statewide, prunes and plums ranked fifth, peaches ranked sixth, and tart cherries ranked seventh. In 1993, pears other than Bartletts were also the number one commercial fruit tree crop, apples were second, Bartlett pears were third, and sweet cherries were fourth. Apricots and nectarines were tabulated on a Statewide basis with no breakdown by age or variety. There were 8,400 apricot trees grown on 67 acres; and 10,600 nectarine trees grown on 60 acres. In 1993, there were 12,600 apricot trees grown on 120 acres; and 9,000 nectarine trees grown on 70 acres.
The total number of Oregon trees has decreased for all fruits since 1993, except sweet cherries, which have more than doubled in the past 13 years. The smallest percentage decrease was in pears other than Bartletts, which showed a one percent decrease. The largest percentage decrease was in tart cherries, which decreased 62 percent since 1993. The total number of fruit trees has increased in Hood River County, Wasco County, Umatilla County, and Union County. The total number of fruit trees has decreased in the Willamette Valley, Douglas County, Jackson and Josephine counties, and the aggregate of all other areas.
Survey Design and Data Collection
The 2006 fruit tree inventory survey was designed to collect data from all commercial orchards in Oregon. The primary data collection method was via mail with telephone follow-up of operators not responding by mail. Personal interviews were conducted with some larger growers and those inaccessible by telephone. Growers in Hood River and Wasco counties were able to report their data through maps provided by Jim Bishop at The Dalles Farm Service Agency, USDA office.
Data Tabulation
The data requested for each orchard was: (1) acreage and total tree numbers for each tree fruit; (2) acreage and tree numbers by variety and age of trees for each tree fruit. Orchards that were interplanted were proportionally allocated acreage for each type, variety, and year planted. Top-worked trees were considered planted in the year they were top-worked.
| Area | Apples | Bartlett pears | Other Pears1 | Sweet cherries | Tart cherries | Peaches | Prunes and plums | Total |
|---|---|---|---|---|---|---|---|---|
| Acres | Acres | Acres | Acres | Acres | Acres | Acres | Acres | |
| Willamette Valley 2 | ||||||||
| 1986 | 975 | 280 | 70 | 4,545 | 2,225 | 950 | 2,800 | 11,845 |
| 1993 | 800 | 200 | (3) | 4,150 | 1,850 | 750 | 2,050 | 9,800 |
| 2006 | 970 | 220 | 170 | 2,800 | 725 | 400 | 1,100 | 6,385 |
| Douglas | ||||||||
| 1986 | 115 | 105 | 15 | 190 | (3) | 90 | 525 | 1,040 |
| 1993 | (3) | (3) | (3) | (3) | - | (3) | 300 | 300 |
| 2006 | (3) | (3) | (3) | (3) | (3) | (3) | 140 | 140 |
| Hood River | ||||||||
| 1986 | 3,990 | 3,550 | 6,000 | 685 | - | 50 | - | 14,275 |
| 1993 | 2,750 | 3,400 | 7,050 | 750 | - | (3) | - | 13,950 |
| 2006 | 1,200 | 3,200 | 7,500 | 1,900 | - | (3) | - | 13,800 |
| Wasco | ||||||||
| 1986 | 545 | 15 | 40 | 6,025 | - | 60 | 5 | 6,690 |
| 1993 | 600 | (3) | (3) | 5,700 | - | (3) | (3) | 6,300 |
| 2006 | 90 | 90 | 180 | 8,400 | - | (3) | (3) | 8,760 |
| Umatilla | ||||||||
| 1986 | 2,950 | 10 | - | 450 | - | 60 | 805 | 4,275 |
| 1993 | 3,400 | (3) | - | 350 | - | (3) | 550 | 4,300 |
| 2006 | 2,420 | (3) | - | 330 | - | (3) | 195 | 2,945 |
| Union | ||||||||
| 1986 | 10 | 5 | - | 820 | - | 10 | 5 | 850 |
| 1993 | (3) | (3) | - | 750 | - | (3) | (3) | 750 |
| 2006 | (3) | (3) | - | 400 | - | (3) | (3) | 400 |
| Jackson and Josephine | ||||||||
| 1986 | 300 | 2,360 | 6,140 | 35 | - | 280 | 30 | 9,145 |
| 1993 | 400 | 2,000 | 7,100 | (3) | - | 250 | (3) | 9,750 |
| 2006 | 50 | 800 | 4,960 | (3) | - | 170 | (3) | 5,980 |
| Other areas | ||||||||
| 1986 | 1,160 | 10 | 5 | 40 | 5 | 90 | 35 | 1,345 |
| 1993 | 1,550 | 100 | 250 | 150 | - | 200 | 100 | 2,350 |
| 2006 | 260 | 40 | 70 | 270 | 5 | 140 | 65 | 850 |
| Oregon | ||||||||
| 1986 | 10,045 | 6,335 | 12,270 | 12,790 | 2,230 | 1,590 | 4,205 | 49,465 |
| 1993 | 9,500 | 5,700 | 14,400 | 11,850 | 1,850 | 1,200 | 3,000 | 47,500 |
| 2006 | 4,990 | 4,350 | 12,880 | 14,100 | 730 | 710 | 1,500 | 39,260 |
1 Other pears also includes Asian pears.
2 Includes Benton, Clackamas, Columbia, Lane, Linn, Marion, Multnomah, Polk, Washington, and Yamhill counties.
3 Included in other areas.
Oregon fruit tree acres, January 1, 2006
| Area | Apples | Bartlett pears | Other Pears1 | Sweet cherries | Tart cherries | Peaches | Prunes and plums | Total |
|---|---|---|---|---|---|---|---|---|
| Trees | Trees | Trees | Trees | Trees | Trees | Trees | Trees | |
| Willamette Valley2 | ||||||||
| 1986 | 161,570 | 29,880 | 10,220 | 292,830 | 229,260 | 122,320 | 275,390 | 1,121,470 |
| 1993 | 182,100 | 26,400 | (3) | 289,300 | 194,300 | 103,500 | 208,700 | 1,004,300 |
| 2006 | 326,100 | 37,500 | 40,600 | 257,500 | 72,900 | 57,500 | 117,000 | 909,100 |
| Douglas | ||||||||
| 1986 | 13,160 | 10,070 | 4,500 | 14,460 | (3) | 12,980 | 40,750 | 95,920 |
| 1993 | (3) | (3) | (3) | (3) | - | (3) | 25,500 | 25,500 |
| 2006 | (3) | (3) | (3) | (3) | (3) | (3) | 12,100 | 12,100 |
| Hood River | ||||||||
| 1986 | 585,900 | 456,230 | 735,630 | 63,860 | - | 6,450 | - | 1,848,070 |
| 1993 | 462,700 | 455,700 | 1,021,100 | 77,000 | - | (3) | - | 2,016,500 |
| 2006 | 304,200 | 510,900 | 1,315,600 | 345,100 | - | (3) | - | 2,475,800 |
| Wasco | ||||||||
| 1986 | 79,650 | 3,140 | 5,470 | 358,800 | - | 8,100 | 710 | 455,870 |
| 1993 | 111,000 | (3) | (3) | 413,000 | - | (3) | (3) | 524,000 |
| 2006 | 49,000 | 17,900 | 34,000 | 1,288,600 | - | (3) | (3) | 1,389,500 |
| Umatilla | ||||||||
| 1986 | 441,030 | 840 | - | 45,140 | - | 6,470 | 96,390 | 589,870 |
| 1993 | 967,100 | (3) | - | 36,400 | - | (3) | 71,200 | 1,074,700 |
| 2006 | 1,134,600 | (3) | - | 70,400 | - | (3) | 34,800 | 1,239,800 |
| Union | ||||||||
| 1986 | 1,500 | 400 | - | 49,300 | - | 790 | 600 | 52,590 |
| 1993 | (3) | (3) | - | 43,900 | - | (3) | (3) | 43,900 |
| 2006 | (3) | (3) | - | 51,500 | - | (3) | (3) | 51,500 |
| Jackson and Josephine | ||||||||
| 1986 | 80,010 | 306,650 | 944,000 | 2,540 | - | 31,900 | 4,690 | 1,369,790 |
| 1993 | 115,100 | 448,000 | 1,830,000 | (3) | - | 37,000 | (3) | 2,430,100 |
| 2006 | 10,000 | 206,400 | 1,463,400 | (3) | - | 43,500 | (3) | 1,723,300 |
| Other areas | ||||||||
| 1986 | 288,600 | 1,220 | 1,080 | 3,600 | 70 | 11,900 | 9,100 | 315,570 |
| 1993 | 319,000 | 19,100 | 47,800 | 11,900 | - | 27,200 | 18,600 | 443,600 |
| 2006 | 98,100 | 7,500 | 14,600 | 30,900 | 900 | 26,300 | 11,900 | 190,200 |
| Oregon | ||||||||
| 1986 | 1,651,420 | 808,430 | 1,700,900 | 830,530 | 229,330 | 200,910 | 427,630 | 5,849,150 |
| 1993 | 2,157,000 | 949,200 | 2,898,900 | 871,500 | 194,300 | 167,700 | 324,000 | 7,562,600 |
| 200 | 1,922,000 | 780,200 | 2,868,200 | 2,044,000 | 73,800 | 127,300 | 175,800 | 7,991,300 |
1 Other pears also includes Asian pears.
2 Includes Benton, Clackamas, Columbia, Lane, Linn, Marion, Multnomah, Polk, Washington, and Yamhill counties.
3 Included in other areas.
Oregon fruit trees, January 1, 2006
| Fruit | Year planted | All years | ||||||
|---|---|---|---|---|---|---|---|---|
| Before 1984 | 1984-1993 | 1994-1998 | 1999-2001 | 2002-2003 | 2004-2005 | Unknown ages | ||
| Average trees per acre |
Average trees per acre |
Average trees per acre |
Average trees per acre |
Average trees per acre |
Average trees per acre |
Average trees per acre |
Average trees per acre |
|
| Apples | 189 | 417 | 430 | 566 | 493 | 484 | 116 | 385 |
| Bartlett pears | 153 | 212 | 287 | 250 | 214 | 229 | 122 | 180 |
| Other pears | 163 | 248 | 306 | 307 | 324 | 303 | 139 | 223 |
| Sweet cherries | 96 | 143 | 148 | 184 | 182 | 230 | 119 | 145 |
| Tart cherries | 104 | 109 | 95 | 94 | 130 | 106 | 74 | 101 |
| Peaches | 144 | 168 | 185 | 203 | 169 | 180 | 123 | 179 |
| Prunes and plums | 100 | 154 | 118 | 145 | 162 | 233 | 79 | 117 |
1 Trees per acre average is weighted by reported acres.
Average number of Oregon fruit trees per acre, by type
| Growing area | Year planted | Total trees of all ages | ||||||
|---|---|---|---|---|---|---|---|---|
| Before 1984 | 1984-1993 | 1994-1998 | 1999-2001 | 2002-2003 | 2004-2005 | Unknown ages | ||
|
Trees |
Trees |
Trees |
Trees |
Trees |
Trees |
Trees |
Trees |
|
|
Willamette Valley1 |
36,200 |
142,400 |
52,000 |
20,400 |
35,100 |
36,800 |
3,200 |
326,100 |
|
Hood River |
93,300 |
58,000 |
85,200 |
25,800 |
13,100 |
28,600 |
200 |
304,200 |
|
Wasco |
2,300 |
4,500 |
32,900 |
9,300 |
- |
- |
- |
49,000 |
|
Umatilla |
78,300 |
419,500 |
272,300 |
199,900 |
102,300 |
62,300 |
- |
1,134,600 |
|
Jackson/Josephine |
4,300 |
500 |
700 |
1,000 |
2,700 |
- |
800 |
10,000 |
|
Other areas |
19,800 |
11,300 |
21,200 |
11,600 |
29,900 |
3,800 |
500 |
98,100 |
|
Oregon |
234,200 |
636,200 |
464,300 |
268,000 |
183,100 |
131,500 |
4,700 |
1,922,000 |
1 Includes Benton, Clackamas, Columbia, Lane, Linn, Marion, Multnomah, Polk, Washington, and Yamhill counties.
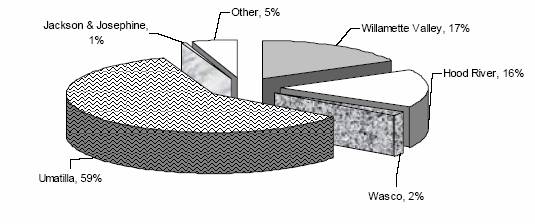
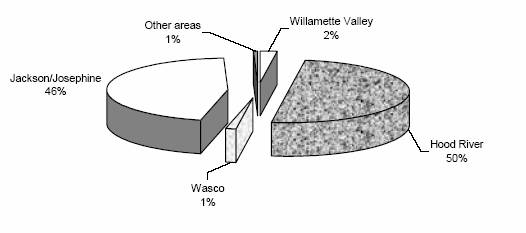
Oregon apple trees percent of total, by growing area
Top Oregon apple varieties total trees of all ages
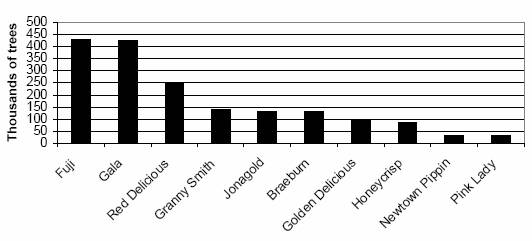
| Variet | Year planted | Unknown ages | Total trees of all ages | |||||
|---|---|---|---|---|---|---|---|---|
| Before 1984 | 1984-1993 | 1994-1998 | 1999-2001 | 2002-2003 | 2004-2005 | |||
| Trees | Trees | Trees | Trees | Trees | Trees | Trees | Trees | |
| Akane | 800 | 500 | - | 100 | - | 100 | - | 1,500 |
| Braeburn | 1,800 | 46,000 | 43,500 | 20,100 | 9,000 | 6,300 | - | 126,700 |
| Criterion | 2,800 | 1,000 | 400 | - | 1,400 | - | - | 5,600 |
| Empire | 100 | 1,300 | 900 | - | - | - | - | 2,300 |
| Fuji | 7,200 | 124,200 | 128,500 | 111,800 | 34,600 | 23,700 | 100 | 430,100 |
| Gala | 21,300 | 181,000 | 125,000 | 28,200 | 48,400 | 22,500 | 100 | 426,500 |
| Golden Delicious | 24,800 | 29,500 | 11,200 | 15,900 | 9,400 | - | - | 90,800 |
| Granny Smith | 17,700 | 43,600 | 34,900 | 21,000 | 13,600 | 9,000 | 100 | 139,900 |
| Gravenstein | 7,000 | 2,900 | 8,900 | 1,000 | 400 | 400 | - | 20,600 |
| Honeycrisp | 13,600 | - | 6,300 | 13,400 | 25,100 | 30,200 | - | 88,600 |
| Idared | 200 | 200 | 200 | 300 | - | - | - | 900 |
| Jonagold | 5,800 | 69,500 | 31,200 | 900 | 1,400 | 24,300 | 100 | 133,200 |
| Jonathan | 900 | 2,300 | 500 | - | - | - | - | 3,700 |
| Liberty | 300 | 1,700 | 200 | 150 | - | 150 | - | 2,500 |
| McIntosh | 300 | 1,000 | - | - | - | - | - | 1,300 |
| Melrose | 800 | 900 | 650 | 150 | - | - | 100 | 2,600 |
| Mutsu | 100 | 250 | 150 | 100 | - | - | 100 | 700 |
| Newtown Pippin | 24,000 | 7,300 | 400 | 200 | - | 1,000 | - | 32,900 |
| Pink Lady | - | 7,350 | - | 18,600 | - | 4,250 | - | 30,200 |
| Red Delicious | 76,000 | 80,500 | 42,400 | 26,800 | 20,000 | 4,400 | 100 | 250,200 |
| Rome Beauty | 4,200 | 200 | 100 | - | 1,400 | - | - | 5,900 |
| Other varieties1 | 24,500 | 35,000 | 28,900 | 9,300 | 18,400 | 5,200 | 4,000 | 125,300 |
| All varieties | 234,200 | 636,200 | 464,300 | 268,000 | 183,100 | 131,500 | 4,700 | 1,922,000 |
1 Other varieties include varieties with minimal acreage, unknown varieties, or varieties not published to avoid disclosure of individual operations.
| Variety | Willamette Valley 1 |
Hood River | Wasco | Umatilla | Jackson and Josephine |
Other areas | Oregon |
|---|---|---|---|---|---|---|---|
| Trees | Trees | Trees | Trees | Trees | Trees | Trees | |
| Akane | 800 | 600 | - | - | - | 100 | 1,500 |
| Braebum | 19,000 | 15,900 | 100 | 89,900 | 200 | 1,600 | 126,700 |
| Criterion | 2,800 | 2,100 | - | 400 | - | 300 | 5,600 |
| Empire | 1,300 | 200 | 300 | - | 100 | 400 | 2,300 |
| Fuji | 4,100 | 13,200 | 4,500 | 376,700 | 1,500 | 30,100 | 430,100 |
| Gala | 44,400 | 56,300 | 23,000 | 285,000 | 1,000 | 16,800 | 426,500 |
| Golden Delicious | 2,700 | 31,000 | 400 | 53,500 | 700 | 2,500 | 90,800 |
| Granny Smith | 17,900 | 25,600 | 19,700 | 70,900 | 300 | 5,500 | 139,900 |
| Gravenstein | 16,500 | 3,400 | 400 | - | 300 | - | 20,600 |
| Honeycrisp | 51,600 | 36,700 | - | - | - | 300 | 88,600 |
| Idared | 900 | - | - | - | - | - | 900 |
| Jonagold | 92,000 | 32,700 | 100 | 7,500 | 100 | 800 | 133,200 |
| Jonathan | 1,100 | 2,400 | 100 | - | - | 100 | 3,700 |
| Liberty | 2,100 | - | - | - | - | 400 | 2,500 |
| McIntosh | 600 | 400 | - | - | 200 | 100 | 1,300 |
| Melrose | 2,500 | 100 | - | - | - | - | 2,600 |
| Mutsu | 600 | - | - | - | - | 100 | 700 |
| Newtown Pippin | 800 | 31,400 | - | - | 300 | 400 | 32,900 |
| Pink Lady | 2,500 | 7,800 | - | 19,700 | - | 200 | 30,200 |
| Red Delicious | 5,900 | 16,900 | 100 | 223,800 | 700 | 2,800 | 250,200 |
| Rome Beauty | 1,500 | 1,500 | 100 | 100 | 200 | 2,500 | 5,900 |
| Other varieties 2 | 54,500 | 26,000 | 200 | 7,100 | 4,400 | 33,100 | 125,300 |
| All varieties | 326,100 | 304,200 | 49,000 | 1,134,600 | 10,000 | 98,100 | 1,922,000 |
1 Includes Benton, Clackamas, Columbia, Lane, Linn, Marion, Multnomah, Polk, Washington, and Yamhill counties.
2 Other varieties include varieties with minimal acreage, unknown varieties, or varieties not published to avoid disclosure of individual operations.
| Growing area | Year planted | Unknown ages | Total trees of all ages | |||||
|---|---|---|---|---|---|---|---|---|
| Before 1984 | 1984-1993 | 1994-1998 | 1999-2001 | 2002-2003 | 2004-2005 | |||
| Trees | Trees | Trees | Trees | Trees | Trees | Trees | Trees | |
| Bartlett pears | ||||||||
| Willamette Valley1 | 14,400 | 1,700 | 3,850 | 7,800 | 4,500 | 5,100 | 150 | 37,500 |
| Hood River | 378,000 | 59,500 | 37,750 | 17,100 | 8,400 | 9,200 | 950 | 510,900 |
| Wasco | 400 | 9,300 | 6,800 | 1,300 | 100 | - | - | 17,900 |
| Jackson/Josephine | 66,800 | 32,700 | 80,100 | 19,500 | 4,200 | 3,100 | - | 206,400 |
| Other areas | 3,000 | 200 | 3,000 | 1,000 | - | - | 300 | 7,500 |
| Oregon | 462,600 | 103,400 | 131,500 | 46,700 | 17,200 | 17,400 | 1,400 | 780,200 |
| Asian pears | ||||||||
| Willamette Valley1 | 200 | 7,400 | 2,200 | 7,400 | 100 | 100 | 1,100 | 18,500 |
| Hood River | 1,200 | 3,800 | 9,300 | 8,800 | 1,200 | 400 | - | 24,700 |
| Jackson/Josephine | - | 5,900 | 5,700 | - | - | - | - | 11,600 |
| Other areas | - | 6,200 | 1,600 | - | - | - | - | 7,800 |
| Oregon | 1,400 | 23,300 | 18,800 | 16,200 | 1,300 | 500 | 1,100 | 62,600 |
| Other pears | ||||||||
| Willamette Valley1 | 2,900 | 4,400 | 5,300 | 2,300 | 6,600 | - | 600 | 22,100 |
| Hood River | 688,300 | 240,400 | 132,200 | 78,800 | 64,800 | 86,400 | - | 1,290,900 |
| Wasco | 5,600 | 12,200 | 13,400 | 2,300 | 400 | 100 | - | 34,000 |
| Jackson/Josephine | 321,500 | 576,600 | 246,400 | 161,700 | 115,900 | 29,700 | - | 1,451,800 |
| Other areas | 4,100 | 1,100 | - | 1,600 | - | - | - | 6,800 |
| Oregon | 1,022,400 | 834,700 | 397,300 | 246,700 | 187,700 | 116,200 | 600 | 2,805,600 |
| All pears | ||||||||
| Willamette Valley1 | 17,500 | 13,500 | 11,350 | 17,500 | 11,200 | 5,200 | 1,850 | 78,100 |
| Hood River | 1,067,500 | 303,700 | 179,250 | 104,700 | 74,400 | 96,000 | 950 | 1,826,500 |
| Wasco | 6,000 | 21,500 | 20,200 | 3,600 | 500 | 100 | - | 51,900 |
| Jackson/Josephine | 368,300 | 575,200 | 276,600 | 141,200 | 100,100 | 32,800 | - | 1,669,800 |
| Other areas | 7,100 | 7,500 | 4,600 | 2,600 | - | - | 300 | 22,100 |
| Oregon | 1,486,400 | 961,400 | 547,600 | 309,600 | 206,200 | 134,100 | 3,100 | 3,648,400 |
1 Includes Benton, Clackamas, Columbia, Lane, Linn, Marion, Multnomah, Polk, Washington, and Yamhill counties.
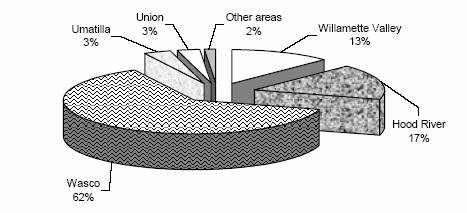
Oregon pear trees percent of total, by growing area
| Variety | Year planted | Unknown ages | Total trees of all ages | |||||
|---|---|---|---|---|---|---|---|---|
| Before 1984 | 1984-1993 | 1994-1998 | 1999-2001 | 2002-2003 | 2004-2005 | |||
| Trees | Trees | Trees | Trees | Trees | Trees | Trees | Trees | |
| Bartlett pears | ||||||||
| Bartlett | 427,800 | 86,500 | 128,900 | 43,100 | 16,500 | 12,300 | 1,400 | 716,500 |
| Red Bartlett | 34,800 | 16,900 | 2,600 | 3,600 | 700 | 5,100 | - | 63,700 |
| All Bartlett pears | 462,600 | 103,400 | 131,500 | 46,700 | 17,200 | 17,400 | 1,400 | 780,200 |
| Asian pears | 1,400 | 23,300 | 18,800 | 16,200 | 1,300 | 500 | 1,100 | 62,600 |
| Other pears | ||||||||
| Bose | 233,800 | 205,800 | 77,000 | 36,500 | 56,400 | 46,500 | - | 656,000 |
| Cascade | 4,700 | 4,000 | 500 | - | - | - | - | 9,200 |
| Cornice | 175,000 | 328,600 | 186,400 | 134,600 | 69,700 | 26,900 | - | 921,200 |
| Concorde | 900 | 1,700 | 4,200 | 3,300 | 4,200 | 1,400 | - | 15,700 |
| Forelle | 8,900 | 32,200 | 11,000 | 5,000 | 6,600 | 3,600 | - | 67,300 |
| Green Anjou | 514,300 | 59,700 | 44,500 | 32,200 | 22,700 | 31,800 | - | 705,200 |
| Packharn | 200 | 1,900 | 900 | 200 | - | 800 | - | 4,000 |
| Red Anjou | 40,300 | 68,400 | 38,000 | 7,300 | 3,500 | 1,200 | - | 158,700 |
| Seckel | 4,300 | 12,800 | 1,200 | 6,000 | 3,600 | 700 | - | 28,600 |
| Starkrimson | 8,500 | 60,200 | 4,400 | 8,500 | 4,800 | 1,600 | - | 88,000 |
| Taylors Gold | - | - | 800 | 1,900 | 10,300 | 700 | - | 13,700 |
| Other varieties 1 |
31,500 | 59,400 | 28,400 | 11,200 | 5,900 | 1,000 | 600 | 138,000 |
| All other pears | 1,022,400 | 834,700 | 397,300 | 246,700 | 187,700 | 116,200 | 600 | 2,805,600 |
| All varieties | 1,486,400 | 961,400 | 547,600 | 309,600 | 206,200 | 134,100 | 3,100 | 3,648,400 |
1 Other varieties include varieties with minimal acreage, unknown varieties, or varieties not published to avoid disclosure of individual operations.
| Variety | Willamette Valley 1 |
Hood River | Wasco | Jackson and Josephine |
Other areas | Oregon |
|---|---|---|---|---|---|---|
| Trees | Trees | Trees | Trees | Trees | Trees | |
| Bartlett pears | ||||||
| Bartlett | 32,400 | 460,600 | 14,100 | 203,000 | 6,400 | 716,500 |
| Red Bartlett | 5,100 | 50,300 | 3,800 | 3,400 | 1,100 | 63,700 |
| All Bartlett pears | 37,500 | 510,900 | 17,900 | 206,400 | 7,500 | 780,200 |
| Asian pears | 18,500 | 24,700 | - | 11,600 | 7,800 | 62,600 |
| Other pears | ||||||
| Bose | 8,600 | 256,400 | 25,100 | 361°,600 | 4,300 | 656,000 |
| Cascade | - | 4,400 | - | 4,800 | - | 9,200 |
| Cornice | 2,300 | 112,400 | 300 | 806,000 | 200 | 921,200 |
| Concorde | 800 | 14,800 | 100 | - | - | 15,700 |
| Forelle | 2,500 | 52,400 | - | 12,400 | - | 67,300 |
| Green Anjou | 800 | 640,900 | 5,700 | 55,600 | 2,200 | 705,200 |
| Packham | - | 2,800 | - | 1,200 | - | 4,000 |
| Red Anjou | 100 | 124,200 | 2,700 | 31,700 | - | 158,700 |
| Seckel | - | 8,600 | - | 20,000 | - | 28,600 |
| Starkrimson | - | 41,400 | - | 46,600 | - | 88,000 |
| Taylors Gold | 3,700 | 5,000 | - | 5,000 | - | 13,700 |
| Other varieties 2 | 3,300 | 27,600 | 100 | 106,900 | 100 | 138,000 |
| All other pears | 22,100 | 1,290,900 | 34,000 | 1,451,800 | 6,800 | 2,805,600 |
| All varieties | 78,100 | 1,826,500 | 51,900 | 1,669,800 | 22,100 | 3,648,400 |
1 Includes Benton, Clackamas, Columbia, Lane, Linn, Marion, Multnomah, Polk, Washington, and Yamhill counties.
2 Other varieties include varieties with minimal acreage, unknown varieties, or varieties not published to avoid disclosure of individual operations.
| Growing area | Year planted | Unknown ages | Total trees of all ages | |||||
|---|---|---|---|---|---|---|---|---|
| Before 1984 | 1984-1993 | 1994-1998 | 1999-2001 | 2002-2003 | 2004-2005 | |||
| Trees | Trees | Trees | Trees | Trees | Trees | Trees | Trees | |
| Willamette Valley 1 | 118,000 | 38,300 | 25,700 | 22,600 | 15,900 | 31,300 | 5,700 | 257,500 |
| Hood River | 83,500 | 48,100 | 42,000 | 49,500 | 55,250 | 66,250 | 500 | 345,100 |
| Wasco | 234,500 | 187,700 | 206,400 | 309,100 | 180;200 | 169,400 | 1,300 | 1,288,600 |
| Umatilla | 5,500 | 20,300 | 5,100 | 10,800 | 13,700 | 14,700 | 300 | 70,400 |
| Union | 21,000 | 11,700 | 5,800 | 4,100 | 3,400 | 2,900 | 2,600 | 51,500 |
| Other areas | 10,900 | 3,000 | 7,500 | 3,800 | 3,750 | 1,850 | 100 | 30,900 |
| Oregon | 473,400 | 309,100 | 292,500 | 399,900 | 272,200 | 286,400 | 10,500 | 2,044,000 |
1 Includes Benton, Clackamas, Columbia, Lane, Linn, Marion, Multnomah, Polk, Washington, and Yamhill counties.
Oregon sweet cherry trees percent of total, by growing area
Top Oregon sweet cherry varieties total trees of all ages
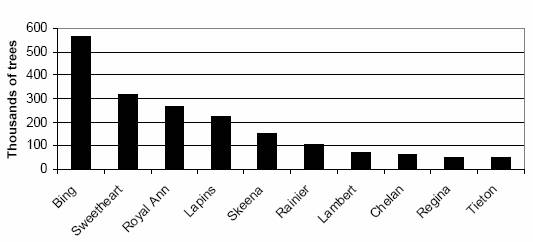
| Variety | Year planted | Unknown ages | Total trees of all ages | |||||
|---|---|---|---|---|---|---|---|---|
| Before 1984 | 1984-1993 | 1994-1998 | 1999-2001 | 2002-2003 | 2004-2005 | |||
| Trees | Trees | Trees | Trees | Trees | Trees | Trees | Trees | |
| Attika | - | - | - | 1,300 | 2,300 | 1,400 | - | 5,000 |
| Bada | 5,300 | 4,500 | 1,000 | 400 | - | 150 | 150 | 11,500 |
| Bing | 174,600 | 176,200 | 99,000 | 69,400 | 29,500 | 16,400 | 700 | 565,800 |
| Black Republican | 4,500 | 700 | 950 | 250 | 200 | 350 | 50 | 7,000 |
| Chelan | 1,000 | 5,100 | 4,600 | 18,000 | 14,200 | 21,100 | - | 64,000 |
| Comm | 12,100 | 6,100 | 1,700 | 250 | 1,100 | 800 | 50 | 22,100 |
| Lambert | 55,400 | 11,500 | 1,700 | 300 | 50 | 700 | 2,350 | 72,000 |
| Lapins | 21,100 | 9,200 | 73,500 | 92,600 | 11,300 | 15,600 | - | 223,300 |
| Rainier | 11,000 | 23,100 | 21,000 | 16,000 | 17,800 | 15,300 | 800 | 105,000 |
| Regina | 800 | 2,300 | 1,500 | 23,300 | 17,400 | 5,100 | - | 50,400 |
| Royal Ann | 160,400 | 38,200 | 26,100 | 18,700 | 8,600 | 10,400 | 2,600 | 265,000 |
| Sandra Rose | - | - | 4,350 | 3,000 | - | 1,550 | - | 8,900 |
| Selah | - | - | - | 800 | 1,200 | 16,300 | - | 18,300 |
| Skeena | - | 9,300 | 8,100 | 20,200 | 48,400 | 67,500 | - | 153,500 |
| Sonata | - | - | - | - | 1,000 | 500 | - | 1,500 |
| Sweetheart | 800 | 200 | 37,600 | 109,600 | 83,300 | 85,900 | 300 | 317,700 |
| Tieton | - | - | 1,800 | 12,700 | 21,900 | 13,900 | - | 50,300 |
| Van | 21,400 | 9,800 | 7,300 | 3,500 | 3,250 | 4,250 | 300 | 49,800 |
| Other varieties 1 | 5,000 | 12,900 | 2,300 | 9,600 | 10,700 | 9,200 | 3,200 | 52,900 |
| All varieties | 473,400 | 309,100 | 292,500 | 399,900 | 272,200 | 286,400 | 10,500 | 2,044,000 |
1 Other varieties include varieties with minimal acreage, unknown varieties, or varieties not published to avoid disclosure of individual operations.
| Variety | Willamette Valley 1 |
Hoo River | Wasco | Umatilla | Union | Other areas | Oregon |
|---|---|---|---|---|---|---|---|
| Trees | Trees | Trees | Trees | Trees | Trees | Trees | |
| Attika | - | - | 5,000 | - | - | - | 5,000 |
| Bada | 11,500 | - | - | - | - | - | 11,500 |
| Bing | 16,400 | 55,400 | 454,200 | 33,000 | 600 | 6,200 | 565,800 |
| Black Republican | 700 | 300 | 6,000 | - | - | - | 7,000 |
| Chelan | - | 700 | 52,900 | 10,200 | - | 200 | 64,000 |
| Comm | 21,500 | - | 200 | - | - | 400 | 22,100 |
| Lambert | 1,600 | 46,700 | 4,200 | 200 | 17,400 | 1,900 | 72,000 |
| Lapins | 3,500 | 75,600 | 128,800 | 400 | 12,000 | 3,000 | 223,300 |
| Rainier | 6,300 | 20,300 | 66,300 | 3,800 | 6,300 | 2,000 | 105,000 |
| Regina | 5,500 | 2,500 | 41,100 | 1,300 | - | - | 50,400 |
| Royal Ann | 141,900 | 3,900 | 92,700 | 1,000 | 10,900 | 14,600 | 265,000 |
| Sandra Rose | 2,500 | 200 | 6,200 | - | - | - | 8,900 |
| Selah | - | 3,800 | 14,500 | - | - | - | 18,300 |
| Skeena | 2,000 | 77,700 | 69,700 | 1,000 | 2,900 | 200 | 153,500 |
| Sonata | - | 200 | 1,300 | - | - | - | 1,500 |
| Sweetheart | 17,200 | 43,300 | 251,700 | 3,700 | 1,400 | 400 | 317,700 |
| Tieton | 600 | 2,400 | 43,800 | 3,400 | - | 100 | 50,300 |
| Van | 12,600 | 5,900 | 30,400 | 800 | - | 100 | 49,800 |
| Other varieties 2 | 13,700 | 6,200 | 19,600 | 11,600 | - | 1,800 | 52,900 |
| All varieties | 257,500 | 345,100 | 1,288,600 | 70,400 | 51,500 | 30,900 | 2,044,000 |
1 Includes Benton, Clackamas, Columbia, Lane, Linn, Marion, Multnomah, Polk, Washington, and Yamhill counties.
2 Other varieties include varieties with minimal acreage, unknown varieties, or varieties not published to avoid disclosure of individual operations.
| Growing area | Year planted | Unknown ages | Total trees of all ages | |||||
|---|---|---|---|---|---|---|---|---|
| Before 1984 | 1984-1993 | 1994-1998 | 1999-2001 | 2002-2003 | 2004-2005 | |||
| Trees | Trees | Trees | Trees | Trees | Trees | Trees | Trees | |
| Willamette Valley1 | 29,450 | 19,600 | 1,700 | 1,150 | 2,300 | 18,500 | 200 | 72,900 |
| Other areas | 900 | - | - | - | - | - | - | 900 |
| Oregon | 30,350 | 19,600 | 1,700 | 1,150 | 2,300 | 18,500 | 200 | 73,800 |
1 Includes Benton, Clackamas, Columbia, Lane, Linn, Marion, Multnomah, Polk, Washington, and Yamhill counties.
| Variety | Year planted | Unknown ages | Total trees of all ages | |||||
|---|---|---|---|---|---|---|---|---|
| Before 1984 | 1984-1993 | 1994-1998 | 1999-2001 | 2002-2003 | 2004-2005 | |||
| Trees | Trees | Trees | Trees | Trees | Trees | Trees | Trees | |
| Montmorency | 28,950 | 19,100 | 1,700 | 1,150 | 2,300 | 18,500 | 200 | 71,900 |
| Other varieties 1 |
1,400 | 500 | - | - | - | - | - | 1,900 |
| All varieties | 30,350 | 19,600 | 1,700 | 1,150 | 2,300 | 18,500 | 200 | 73,800 |
1 Other varieties include varieties with minimal acreage, unknown varieties, or varieties not published to avoid disclosure of individual operations.
| Variety | Willamette Valley 1 |
Other areas | Oregon |
|---|---|---|---|
| Trees | Trees | Trees | |
| Montmorency | 71,000 | 900 | 71,900 |
| Other varieties 2 | 1,900 | - | 1,900 |
| All varieties | 72,900 | 900 | 73,800 |
1 Includes Benton, Clackamas, Columbia, Lane, Linn, Marion, Multnomah, Polk, Washington, and Yamhill counties.
2 Other varieties include varieties with minimal acreage, unknown varieties, or varieties not published to avoid disclosure of individual operations.
| Growing area | Year planted | Unknown ages | Total trees of all ages | |||||
|---|---|---|---|---|---|---|---|---|
| Before 1984 | 1984-1993 | 1994-1998 | 1999-2001 | 2002-2003 | 2004-2005 | |||
| Trees | Trees | Trees | Trees | Trees | Trees | Trees | Trees | |
| Willamette Valley 1 |
21,600 | 16,400 | 5,200 | 7,700 | 1,000 | 2,300 | 3,300 | 57,500 |
| Jackson/Josephine | 8,200 | 7,100 | 4,900 | 9,500 | 13,500 | 200 | 100 | 43,500 |
| Other areas | 8,400 | 4,400 | 5,300 | 6,000 | 200 | 1,800 | 200 | 26,300 |
| Oregon | 38,200 | 27,900 | 15,400 | 23,200 | 14,700 | 4,300 | 3,600 | 127,300 |
1 Includes Benton, Clackamas, Columbia, Lane, Linn, Marion, Multnomah, Polk, Washington, and Yamhill counties.
| Variety | Year planted | Unknown ages | Total trees of all ages | |||||
|---|---|---|---|---|---|---|---|---|
| Before 1984 | 1984-1993 | 1994-1998 | 1999-2001 | 2002-2003 | 2004-2005 | |||
| Trees | Trees | Trees | Trees | Trees | Trees | Trees | Trees | |
| Canadian Harmony | 900 | 800 | - | - | - | 600 | 400 | 2,700 |
| Early Redhaven | 1,000 | 600 | 400 | 100 | - | - | - | 2,100 |
| Fortyniner | 2,800 | 3,200 | 2,500 | 500 | 500 | 200 | - | 9,700 |
| Harken | 600 | 600 | - | - | - | - | - | 1,200 |
| Elberta1 | 5,500 | 1,500 | 1,700 | 2,300 | - | 100 | 400 | 11,500 |
| O'Henry | 1,500 | 100 | 600 | 2,200 | - | - | - | 4,400 |
| Redhaven | 8,700 | 5,700 | 2,100 | 400 | 400 | 800 | 800 | 18,900 |
| Suncrest | 800 | 4,500 | 3,800 | 4,600 | 5,400 | 300 | 400 | 19,800 |
| Veteran | 1,900 | 2,300 | 500 | 200 | 300 | 900 | 500 | 6,600 |
| Other varieties 2 |
14,500 | 8,600 | 3,800 | 12,900 | 8,100 | 1,400 | 1,100 | 50,400 |
| All varieties | 38,200 | 27,900 | 15,400 | 23,200 | 14,700 | 4,300 | 3,600 | 127,300 |
1 Elberta includes all Elberta varieties.
2 Other varieties include varieties with minimal acreage, unknown varieties, or varieties not published to avoid disclosure of individual operations.
| Variety | Willamette Valley 1 |
Jackson and Josephine |
Other areas | Oregon |
|---|---|---|---|---|
| Trees | Trees | Trees | Trees | |
| Canadian Harmony | 2,700 | - | - | 2,700 |
| Early Redhaven | 1,500 | - | 600 | 2,100 |
| Fortyniner | 1,500 | 8,000 | 200 | 9,700 |
| Harken | 800 | - | 400 | 1,200 |
| Elberta 2 | 6,100 | 800 | 4,600 | 11,500 |
| O'Henry | 900 | - | 3,500 | 4,400 |
| Redhaven | 12,300 | 1,400 | 5,200 | 18,900 |
| Suncrest | 11,600 | 7,500 | 700 | 19,800 |
| Veteran | 5,200 | - | 1,400 | 6,600 |
| Other varieties 3 | 14,900 | 25,800 | 9,700 | 50,400 |
| All varieties | 57,500 | 43,500 | 26,300 | 127,300 |
1 Includes Benton, Clackamas, Columbia, Lane, Linn, Marion, Multnomah, Polk, Washington, and Yamhill counties.
2 Elberta includes all Elberta varieties.
3 Other varieties include varieties with minimal acreage, unknown varieties, or varieties not published to avoid disclosure of individual operations.
| Growing area | Year planted | Unknown ages | Total trees of all ages | |||||
|---|---|---|---|---|---|---|---|---|
| Before 1984 | 1984-1993 | 1994-1998 | 1999-2001 | 2002-2003 | 2004-2005 | |||
| Trees | Trees | Trees | Trees | Trees | Trees | Trees | Trees | |
| Willamette Valley1 | 89,000 | 16,100 | 3,400 | 2,600 | 450 | 4,250 | 1,200 | 117,000 |
| Douglas | 9,100 | 2,800 | - | - | 100 | - | 100 | 12,100 |
| Umatilla | 200 | 24,500 | 2,500 | 5,450 | 1,350 | 400 | 400 | 34,800 |
| Other areas | 2,000 | 5,000 | 1,700 | 850 | 2,200 | 150 | - | 11,900 |
| Oregon | 100,300 | 48,400 | 7,600 | 8,900 | 4,100 | 4,800 | 1,700 | 175,800 |
1 Includes Benton, Clackamas, Columbia, Lane, Linn, Marion, Multnomah, Polk, Washington, and Yamhill counties.
| Variety | Year planted | Unknown ages | Total trees of all ages | |||||
|---|---|---|---|---|---|---|---|---|
| Before 1984 | 1984-1993 | 1994-1998 | 1999-2001 | 2002-2003 | 2004-2005 | |||
| Trees | Trees | Trees | Trees | Trees | Trees | Trees | Trees | |
| Brooks | 9,000 | 2,900 | 800 | 200 | - | - | - | 12,900 |
| Early Italian | 300 | 16,700 | 1,300 | 100 | - | - | - | 18,400 |
| Empress | 100 | 3,400 | - | 3,800 | 2,100 | 400 | - | 9,800 |
| Late Italian | 80,500 | 10,500 | 1,900 | 2,700 | 700 | 300 | 1,200 | 97,800 |
| Moyer | 3,500 | 3,700 | - | 900 | 100 | 1,000 | - | 9,200 |
| Santa Rosa | 200 | 100 | 600 | 100 | 600 | 600 | - | 2,200 |
| Shiro | 100 | 500 | 100 | 100 | - | 100 | - | 900 |
| Other varieties 1 |
6,600 | 10,600 | 2,900 | 1,000 | 600 | 2,400 | 500 | 24,600 |
| All varieties | 100,300 | 48,400 | 7,600 | 8,900 | 4,100 | 4,800 | 1,700 | 175,800 |
1 Other varieties include varieties with minimal acreage, unknown varieties, or varieties not published to avoid disclosure of individual operations. Also includes Pluots.
| Variety | Willamette Valley 1 |
Douglas | Umatilla | Other areas | Oregon |
|---|---|---|---|---|---|
| Trees | Trees | Trees | Trees | Trees | |
| Brooks | 10,800 | 1,100 | - | 1,000 | 12,900 |
| Early Italian | - | - | 18,400 | - | 18,400 |
| Empress | - | - | 6,100 | 3,700 | 9,800 |
| Late Italian | 87,000 | 6,200 | 4,100 | 500 | 97,800 |
| Moyer | 4,800 | 4,400 | - | - | 9,200 |
| Santa Rosa | 1,400 | - | - | 800 | 2,200 |
| Shiro | 500 | - | 400 | - | 900 |
| Other varieties 2 | 12,500 | 400 | 5,800 | 5,900 | 24,600 |
| All varieties | 117,000 | 12,100 | 34,800 | 11,900 | 175,800 |
1 Includes Benton, Clackamas, Columbia, Lane, Linn, Marion, Multnomah, Polk, Washington, and Yamhill counties.
2 Other varieties include varieties with minimal acreage, unknown varieties, or varieties not published to avoid disclosure of individual operations. Also includes Pluots.
Acknowledgements
Special appreciation is extended to the Oregon orchardists who furnished data for this survey. Without their cooperation and assistance, this report would not be possible. Appreciation is also extended to the Oregon Sweet Cherry Commission and the Pear Bureau Northwest for their financial contribution. Thank you to Jim Bishop in The Dalles Farm Service Agency, USDA office for the time, energy, and effort he put into this project. Thank you also to the phone and field enumerators for their hard work in collecting data for this survey.
The information in this report will assist in forecasting crop size, especially as new trees become bearing. Being able to predict crop size helps develop marketing plans and strategies to successfully move Oregon fruit at a profitable price. Survey results will also aid the industry with transportation planning and evaluating labor needs. Results will help identify planting trends that can aid growers in making decisions about future plantings and help avoid potential overproduction.