Skip to main content Skip to main navigation Skip to search
ABARES - Land use and management

Top navigation abares

  • Department
  • Ministers
  • Media Centre
Main menu

Main navigation ACLUMP

  • Land home
    Land home
  • About ACLUMP
    About ACLUMP
  • Land use
    Land use
  • Publications
    Publications
  • Data download
    Data download
  • Latest news
    Latest news
Department of Agriculture

Breadcrumb

  1. DAFF Home
  2. ABARES
  3. Land use and management
  4. Land use change overview
  5. Catchment scale examples

Secondary ACLUMP

  • Land use
    • Land use mapping
    • Catchment scale land use of Australia and Commodities – Update December 2023
    • Catchment scale land use profiles
    • Mapping technical specifications
    • Land use apps
    • Data download
    • Publications
    • Australian Land Use and Management Classification
      • ALUM Classification Version 8 (October 2016)
    • Australian Agricultural Census 2020–21 visualisations
    • Land use of Australia 2010–11 to 2020–21

Catchment scale examples

Some of the ACLUMP state partners have conducted initial work to address land use change detection and reporting in Australia. Examples of this work are provided below.

Queensland land use change mapping

The Queensland Land Use Mapping Program (QLUMP) ​regulary produces land use change maps, tables​ and reports as part of its land use summary reports​.

Land use change map for the Johnstone River catchment from 1999 to 2004. The majority of the area is classified as no change. Main changes are - natural feature protection to defence, dairy to grazing natural vegetation, sugar to irrigated modified pastures, grazing natural vegetation to irrigated tree fruits, sugar to land in transition.
Figure 1: 1999 - 2004 land use change map for the Johnstone River catchment (Jamieson et al 2006)

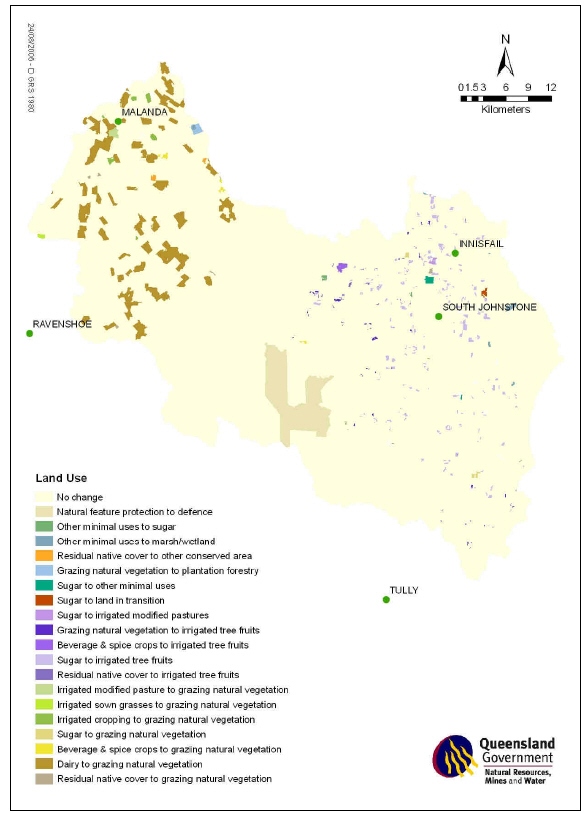
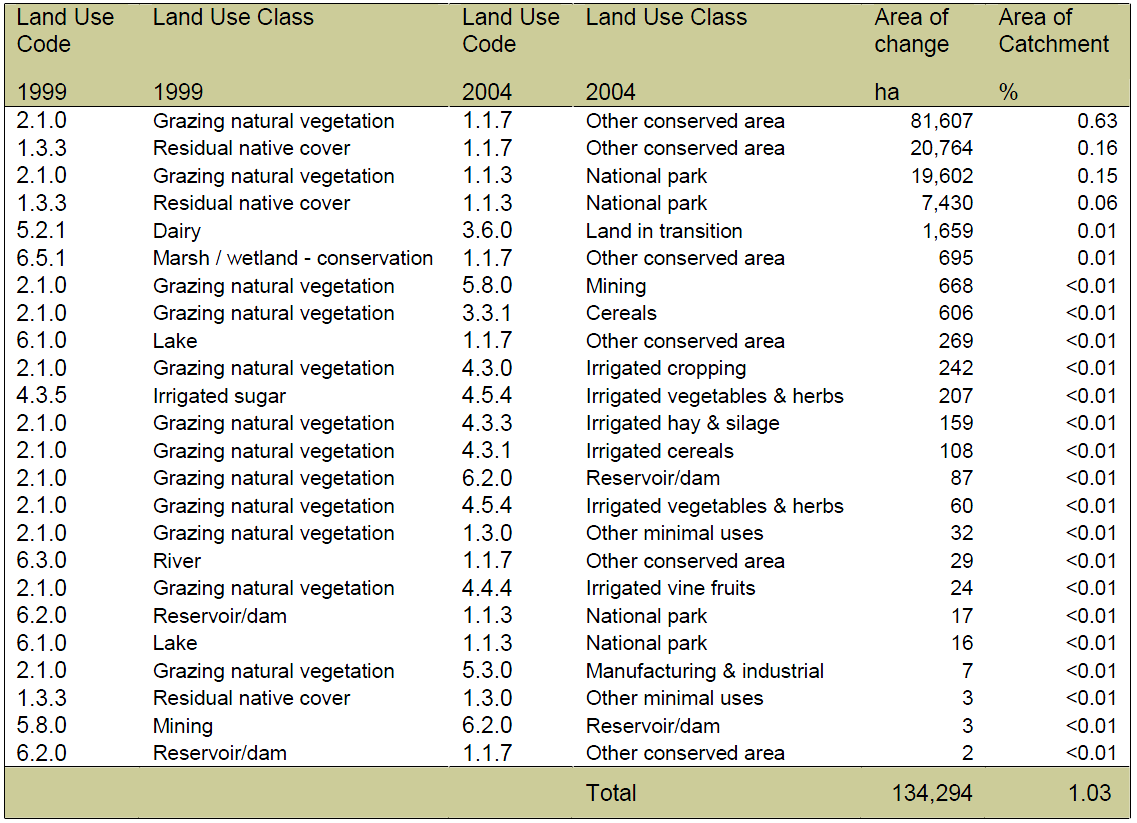
The Queensland method for detecting and mapping land use change makes best use of available spatial information, satellite imagery, aerial photographs, expert knowledge and field survey. It involves successive stages of data collation, interpretation, verification, validation and production of final outputs. The 1999 baseline dataset forms the basis for the updated dataset and is also corrected in the process if errors are found. Areas previously omitted or incorrectly mapped for 1999 are updated as well as areas of actual and potential land use change to create the new dataset. The updated land use map and the improved 1999 map are then differenced to produce a dataset representing land use change (see Figure 1). These changes are also presented as a table showing the areas of land converted to new land uses (Table 1).​

Table 1: Summary statistics for land use changes between the years of 1999 and 2004 in the Burdekin River catchment (van den Berg and Jamieson 2006: 12)

Summary statistics for land use change between the years of 1999 and 2004 in the Burdekin river catchment. The greatest area of change is from Grazing natural vegetation to other conserved areas (81,607 ha). Second is residual native cover to other conserved area, area of change in 20,764 ha. Third is grazing natural vegetation to national park which accounted for 16,602 ha. Forth largest change was from residual native cover to national park which accounted for 7,430 ha. The area of dairying which change into land in transition was 1,650 ha. All other land use changes were less than 1,000 ha

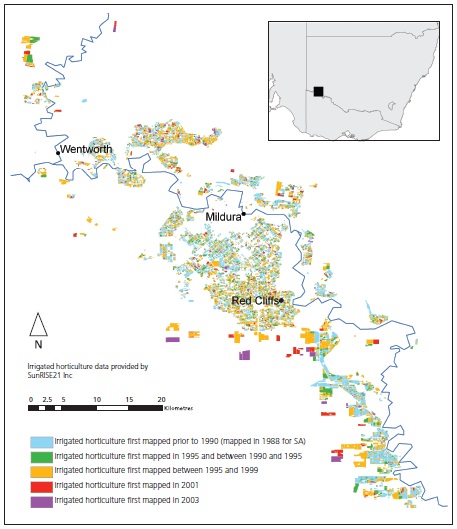
Mapping change in the Lower Murray region

Figure 2 shows trends in the expansion of irrigated horticulture around the towns of Mildura and Wentworth in the Lower Murray region of south-eastern Australia. This time-series, 1990-2003, is drawn from 1:25 000 catchment scale land use mapping completed using orthophoto interpretation and detailed property surveys. The mapping reveals a pattern of land use transformation and intensification from dryland cereal cropping and grazing to irrigated horticulture, and a trend to larger, dispersed developments at increasing distance from the river irrigation source.

Irrigated horticulture, by year of planning for the region surrounding the towns of Wentworth, Mildura and Red Cliffs in south eastern Australia. Blue is irrigated horticulture first mapped prior to 1990. Green irrigated horticulture first mapped 1995, yellow irrigated horticulture first mapped between 1995 and 1999, red irrigated horticulture first mapped in 2001 and purple irrigated horticulture first mapped in 2003
Figure 2: Irrigated horticulture, by year of planting, for the region surrounding the towns of Wentworth, Mildura and Red Cliffs in south eastern Australia (Smith and Lesslie 2005)
Thanks for your feedback.
Thanks! Your feedback has been submitted.

We aren't able to respond to your individual comments or questions.
To contact us directly phone us or submit an online inquiry

CAPTCHA
This question is for testing whether or not you are a human visitor and to prevent automated spam submissions.

Please verify that you are not a robot.

Skip
Page last updated: 13 October 2021

We acknowledge the continuous connection of First Nations Traditional Owners and Custodians to the lands, seas and waters of Australia. We recognise their care for and cultivation of Country. We pay respect to Elders past and present, and recognise their knowledge and contribution to the productivity, innovation and sustainability of Australia’s agriculture, fisheries and forestry industries.

Artwork: Protecting our Country, Growing our Future
© Amy Allerton, contemporary Aboriginal Artist of the Gumbaynggirr, Bundjalung and Gamilaroi nations.

Footer

  • Contact us
  • Accessibility
  • Disclaimer
  • Privacy
  • FOI

© Department of Agriculture, Fisheries and Forestry

Facebook X LinkedIn Instagram