Skip to main content Skip to main navigation Skip to search
ABARES - Land use and management

Top navigation abares

  • Department
  • Ministers
  • Media Centre
Main menu

Main navigation ACLUMP

  • Land home
    Land home
  • About ACLUMP
    About ACLUMP
  • Land use
    Land use
  • Publications
    Publications
  • Data download
    Data download
  • Latest news
    Latest news
Department of Agriculture

Breadcrumb

  1. DAFF Home
  2. ABARES
  3. Land use and management
  4. Land use change overview
  5. National scale examples

Secondary ACLUMP

  • Land use
    • Land use mapping
    • Catchment scale land use of Australia and Commodities – Update December 2023
    • Catchment scale land use profiles
    • Mapping technical specifications
    • Land use apps
    • Data download
    • Publications
    • Australian Land Use and Management Classification
      • ALUM Classification Version 8 (October 2016)
    • Australian Agricultural Census 2020–21 visualisations
    • Land use of Australia 2010–11 to 2020–21

National scale examples

​Changes in land use based on the national scale land use datasets

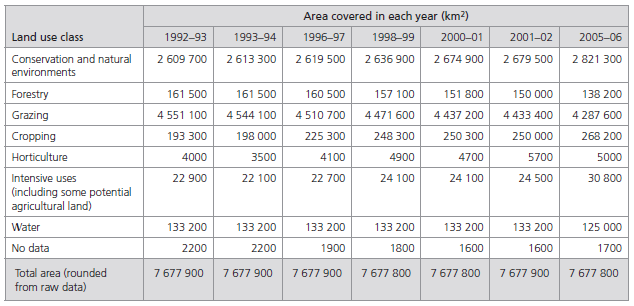
Table 1 shows the change in area of seven broad land use classes at the national level from 1992-93 to 2005-06. Conservation land uses (including Indigenous lands and minimal use areas such a residual native cover and Defence land in natural areas) have increased by almost 212 000 sqkm (almost 8% of Australia) between 1992-93 and 2005-06 to almost 2 821 000 sqkm.

The area of land classed as grazing has been slowly decreasing since 1992-93 from a high of just over 4 550 000 sqkm to less than 4 288 000 sqkm in 2005-06 (a decrease of over 6%).

The area of cropping has increased by almost 75 000 sqkm (over 38%) over the same time period to 268 000 sqkm.

The area of horticulture increased around 1000 sqkm between 1992-93 and 2005-06; this was not gradual but spiked in 1998-99 and 2001-02. However, it should be noted that these years were agricultural survey rather than census years and so the lower number of respondents could result in larger sampling errors.

Intensive uses appear to have a marked increase between 2001-02 and 2005-06. While an increase in area is probable, the magnitude may be exaggerated due to the mapping of finer scale intensive land use classes in 2005-06 which were not mapped in previous years. These classes include intensive plant and animal production, services, utilities, transportation and waste. The inclusion of these classes saw the area of intensive uses rise to almost 31 000 sqkm in 2005-06.

Forestry has shown a decrease of over 23,000 sqkm (over 14%), however, it should be noted that many areas designated as forest in other datasets are classed as conservation in the land use datasets as this is their primary use. Therefore, these other datasets should be sourced if specifically interested in forest areas.

The same water dataset was used for the 1992-93 to 2001-02 land use datasets and so the table shows no change in the area of water features. The updated water dataset used in the 2005-06 map showed a decrease in the area of marshes/wetlands and estuary/coastal waters.

Table 1. Changes in land use from 1992-93 to 2005-06 based on series of national land use datasets

Table outlines changes in land use from 1992-93, 1993-94, 1996-97, 1998-99, 2001-01, 2001-20 and 2005-06 based on series of national land use datasets. The main land use classes are conservation and natural environments, forestry, grazing, cropping, horticulture, intensive uses, water and no data. The table provides area statements for each of these categories for each of the time periods. 

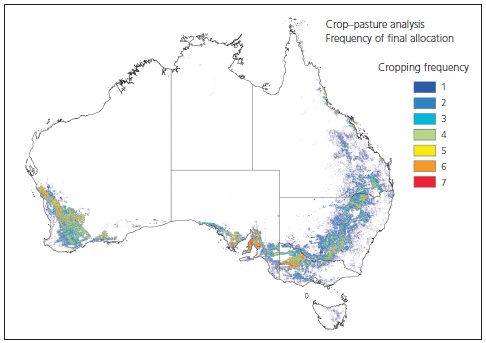
Detecting crop-pasture rotations

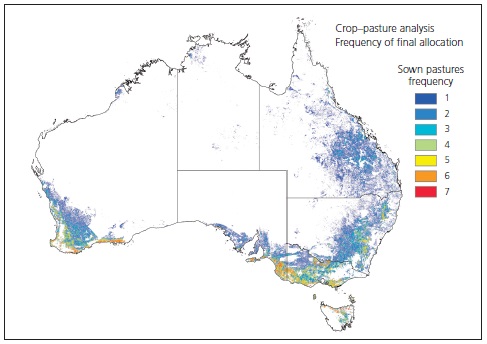
The time-series of national land use maps have been analysed to identify areas of permanent cropping, permanent pastures and areas in a crop/pasture rotation. For each year cropping areas (dryland and irrigated) were identified and then summed across the time-series to show how frequently an area was assigned to a cropping class (see Figure 1). The same process was carried out for pasture areas (see Figure 2).

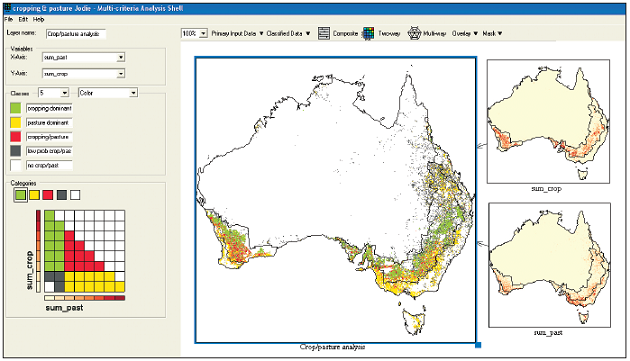
These layers were then combined using the Multi-Criteria Analysis Shell (MCAS-S) tool which is a decision support tool produced by ABARES used to conduct spatial information assessments and convey complex information in a readily understood manner (it can be downloaded from www.abares.gov.au/mcass). The layers were combined to determine areas that were predominantly cropped, areas that were predominantly pasture and areas where neither dominated. These areas are presumed to be in rotation. In Figure 3, areas in green are those that are predominantly pasture (rarely if ever cropped), areas in yellow are predominantly cropped (rarely if ever pasture) and those in red are likely to be in a crop/pasture rotation. Areas in grey are allocated as very low probability crop or pasture, and areas in white were never allocated to crop or pasture.

Number of years an area is mapped as cropping in the national scale land use time series from 1992 through to 2006. Cropping frequency 1 = dark blue, 2 = medium blue, 3 = light blue, 4 = green, 5 = yellow, 6 = orange 7 = red.

Figure 1. Number of years an area is mapped as cropping in the national scale land use time series (1992-93 to 2005-06)

Number of years an area is mapped as modified pastures in the national scale land use time series from 1992 though to 2006. Sown pastures frequency 1 = dark blue, 2 = medium blue, 3 = light blue, 4 = green, 5 = yellow, 6 = orange 7 = red.

Figure 2. Number of years an area is mapped as modified pastures in the national scale land use time series (1992-93 to 2005-06)

Analysis of crops and pastures from the national land use maps using the Multi-Criteria Analysis Shell (MCAS-S) tool. Areas in green are dominated by cropping over the national land use data time series, areas in yellow are dominated by pasture, red areas are a mix of cropping and pasture, grey areas are very low probability crop or pasture, and white areas were never allocated to crop or pasture.

Figure 3. Analysis of crops and pastures from the national land use maps using the Multi-Criteria Analysis Shell (MCAS-S) tool. Areas in green are dominated by cropping over the national land use data time series, areas in yellow are dominated by pasture, red areas are a mix of cropping and pasture, grey areas are very low probability crop or pasture, and white areas were never allocated to crop or pasture.
Thanks for your feedback.
Thanks! Your feedback has been submitted.

We aren't able to respond to your individual comments or questions.
To contact us directly phone us or submit an online inquiry

CAPTCHA
This question is for testing whether or not you are a human visitor and to prevent automated spam submissions.

Please verify that you are not a robot.

Skip
Page last updated: 13 October 2021

We acknowledge the continuous connection of First Nations Traditional Owners and Custodians to the lands, seas and waters of Australia. We recognise their care for and cultivation of Country. We pay respect to Elders past and present, and recognise their knowledge and contribution to the productivity, innovation and sustainability of Australia’s agriculture, fisheries and forestry industries.

Artwork: Protecting our Country, Growing our Future
© Amy Allerton, contemporary Aboriginal Artist of the Gumbaynggirr, Bundjalung and Gamilaroi nations.

Footer

  • Contact us
  • Accessibility
  • Disclaimer
  • Privacy
  • FOI

© Department of Agriculture, Fisheries and Forestry

Facebook X LinkedIn Instagram