
Publication date: 22 June 2022
This dataset has been superseded. See the Land use of Australia 2010-11 to 2020-21 for current data for all time periods and updated change products.
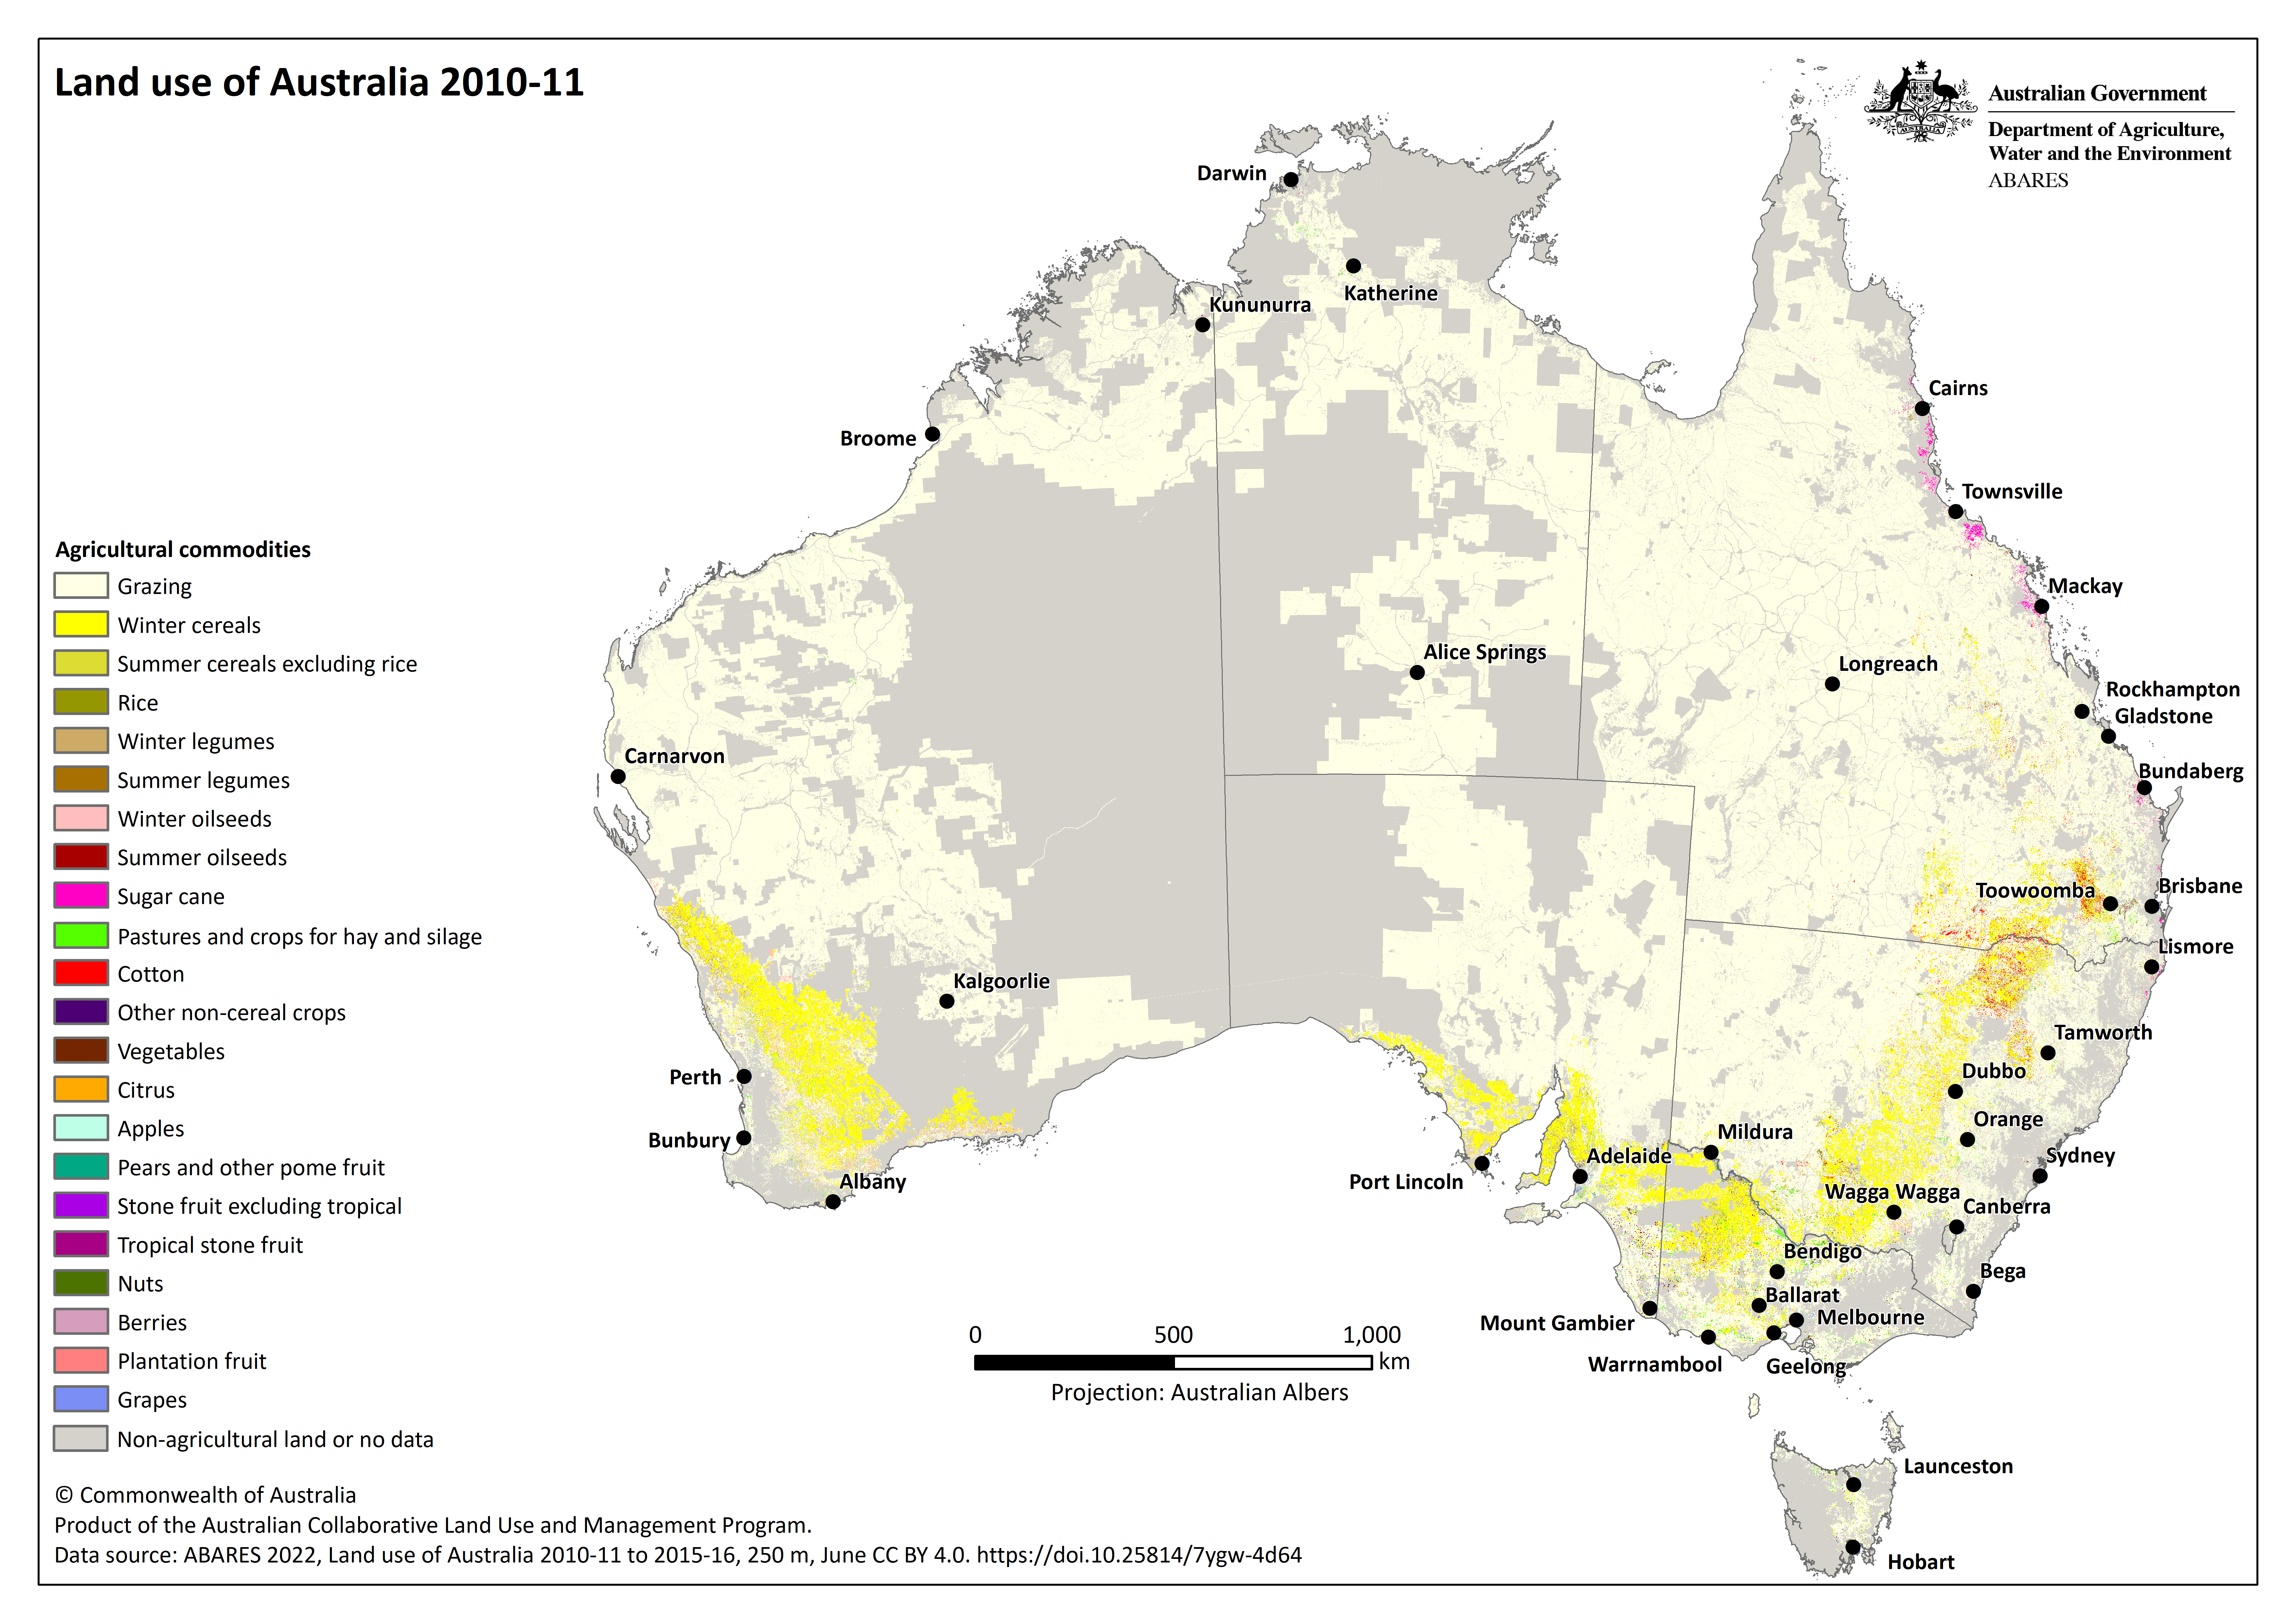
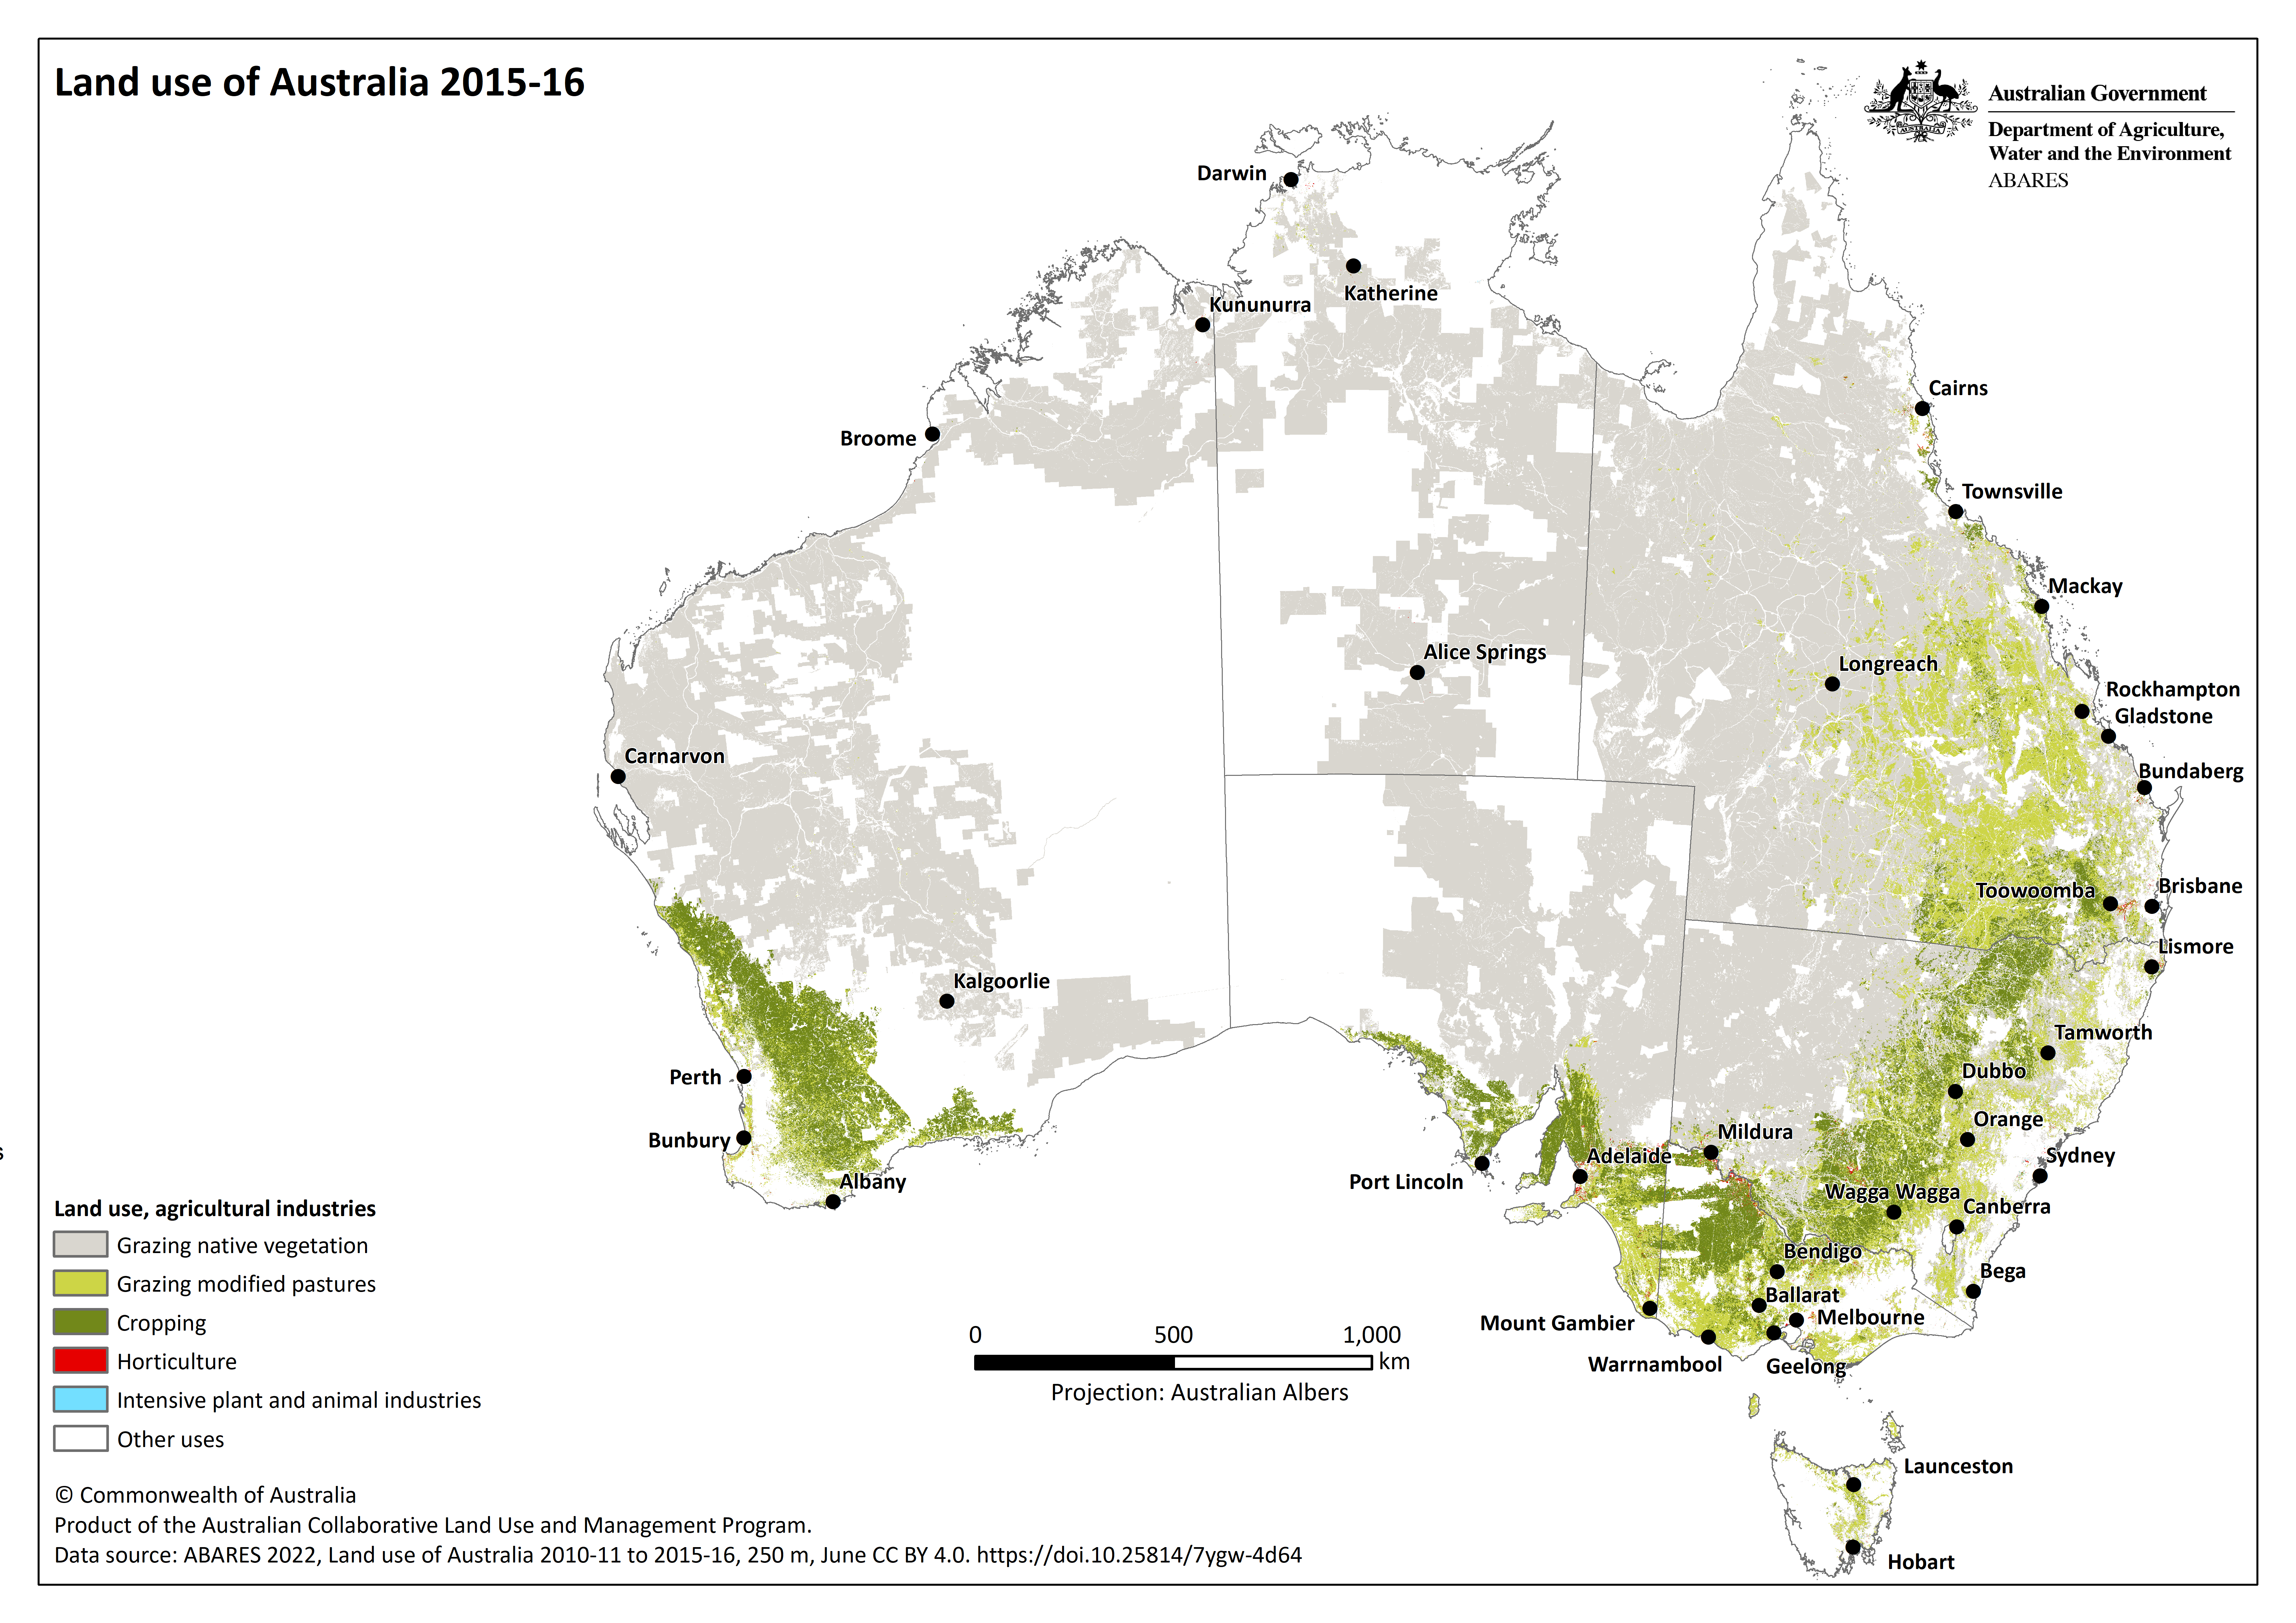
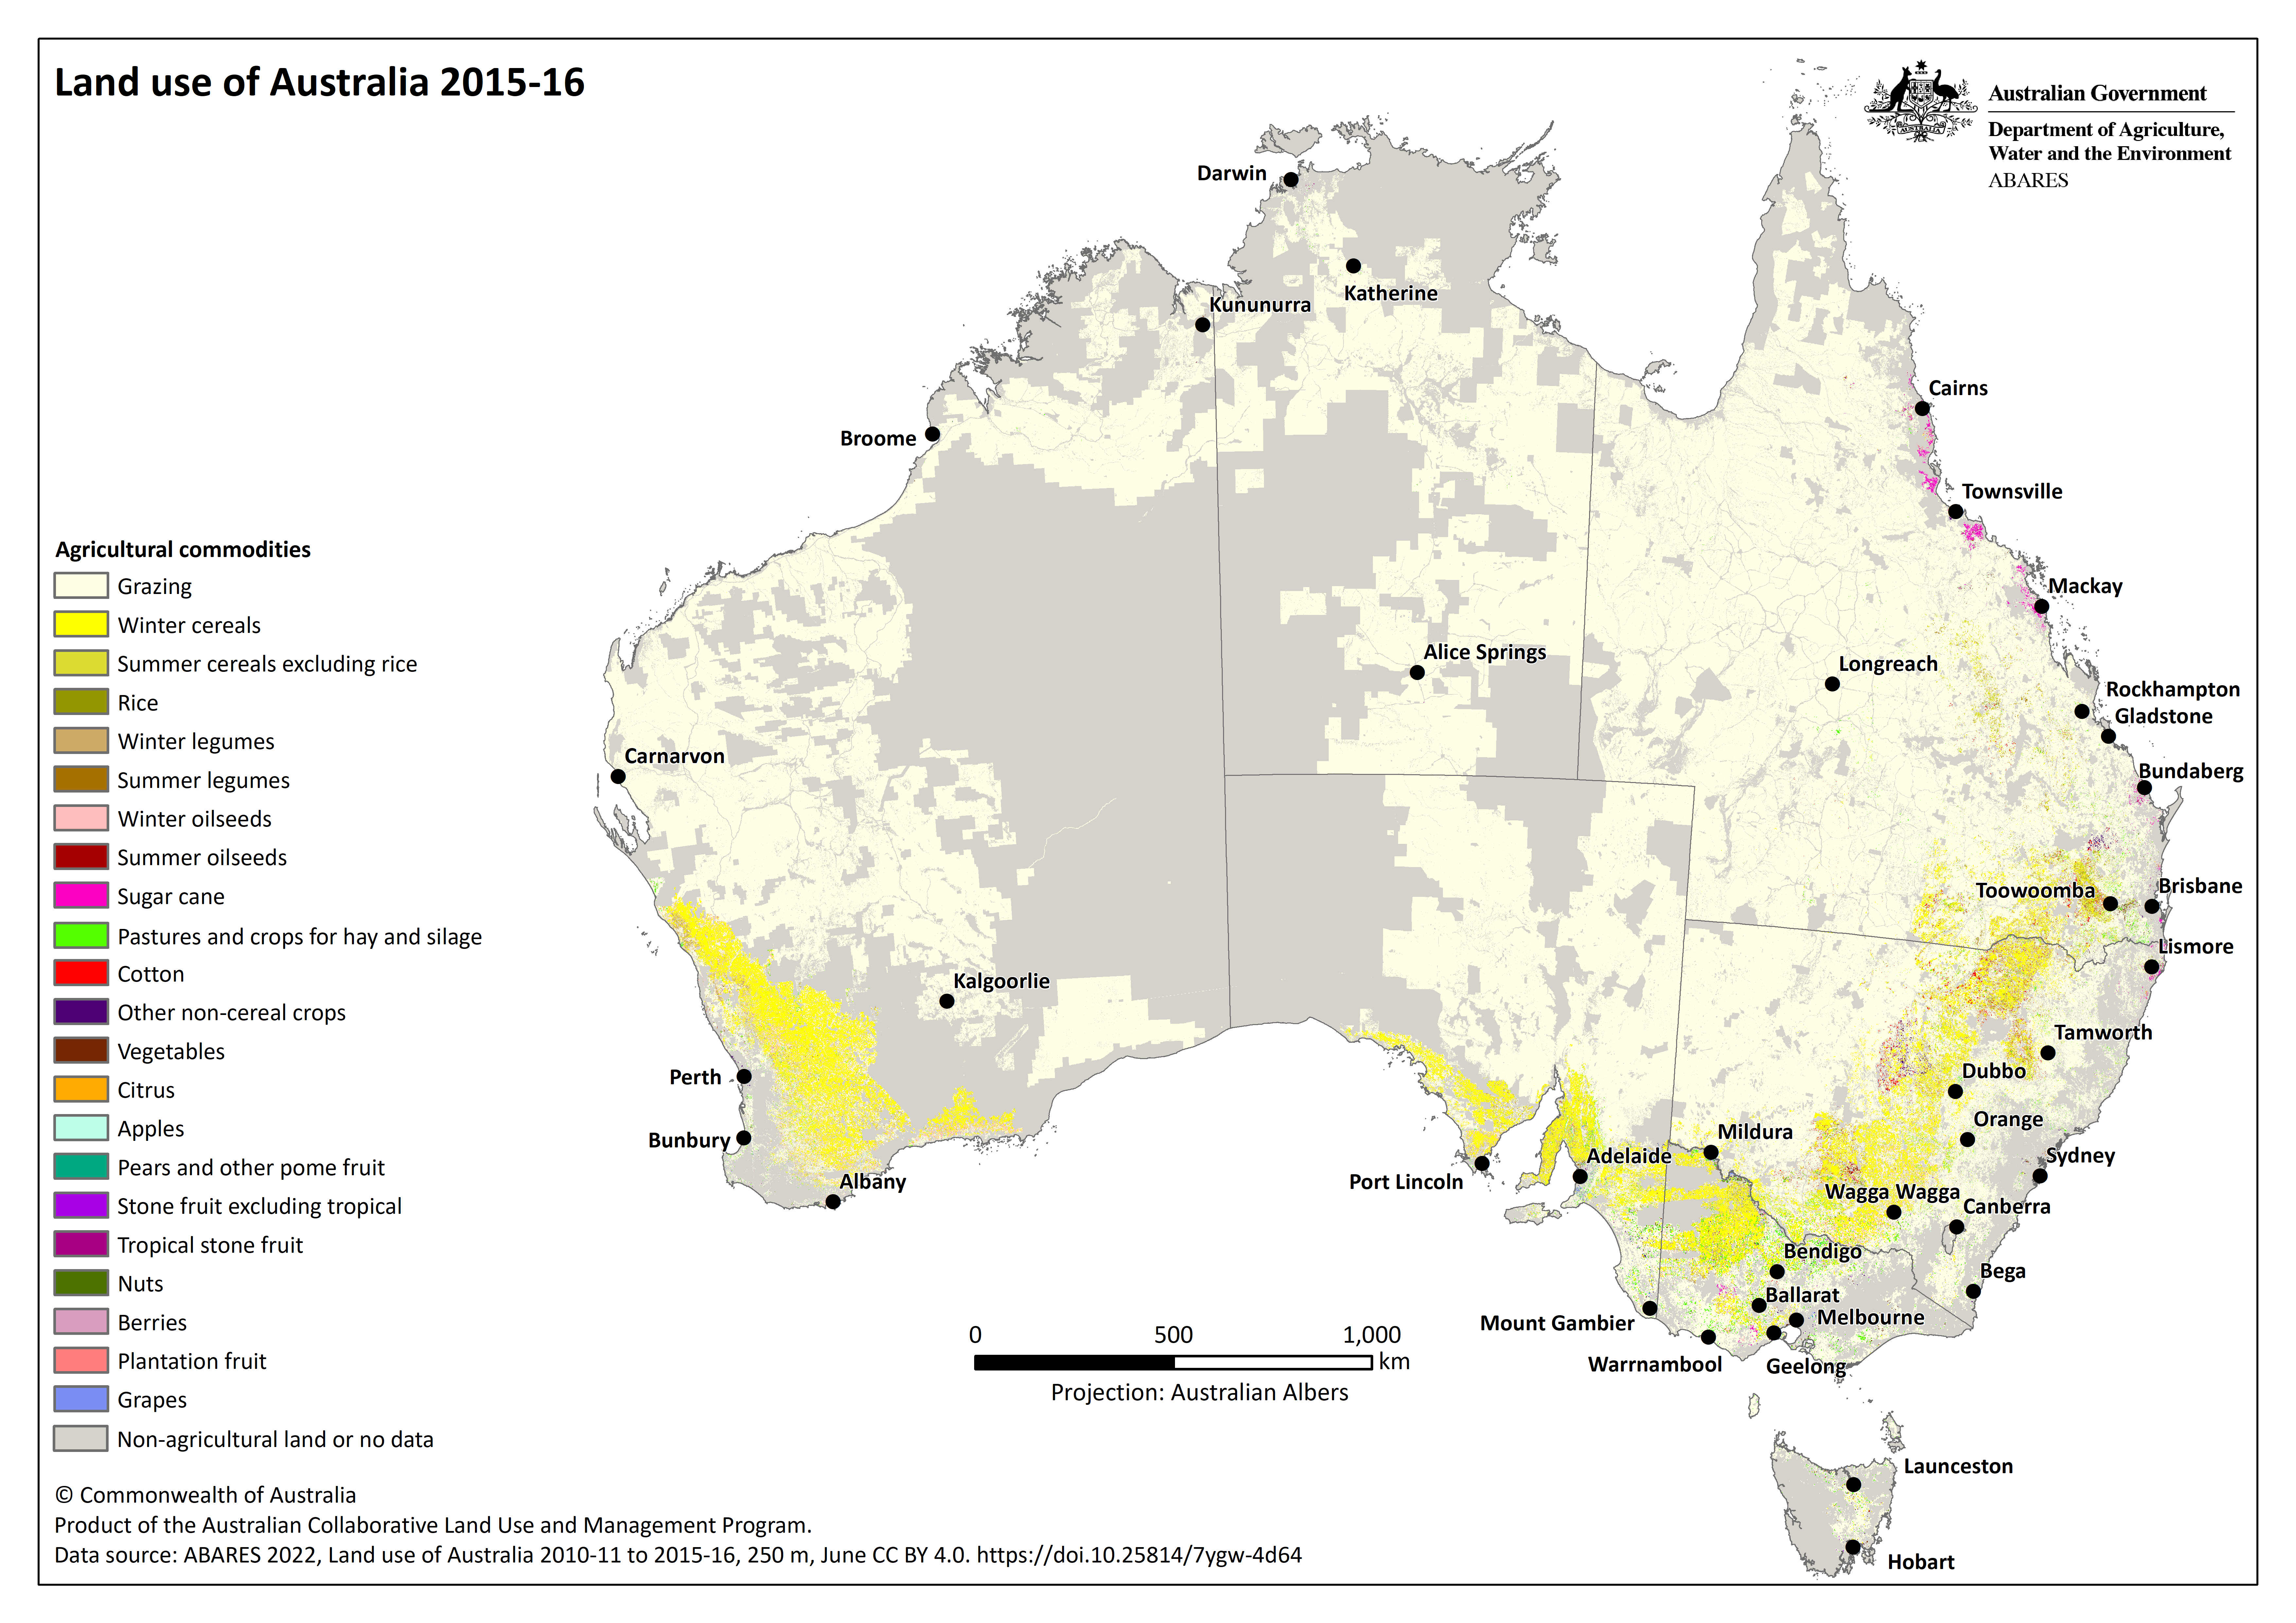
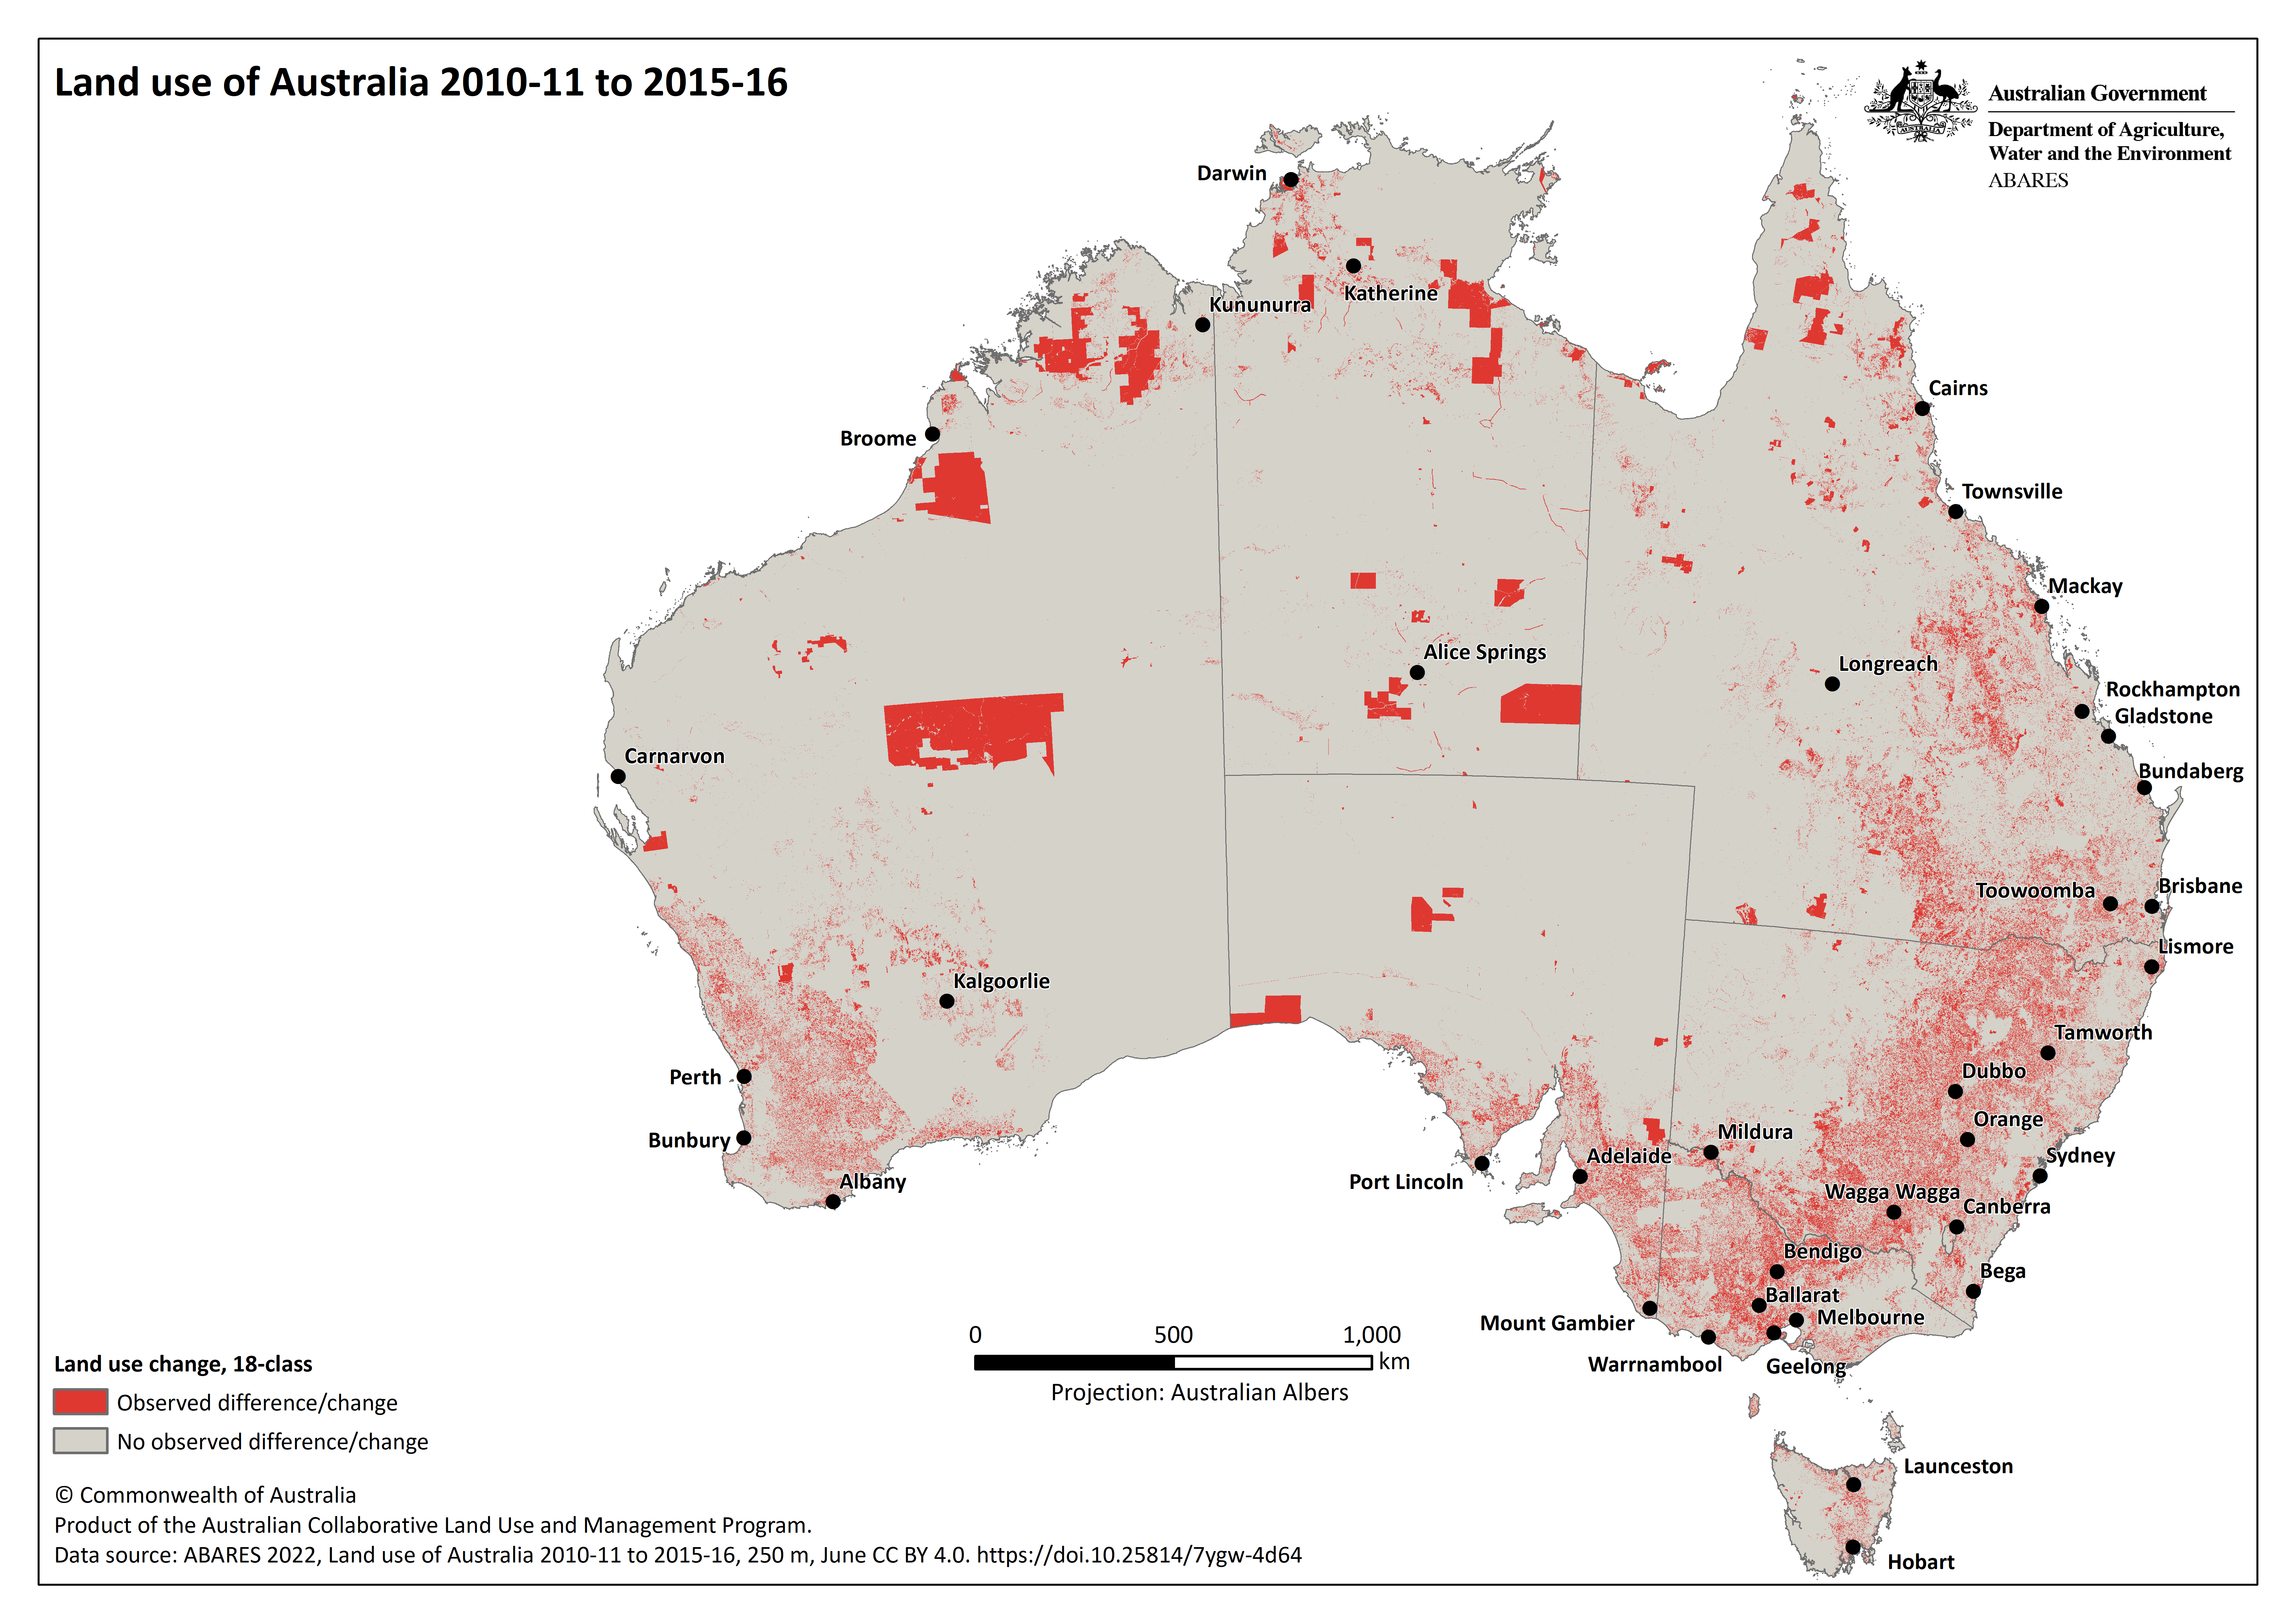
The Land use of Australia 2010–11 to 2015–16, 250 m is a data package of seamless continental rasters of land use at the national scale which provides the spatial representation of how Australia’s land resources are used. Data is for 2010–11 and 2015–16, and the associated change between the two years.
Non-agricultural land uses are mapped using seven thematic layers, derived from existing datasets provided by states and territories, and external agencies. The seven layers are:
- protected areas
- topographic features
- land tenure
- forest cover
- catchment-scale land use
- urban boundaries
- stock routes.
The agricultural land uses are based on the Australian Bureau of Statistics’ 2010–11 and 2015–16 agricultural census data; with spatial distributions modelled using MODIS satellite imagery and training data, assisted by spatial constraint layers for cultivation, horticulture, and irrigation.
Land use is specified according to the Australian Land Use and Management (ALUM) Classification version 8. The same method is applied to both time points using representative national datasets for each period, where available. Previous versions in this data series have had a ~ 1 kilometre resolution.
The Land use of Australia 2010–11 to 2015–16, 250 m data package is a product of the Australian Collaborative Land Use and Management Program.

Citation
ABARES 2022, Land use of Australia 2010–11 to 2015–16, 250 m, Australian Bureau of Agricultural and Resource Economics and Sciences, Canberra, September, CC BY 4.0. DOI: 10.25814/7ygw-4d64
Downloads
Data
Land use of Australia 2010–11 raster package (GeoTIFF and supporting files) (ZIP 18 MB)
Land use of Australia 2015–16 raster package (GeoTIFF and supporting files) (ZIP 18 MB)
The Land use of Australia 2010–11 to 2015–16, 250 m data package is also available on data.gov.au.
* Probability grids available via data.gov.au.
Metadata
Land use of Australia 2010–11 to 2015–16 – Descriptive metadata (PDF 1.3 MB)
Land use of Australia 2010–11 to 2015–16 – Descriptive metadata (DOCX 940 KB)
Maps
All maps are available in both PNG and PDF format.
Land use of Australia 2010–11
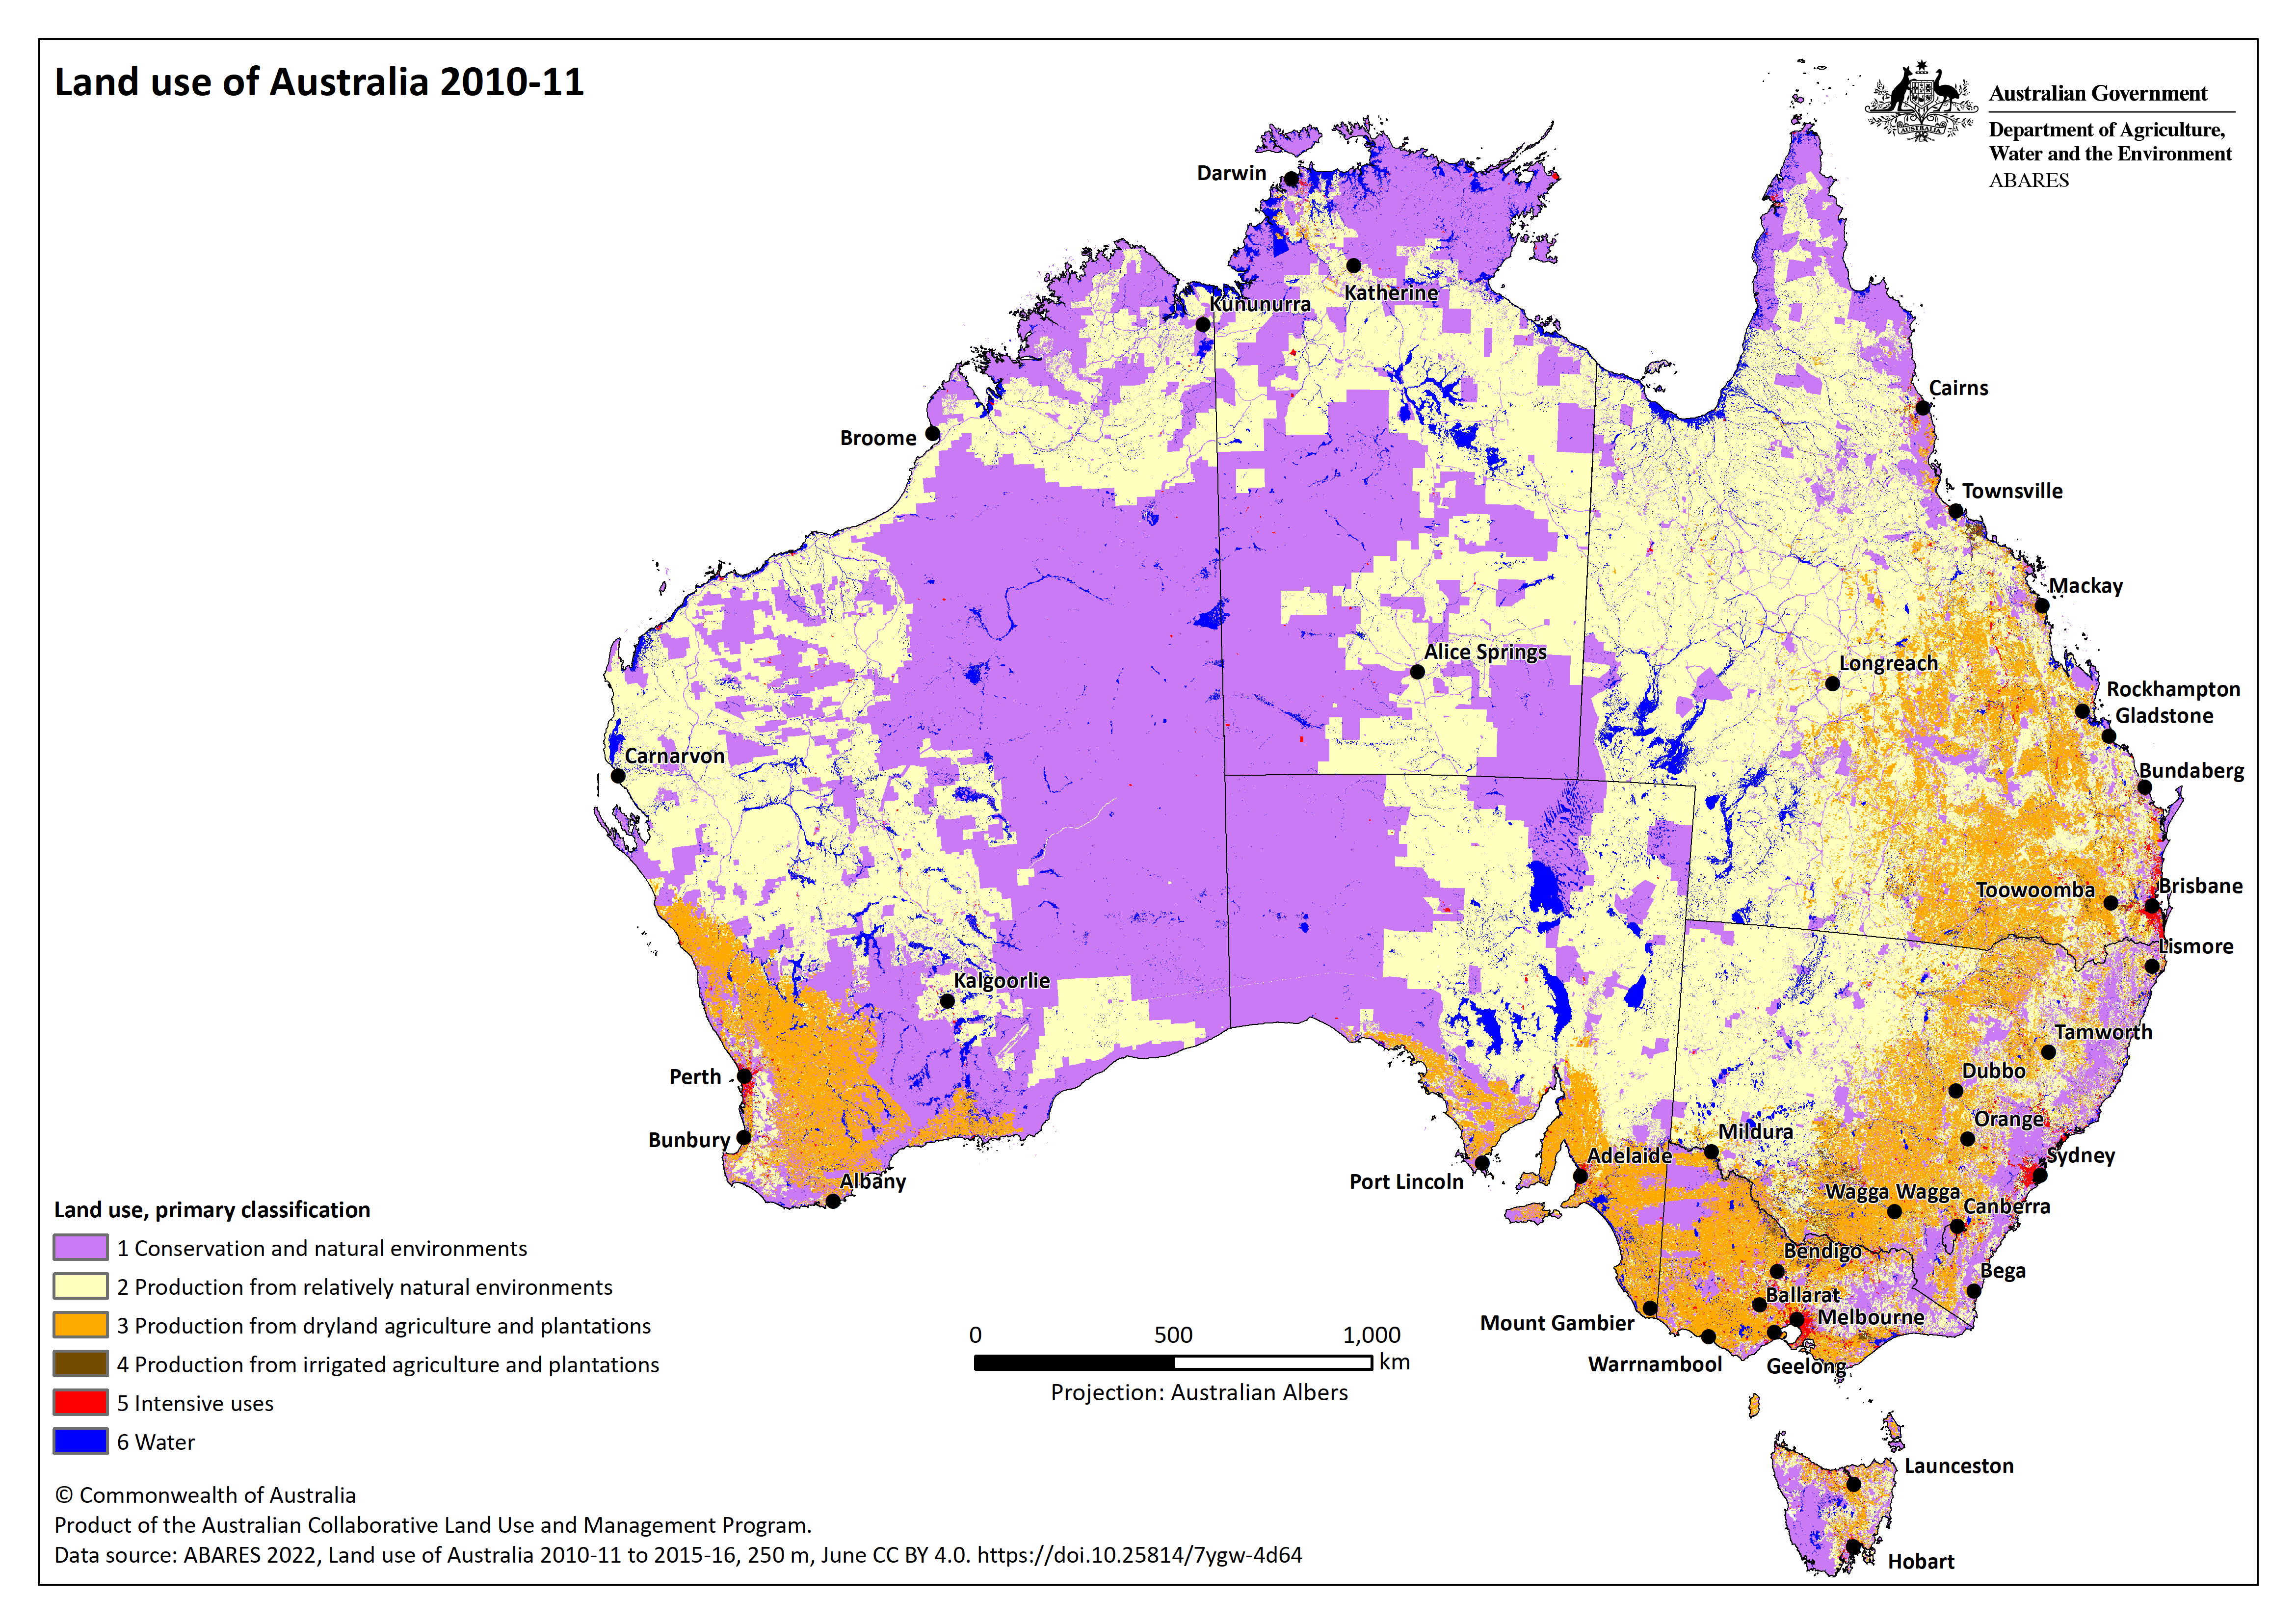
- Land use based on ALUM primary classification – PNG PDF
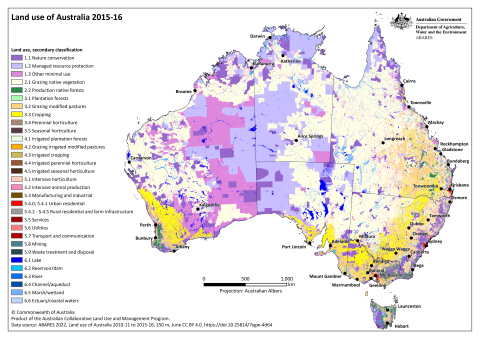
- Land use based on ALUM secondary classification – PNG PDF
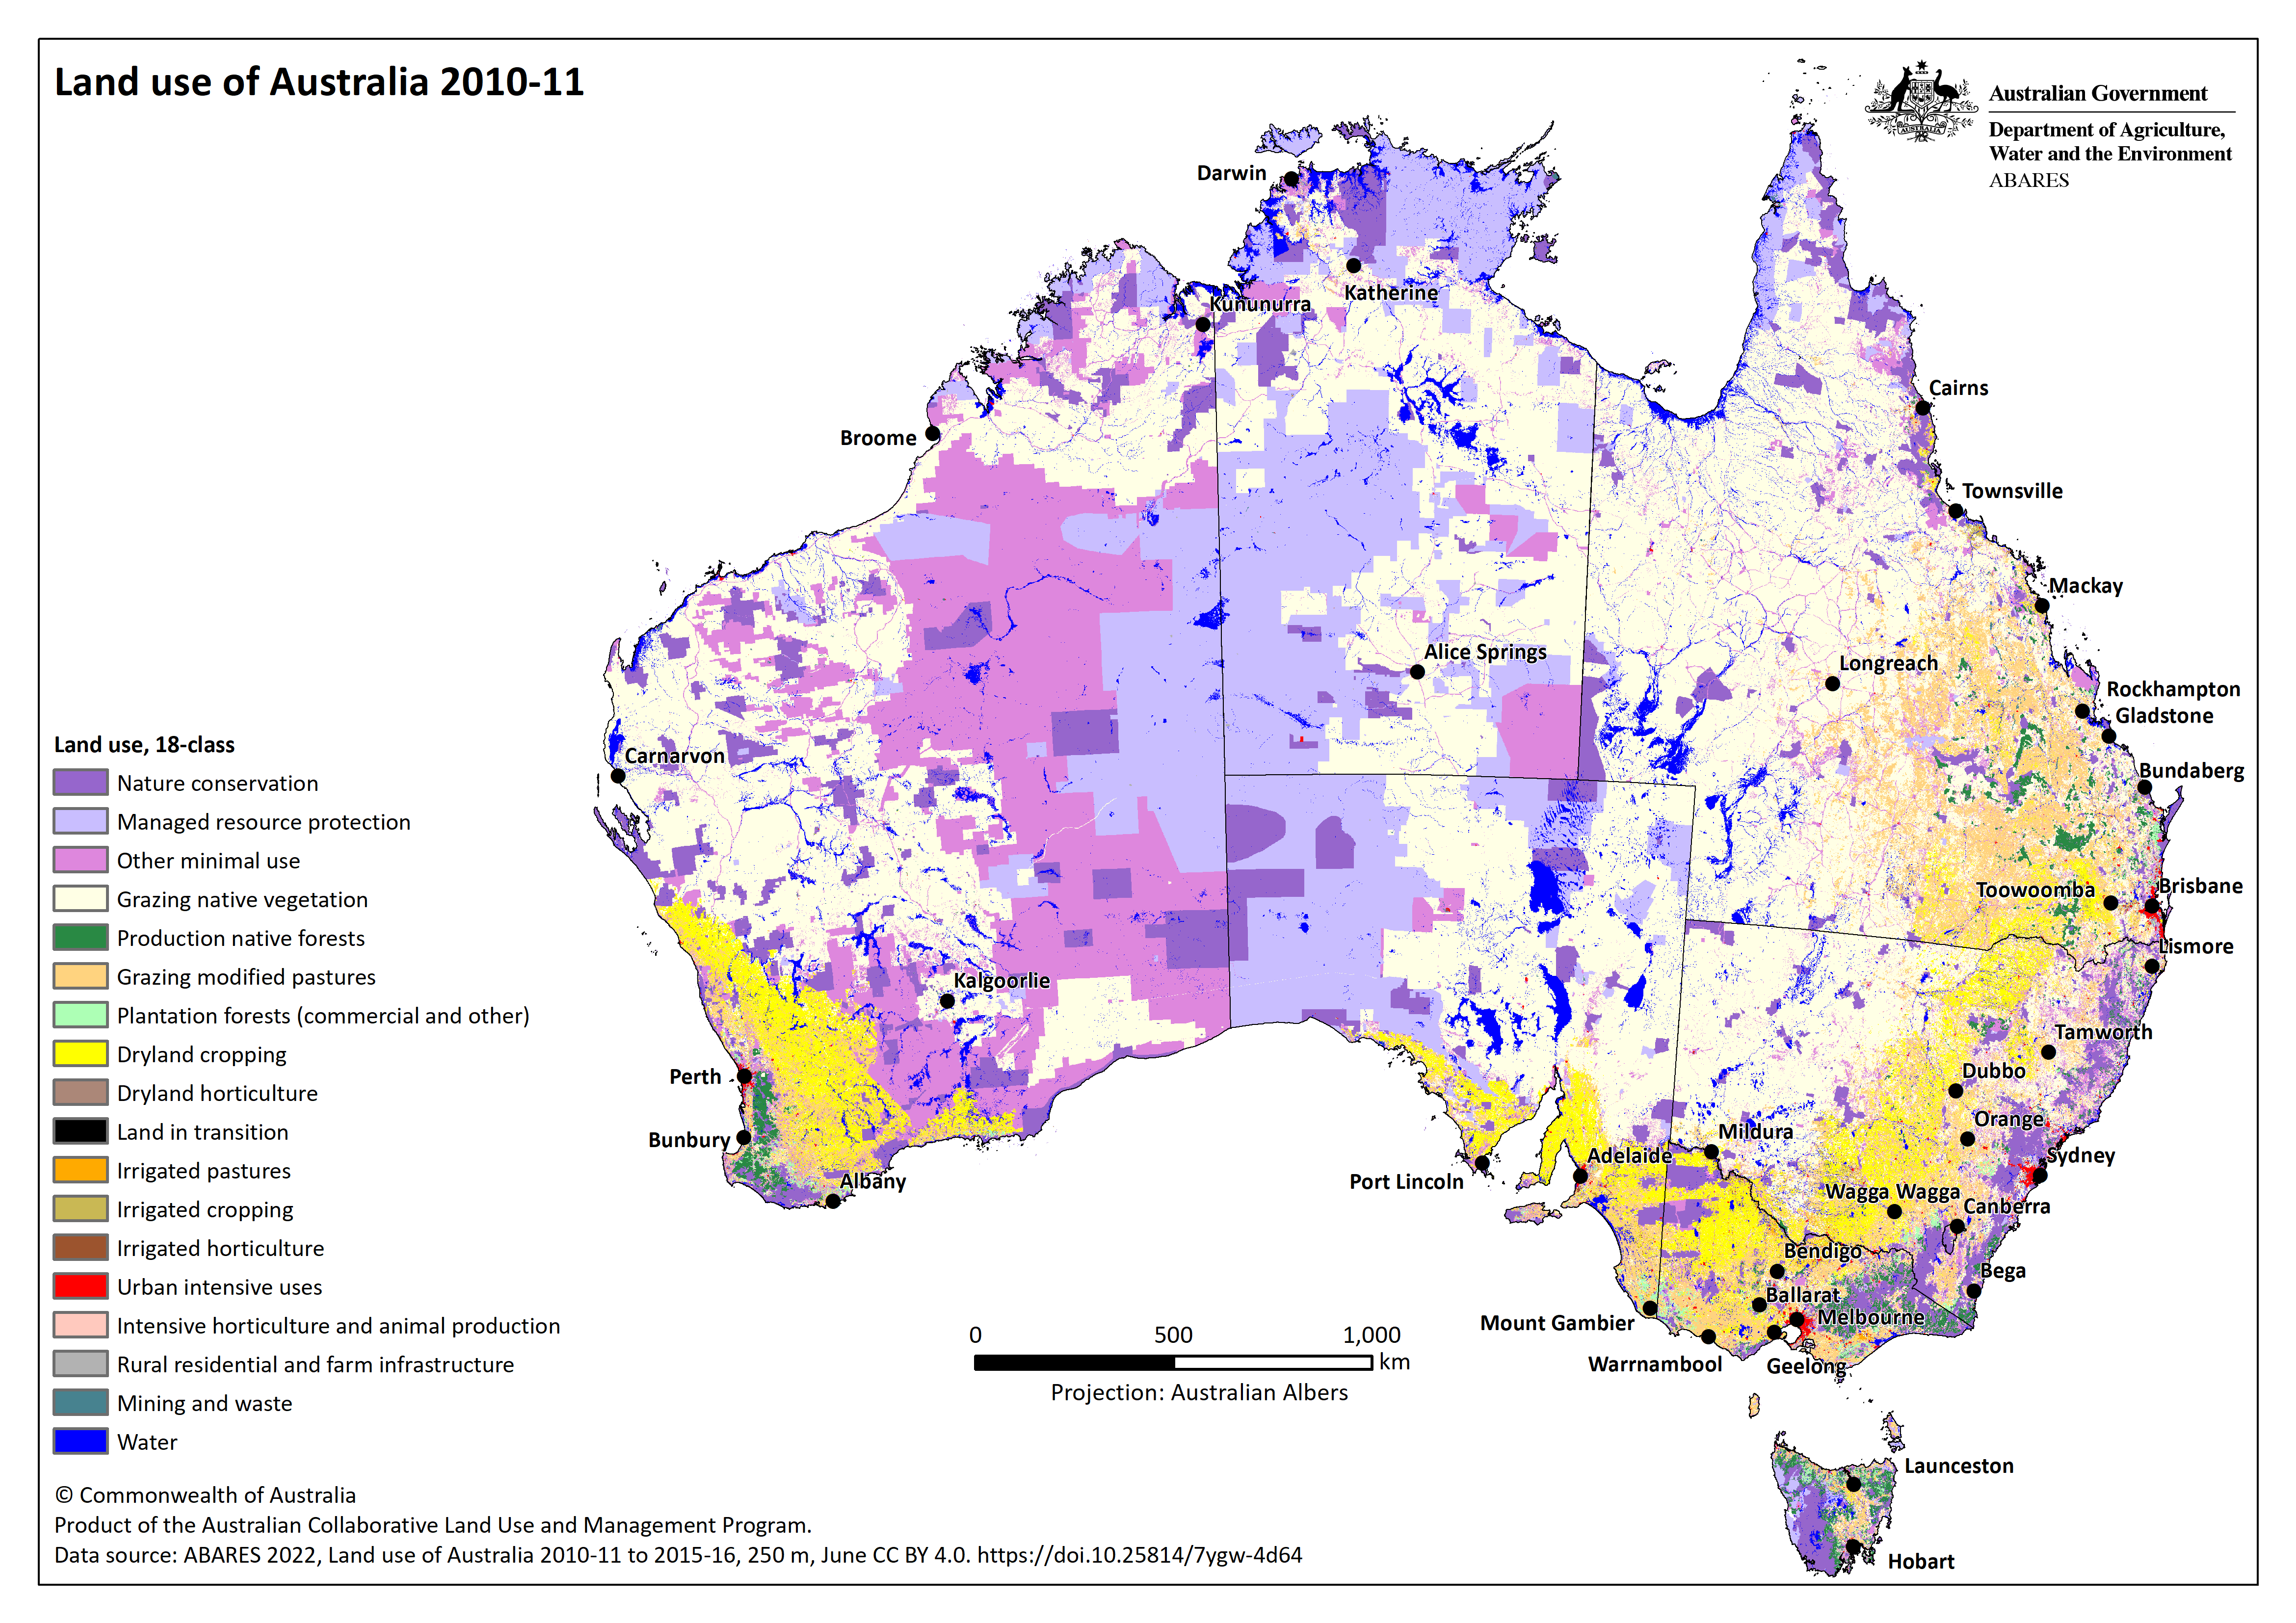
- Land use based on summary 18-class classification – PNG PDF
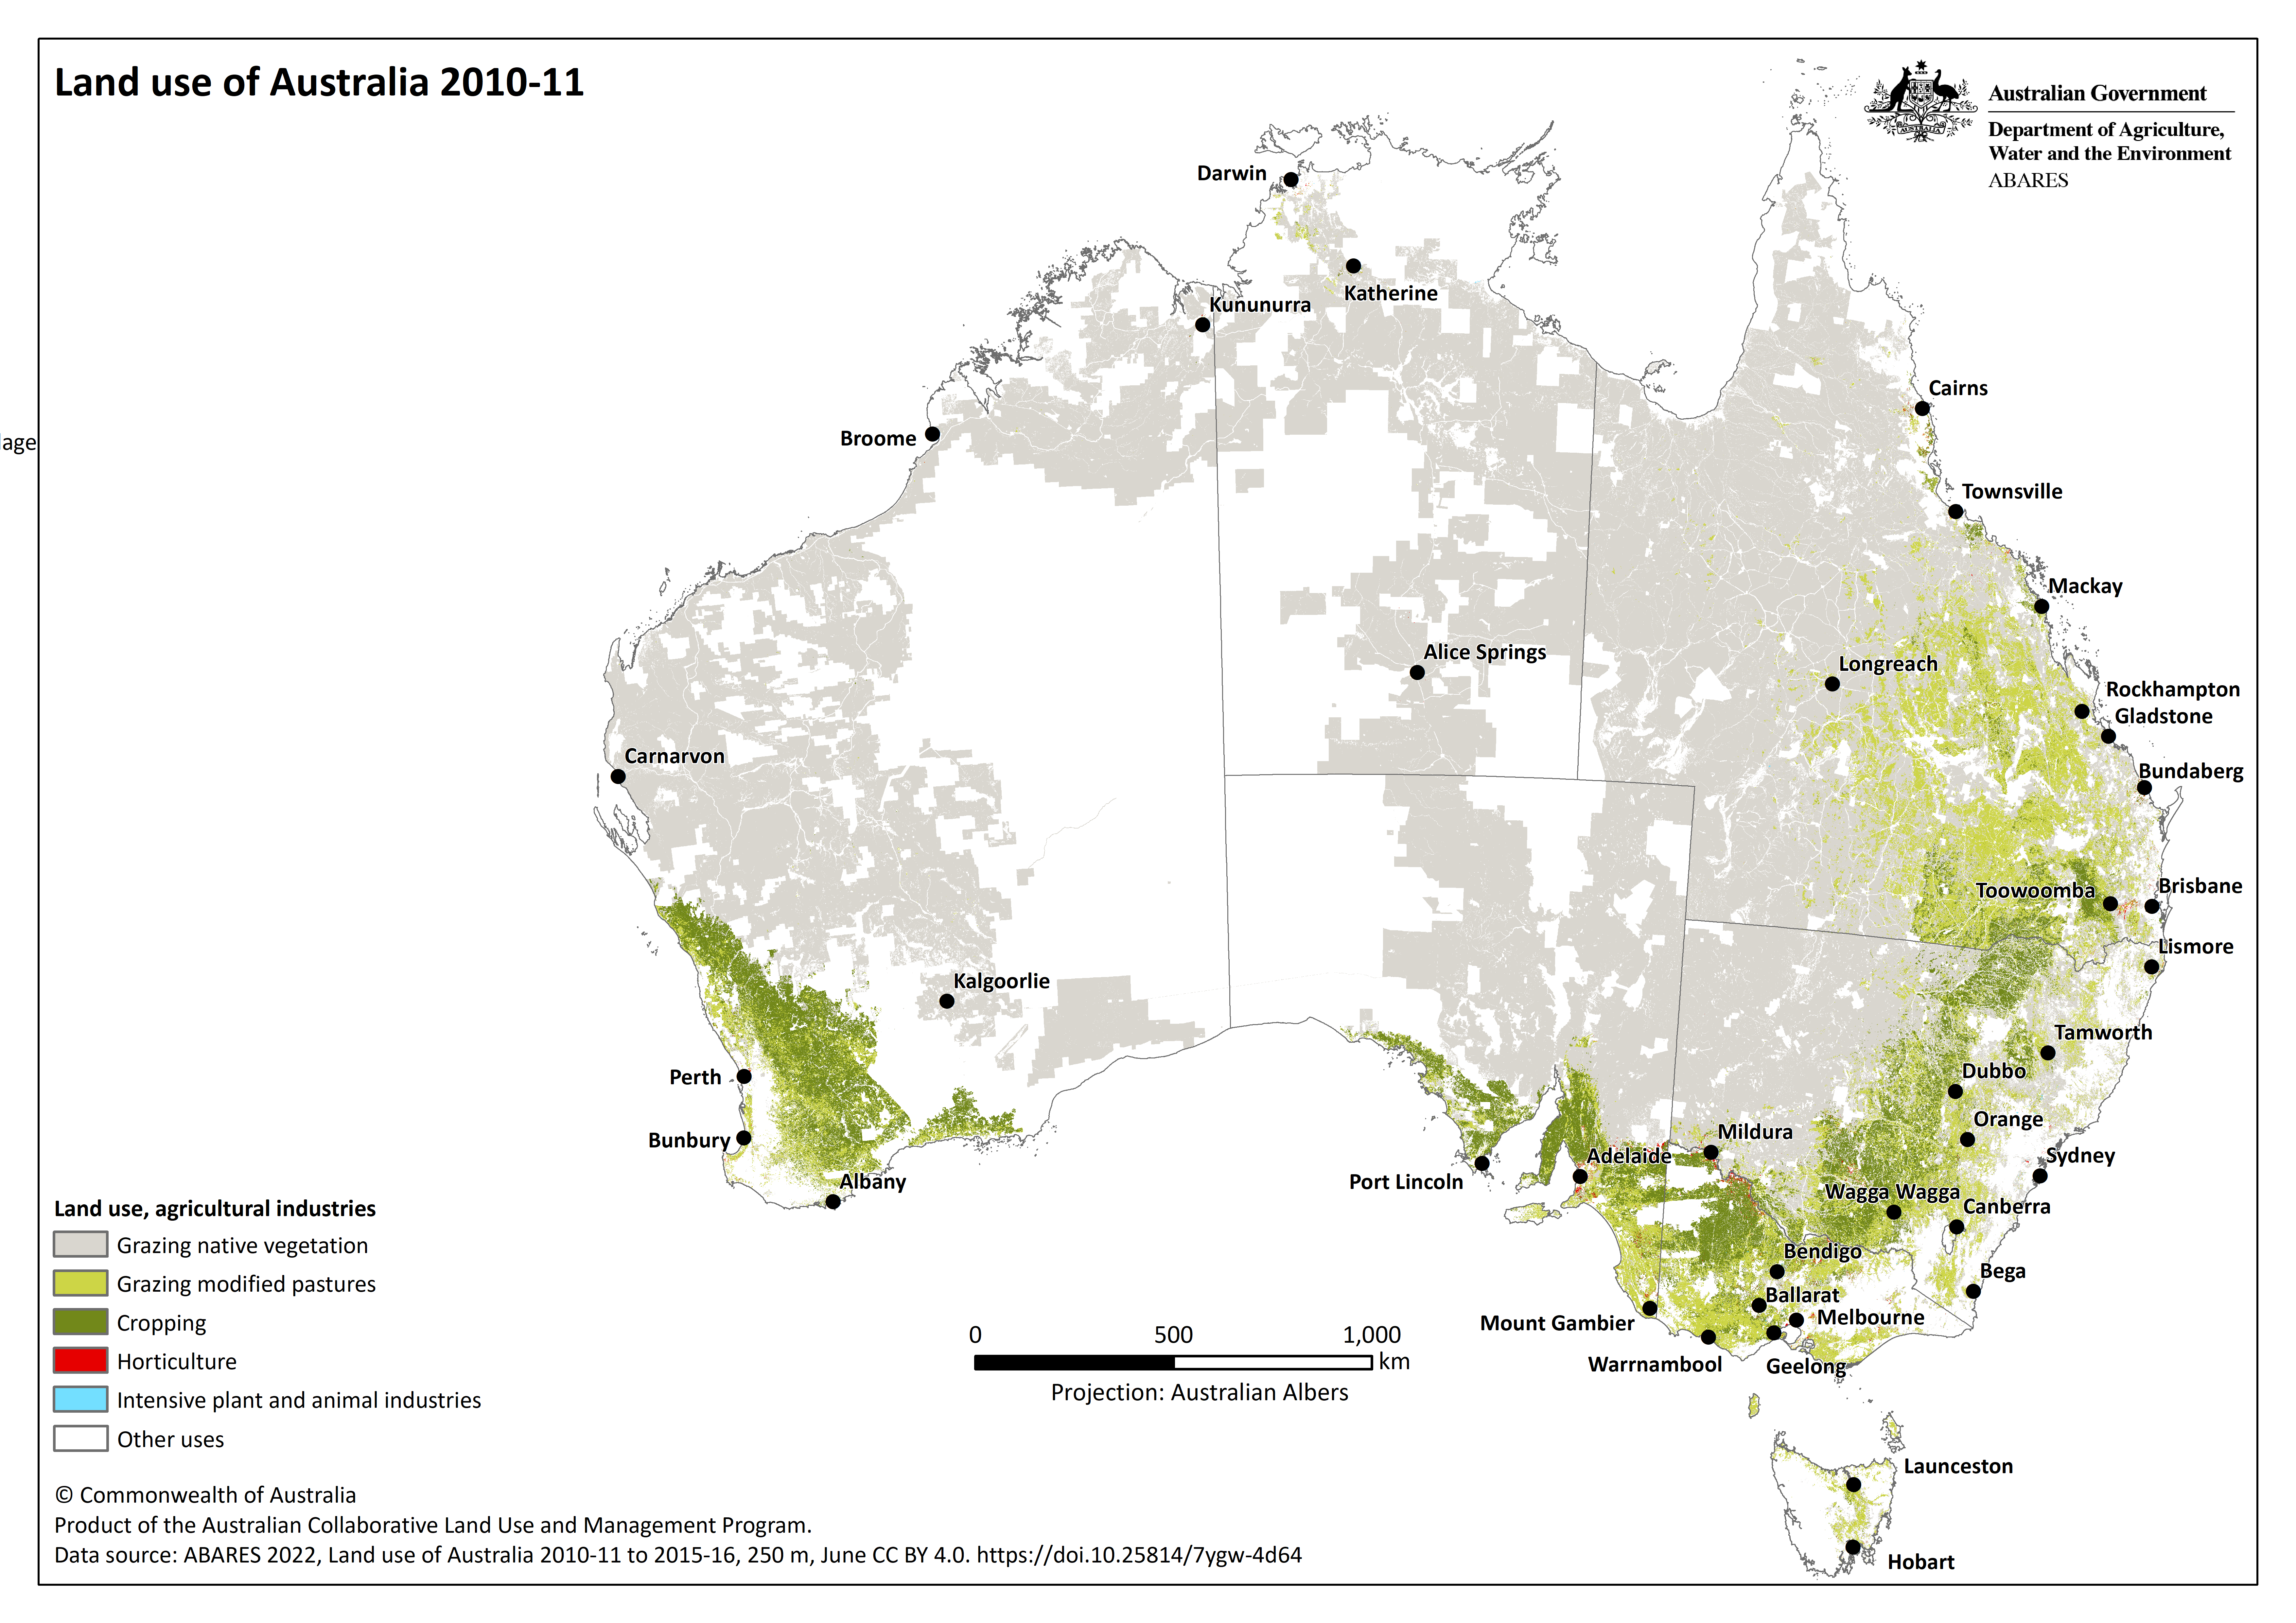
- Land use based on agricultural industries – PNG PDF
- Land use based on agricultural commodities – PNG PDF
Land use of Australia 2015–16
- Land use based on ALUM primary classification – PNG PDF
- Land use based on ALUM secondary classification – PNG PDF
- Land use based on summary 18-class classification – PNG PDF
- Land use based on agricultural industries – PNG PDF
- Land use based on agricultural commodities – PNG PDF
Land use of Australia – Land use change from 2010–11 to 2015–16, 18-class classification – PNG
Analysis
The National Land Account, Experimental Estimates provide a physical account and change matrix for land use for Australia and for each state and territory.
Interactive views
Land use of Australia Web Services