This is Supporting information for 1.1a.i Forest area by type, published December 2023.
1.1a.i Forest area by type is one of four parts of Indicator 1.1a Area of forest by forest type and tenure.
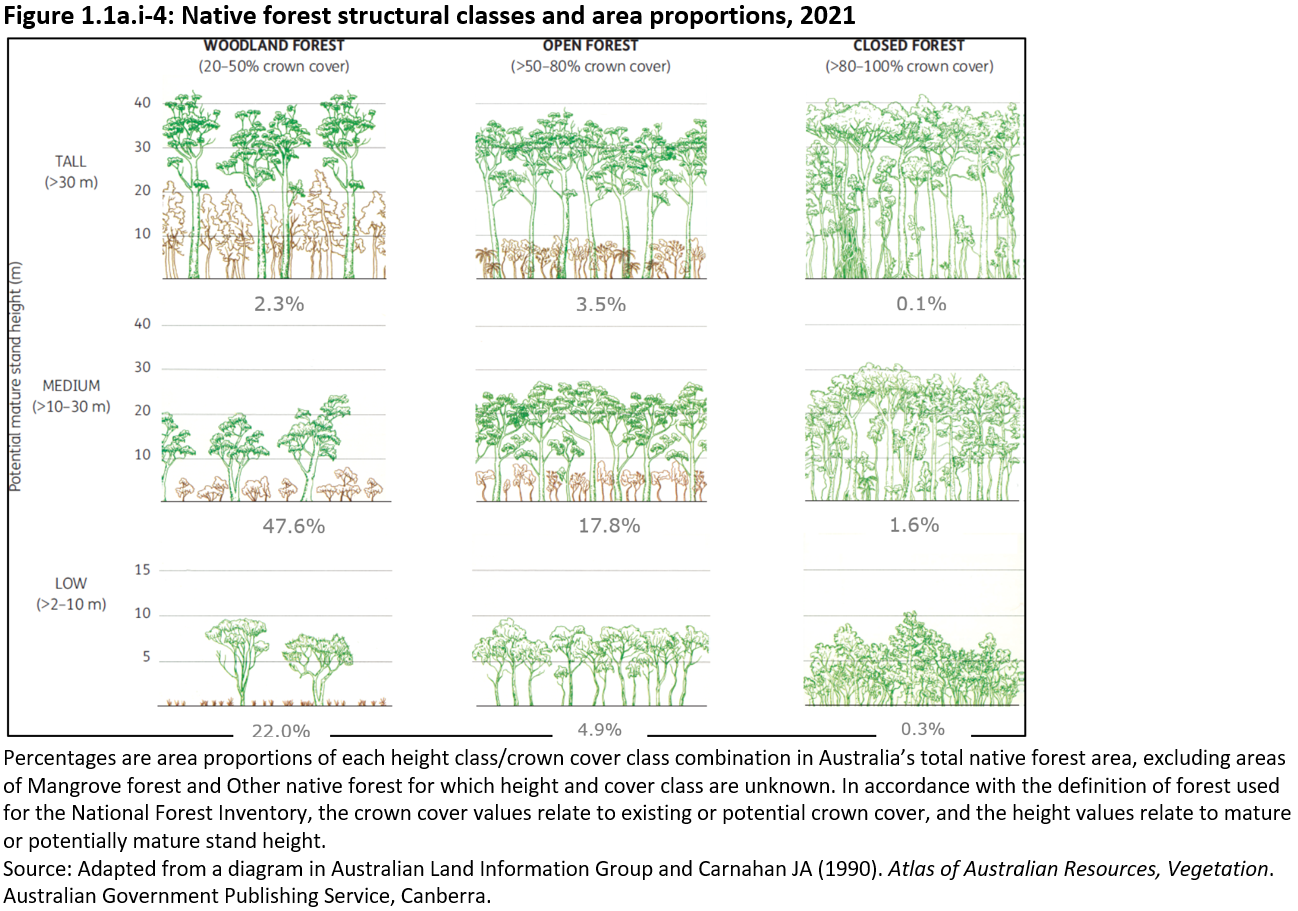
Australia’s native forests are classified into nine structural classes (Figure 1.1a.i-4). The classification is based on:
- three crown cover classes:
- Woodland forest, crown cover 20–50%
- Open forest, crown cover >50–80%
- Closed forest, crown cover >80–100%
- three stand height classes:
- Low, height >2–10 metres
- Medium, height >10–30 metres
- Tall, height >30 metres.
These structural classes and their area proportions in native forest are shown in Figure 1.1a.i-4 (figures exclude the areas of Mangrove forest and Other native forest for which the height and/or cover class are unknown). Nationally, medium woodland forest is the most common native forest structural class (62 million hectares, 48% of total native forest area), followed by low woodland forest (28 million hectares, 22%). At 0.11 million hectares, tall closed forest has the smallest area proportion (0.1%).
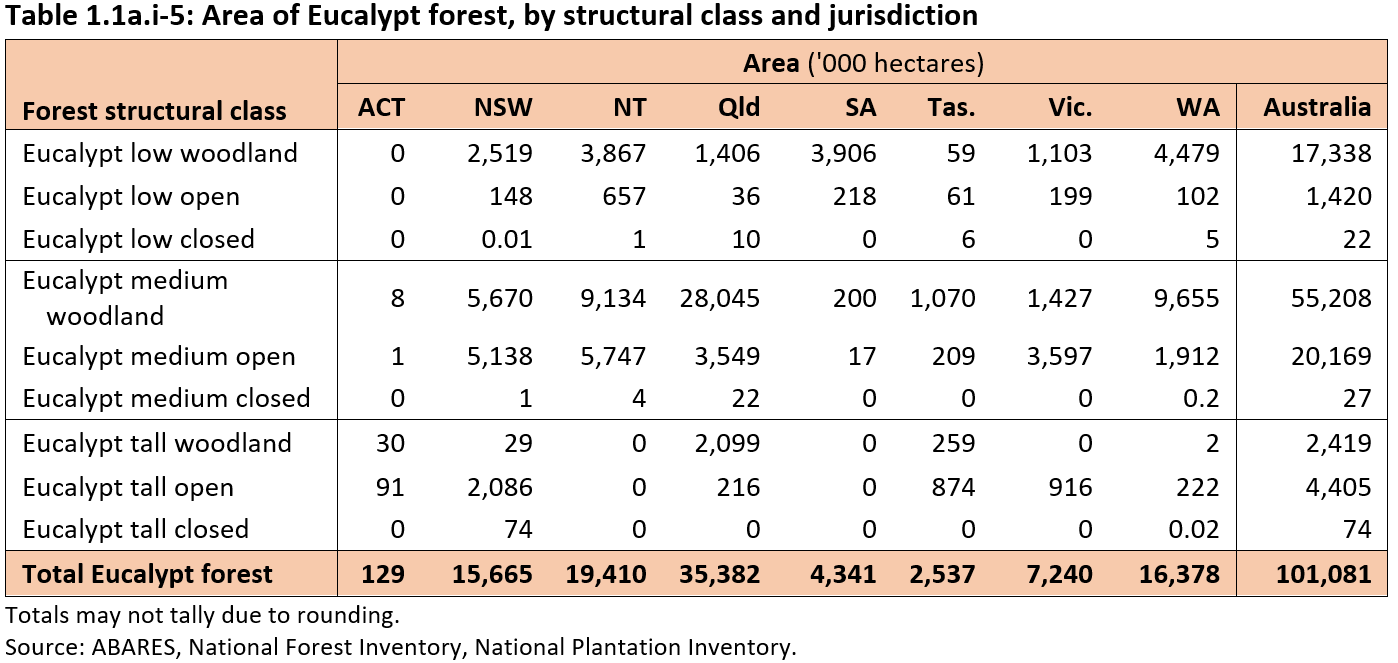
The area of the Eucalypt forest type by height and cover classes is shown in Table 1.1a.i-5. Native forest type and crown cover are reasonably well measured across Australia, but only limited forest height information is collected outside forests in which wood is harvested.
Click here for a Microsoft Excel workbook of the data for Table 1.1a.i-5.
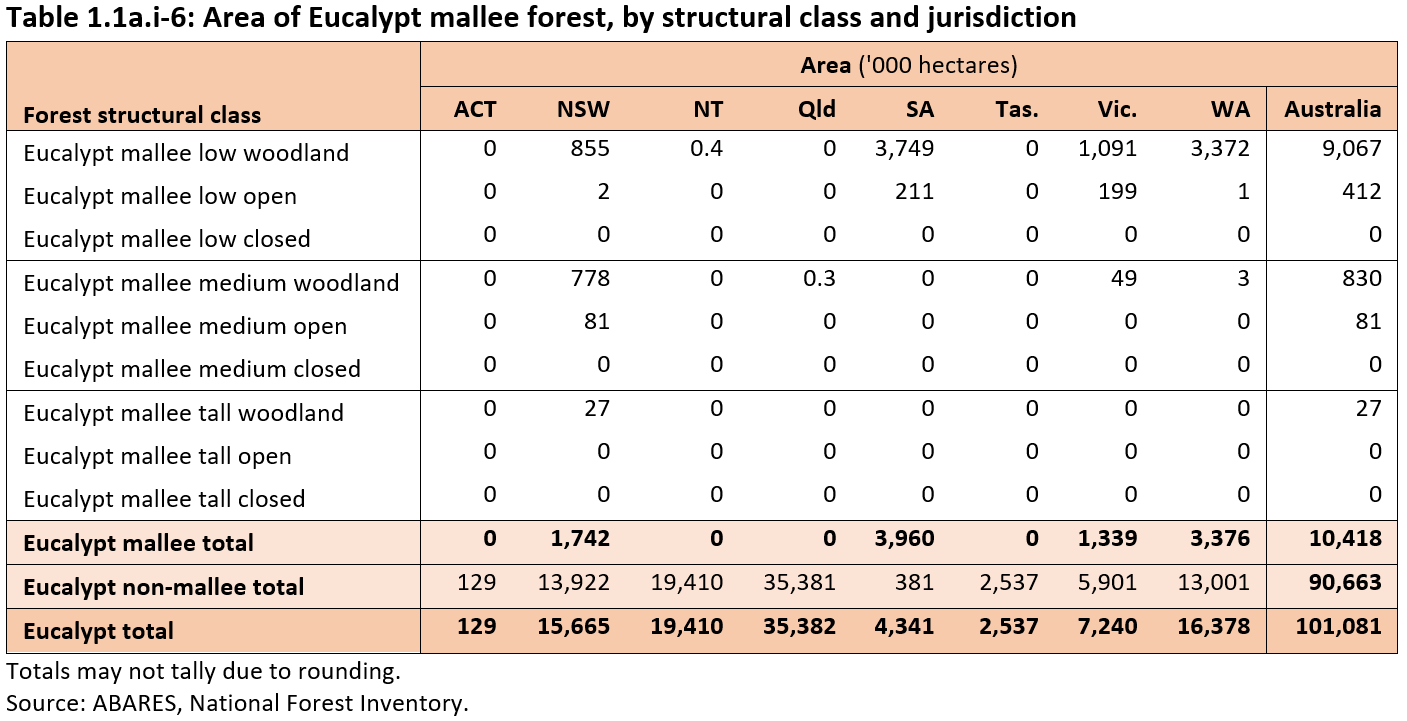
Eucalypt mallee forest also is separated as a distinct subtype within the Eucalypt forest type. The majority of Eucalypt mallee forest (9.1 million hectares, 87%) is low woodland, and is found predominantly in South Australia and Western Australia (see Table 1.1a.i-6).
Click here for a Microsoft Excel workbook of the data for Table 1.1a.i-6.
A Multiple Lines of Evidence (MLE) process was used by ABARES to examine and combine forest cover data from multiple sources to produce the Forests of Australia (2023) spatial dataset. Appropriate independent datasets were intersected using analytical spatial (GIS) software, to identify areas where datasets agree on the allocation of land as forest or on the allocation of land as non-forest. For areas for which the datasets disagree, allocation as forest or non-forest is made through an assessment of the accuracy and/or currency of individual datasets, through using ancillary data from the National Vegetation Information System (NVIS), and through validation with recent high-resolution aerial and satellite imagery. Validation also involves input from and checking by the relevant state and territory agencies. The product is a forest/non-forest binary raster (grid) at 100 metre resolution (each cell or pixel thus being 1 hectare in area).
Input datasets for the MLE process included forest cover data sourced from relevant state or territory agencies, forest cover data from other national programs such as the National Greenhouse Accounts, which produces the National Greenhouse Gas Inventory (NGGI), and the forest cover dataset Forests of Australia (2018) developed for reporting in Australia’s State of the Forests Report 2018 (Table 1.1a.i-7). The datasets all have different data dates, and the data date of the combined Forests of Australia (2023) dataset is taken as 2021. The publication date for this update is 2023.
| Dataset | Description |
| Forests of Australia (2018) | Forests of Australia (2018) is the forest extent dataset that was used in Australia’s State of the Forests Report 2018. It is a continental dataset of forest extent by national forest categories and types, and was developed by a Multiple Lines of Evidence process from multiple forest, vegetation and land cover spatial data inputs, including contributions from relevant Australian, state and territory government agencies and external sources. |
| State-wide Land and Tree Study (SLATS) Woody Extent (2018) - Queensland. Also known as Queensland Foliage Projective Cover (FPC) (2018). | The Queensland government SLATS method calculates Foliage Projective Cover (FPC) values from Sentinel-2 satellite images (and before 2018 used Landsat satellite Thematic Mapper™ and Enhanced Thematic Mapper Plus (ETM+) images). ABARES used an empirically derived relationship between FPC and crown-cover values (Scarth et al. 2008) to delineate the landscape into forest and non-forest areas (an FPC of 11% is approximately equivalent to a crown cover of 20%). The Sentinel-2 dataset is produced at 10 m × 10 m resolution, and is supported by on-ground validation. The dataset covers the whole of Queensland, and was developed to support land-clearance legislation and monitoring of change. |
| National Greenhouse Gas Inventory (2016 – 2020) | The National Greenhouse Gas Inventory (NGGI) dataset is produced from Landsat satellite Thematic Mapper™, Enhanced Thematic Mapper Plus (ETM+) and Operational Land Image images for the Australian Government Department of the Climate Change, Energy, the Environment and Water (DCCEEW), and identifies woody vegetation of height or potential height greater than 2 metres, crown cover greater than 20%, and with a minimum patch size of 0.2 hectares. The dataset is compiled using time-series data since 1972, and is produced at a 25 m × 25 m resolution. The NGGI dataset used was developed by combining five annual layers (2016-2020, inclusive) from the National forest and sparse woody vegetation data (Version 5.0) (DISER 2021) spatial dataset produced using the algorithms for land-use change allocation developed for the National Inventory Reports (DISER 2020). The original 25 m resolution, three-class (forest, sparse woody and non-forest) dataset was resampled to a binary (forest and non-forest) 100 m raster by classifying as forest the 100 m pixels that had more than half their area as forest; the sparse woody and non-forest classes were combined into a non-forest class. |
| NSW H_Woody_Fuzzy_2_Class | This dataset was developed to support New South Wales Natural Resources Commission’s (NRC) Monitoring, Evaluation and Reporting Program and is based on the NGGI dataset produced by DCCEEW from Landsat data. NRC applied Fuzzy Logic and Probability modelling to the NGGI dataset to derive annual layers distinguishing between forest and non-forest at 25 m raster resolution. Each of five annual layers, 2015-2019, was resampled to a 100 m raster by classifying as forest the 100 m pixels that had more than half their area as forest as determined from 25 m pixels. The five annual layers were combined and every pixel in the combination that had been classified as forest in any year during 2015-2019 period was allocated as forest (and the balance non-forest). This approach was taken to prevent areas where the crown cover had reduced below 20%, through events such as fire, harvesting, drought or disease, from being incorrectly classified as non-forest. |
| National Plantation Inventory 2020 spatial dataset | National Plantation Inventory (NPI) data as at 2020 were used to identify the area of Commercial plantations (Legg et al. 2021). The associated spatial vector dataset was converted to a raster format before being integrated with the Multiple Lines of Evidence forest cover raster dataset. |
| Qld 2016-17, 2017-18, and 2019 Land Clearing datasets | These annual datasets are produced by the Queensland government for the purposes of tracking vegetation clearing in the state, and were used by ABARES to identify and classify as non-forest cleared areas that would otherwise have been incorrectly mapped as forest in Forests of Australia (2023). |
| NSW 2017-18, 2018-19 and 2019-20 Woody vegetation clearing datasets | These annual datasets are produced by the New South Wales government for the purposes of tracking vegetation clearing in the state, and were used by ABARES to identify and classify as non-forest cleared areas that would otherwise have been incorrectly mapped as forest in Forests of Australia (2023). |
| Tasmania Forest Communities with NVIS Groups 2020 dataset | This statewide forest cover dataset was provided by the Tasmanian government for use in SOFR 2023. The vector (shapefile) dataset distinguishes between forest and non-forest polygons, with the forest polygons further attributed with relevant forest communities, including the dominant tree species. The dataset also includes attributes of vegetation community codes, source data and a National Vegetation Information System attribute that describes high-level forest structure. |
| Victorian Land Cover (2015-19) | The Victorian Department of Environment, Land, Water and Planning recommended allocating as forest the following cover types from the Victorian Land Cover (2015-19) dataset:
|
| Global Mangrove Watch (2018) | The Global Mangrove Watch dataset is based on ALOS PALSAR and Landsat imagery, and provides geospatial information about mangrove extent and changes. Geoscience Australia is a collaborator of the GMW project through the Digital Earth Australia project (Bunting et al. 2018; Thomas et al. 2017). |
| Land Use Mapping Project (LUMP) of the Northern Territory (2016 – 2022) | The LUMP dataset (DEPWS 2020) maps land use in the Northern Territory using the national classification scheme developed by the Australian Collaborative Land Use and Management Program (ACLUMP). The dataset was used to identify and map sandalwood plantations in Forests of Australia (2023). |
| National Vegetation Information System (NVIS) 6.0 (2020) | The NVIS dataset contains detailed vegetation descriptions in 6 hierarchal classes, Level 1-6, based on structural and floristic information including dominant genus, growth form, height and cover. Level 6 (VI) Sub-Association (sub-stratum) growth form, height and cover information was used to identify mapped areas that fulfilled the definition of forest (growth form = tree, potential height >= 2 m and potential crown cover = 20%). |
| Catchment Scale Land Use Mapping (CLUM) 2020 land-use mask | The CLUM dataset (ABARES 2020) was used as land-use mask to exclude from the Multiple Lines of Evidence forest cover dataset land uses deemed to be not suitable to carry forests, for example urban residential, industrial, mining, horticulture and intensive agriculture. |
| Google Earth Pro, Bing Maps and World Imagery by ESRI | The most recent high-resolution imagery from Google Earth Pro, Bing Maps and World Imagery by ESRI were used for validation of forest and non-forest allocation in areas where confidence in other datasets was low. |
Attribution of the Forests of Australia (2023) dataset
Each forest pixel (cell) in the Forests of Australia (2023) dataset was given a number of attributes, including for forest type, tenure, height and canopy cover (Table 1.1a.i-8).
| Parameter | Data sources (ordered by priority) | Notes |
| Forest type |
| A hierarchical approach was used to derive and allocate National Forest Inventory (NFI) forest types to the NFI 2021 forest cover dataset in the following order: 1. the NPI 2021 spatial dataset was used to allocate types to Commercial plantations 2. the NT LUMP 2016-2022 dataset was used to allocate sandalwood plantations in the Northern Territory to ‘Other forest’ 3. native forest types were then allocated:
4. where forest types could not be allocated from the above sources, forest types used in Forests of Australia (2018) were allocated 5. any remaining native forest areas not allocated a forest type were allocated as “Other native forest”. Planted forest areas not allocated a type were allocated as “Other forest”. |
| Forest tenure |
| The process to allocate tenure categories to the NFI 2021 dataset used a combination of national tenure information from PSMA, and data from all jurisdictions. Data sources used for each jurisdiction were prioritised based on the assessed accuracy of each dataset. |
| Forest height and cover |
|
NFI, National Forest Inventory; NPI, National Plantation Inventory; NVIS, National Vegetation Information System; PSMA, PSMA Australia Ltd (now trading as Geoscape Australia).
This section outlines methodological reasons why the forest areas reported in this 2023 update of the forest area for Australia’s State of the Forests Report (SOFR) differ from the forest areas reported in Australia’s State of the Forests Report 2018. The areas reported in this 2023 update of forest area are drawn from the Forests of Australia (2023) dataset, whereas the areas reported in Australia’s State of the Forests Report 2018 were drawn from the Forests of Australia (2018) dataset. Regular methodological updates mean that differences in reported areas between successive SOFRs do not necessarily reflect actual, on-ground change in forest area. Measurement of the actual, on-ground change in forest area over time uses a different approach (see Indicator 1.1a.iv – Forest area change over time).
Continual improvement in measuring the extent of Australia's forests, and in the reporting of forest area, has occurred since national figures were first reported in 1974 (Forwood 1975). Australia's reported forest area has fluctuated between 105 million hectares and 164 million hectares since that date, but these historic fluctuations in reported areas did not represent actual changes in on-ground forest cover. Instead, they were generally due to a combination of:
- changes in the area basis reported (from only commercial forests to all forests)
- changes prior to 1998 in the definition of forest
- variability in state and territory data
- correction of mapping errors
- the progressive incorporation of a variety of remotely sensed datasets, and
- recent validation with high-resolution aerial and satellite imagery.
Australia's total forest area of 133.6 million hectares calculated as at 2021 from the Forests of Australia (2023) dataset, and reported in this 2023 update of forest area, differs by only 0.4% from the total forest area as at 2016 calculated from the Forests of Australia (2018) dataset and reported in SOFR 2018. The small difference, and the larger differences in the detailed mapping that underpins it, mostly reflect the incorporation of new and updated data provided by states and territories, delivered as a result of technological advances. A greater coverage of recent, high-resolution imagery for validation also facilitated the reclassification of some areas from forest to non-forest, and other areas from non-forest to forest.
Differences in forest area
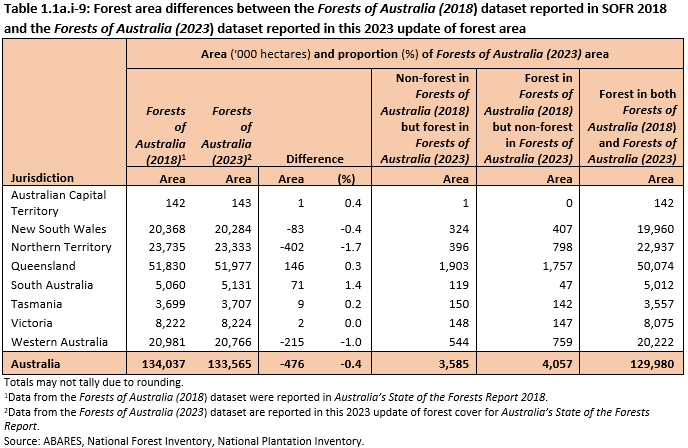
Australia's total forest area calculated from the Forests of Australia (2023) dataset and reported in this 2023 update of forest area is 133.6 million hectares. This is 476 thousand hectares (0.4%) less than the forest area calculated from the Forests of Australia (2018) dataset and reported in SOFR 2018 (Table 1.1a.i-9). This net decrease is the sum of
- 3.58 million hectares now identified as forest that was identified as non-forest in the Forests of Australia (2018) dataset, and
- 4.06 million hectares that was identified as forest in the Forests of Australia (2018) dataset but that is now identified as non-forest in the Forests of Australia (2023) dataset.
Most of these differences do not reflect actual, on-ground changes of forest area, but instead reflect improved data accuracy and improved coverage of the high-resolution aerial and satellite imagery used for validation.
The area identified as forest in the Forests of Australia (2023) dataset is smaller than the area identified as forest in the Forests of Australia (2018) dataset in the Northern Territory (402 thousand hectares, 1.7% of the jurisdiction’s forest area) and Western Australia (215 thousand hectares, 1.0%), and is larger than the area identified as forest in the Forests of Australia (2018) dataset in Queensland (146 thousand hectares, 0.3%) and South Australia (71 thousand hectares, 1.4%).
Click here for a Microsoft Excel workbook of the data for Table 1.1a-9.
Nationally, the area identified consistently as forest, that is, in both the Forests of Australia (2018) dataset and the Forests of Australia (2023) dataset, was 130 million hectares (97% of the total forest area in either dataset). Furthermore, in all jurisdictions, at least 96% of the area identified as forest in the Forests of Australia (2023) dataset has also been identified as forest in the Forests of Australia (2018) dataset. These results give a high level of confidence in the areas classified as forest by the Multiple Lines of Evidence (MLE) process, and demonstrate the improved consistency that the MLE methodology has brought to the mapping of Australia’s forest extent.
The largest area identified as forest in the Forests of Australia (2023) dataset that was identified as non-forest in the Forests of Australia (2018) dataset is in Queensland (1.9 million hectares). The largest area identified as non-forest in the Forests of Australia (2023) dataset that was identified as forest in the Forests of Australia (2018) dataset is also in Queensland (1.8 million hectares). These changes result from the Queensland Statewide Landcover and Trees Study (SLATS) process using Sentinel 2 satellite data at 10 m resolution instead of Landsat satellite data at 30 m resolution to derive Queensland’s Foliage Projective Cover (FPC) dataset, a key input into the Multiple Lines of Evidence (MLE) process; and from the use of 1 m resolution imagery from Earth-1 to restrict the SLATS coverage to areas with tree cover. Improved coverage of high-resolution imagery for validation (Google EarthPro, Bing Maps and ESRI World Imagery) and the new NVIS 6.0 dataset also enabled better classification in Queensland.
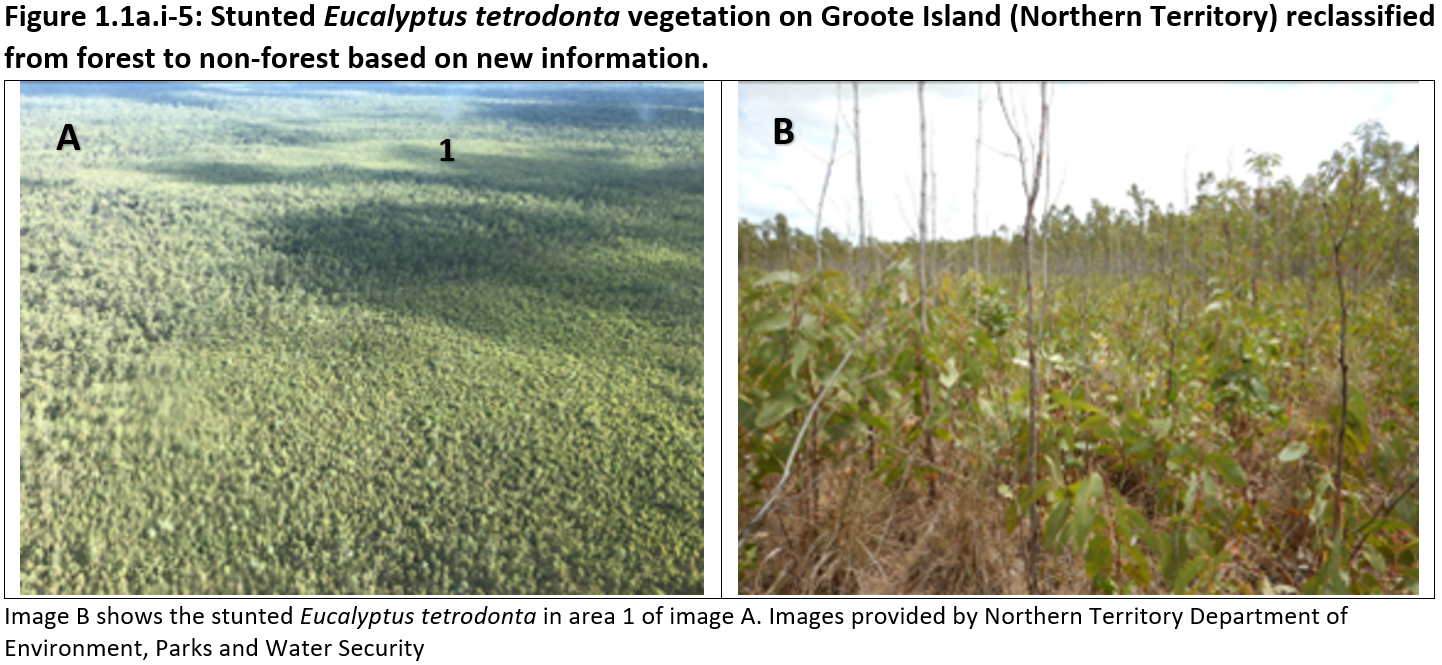
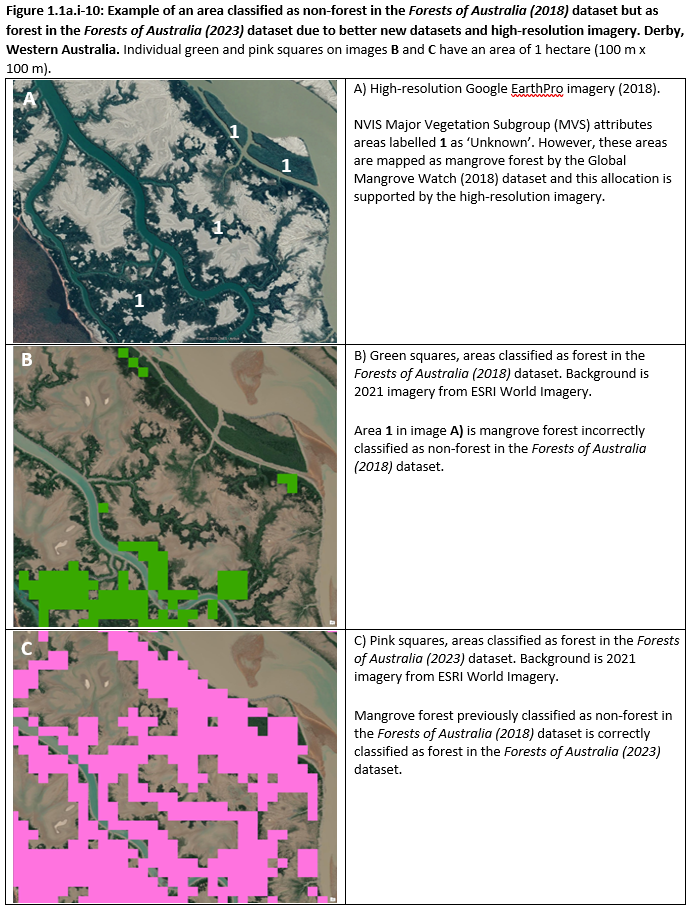
Classification changes, also driven by new data, exist in other jurisdictions, notably Western Australia and the Northern Territory. In both these jurisdictions, the new Global Mangrove Watch (2018) dataset identified mangrove forest not previously identified. Other validation by these jurisdictions enabled identification of non-forest areas incorrectly identified as forest in the Forests of Australia (2018) dataset. The Northern Territory Department of Environment, Parks and Water Security provided an unpublished dataset with boundaries of treeless plains, which were used to reclassify as non-forest areas of shrublands and low open woodlands that were previously classified as forest (Figure 1.1a.i-5) (Emberg et al. 2023).
Significant revisions of the NVIS 5.1 dataset occurred between 2016 and 2019, with production of NVIS 6.0. This included reattribution of Major and Sub-Major Vegetation Groups in many areas across multiple states, and updates to the spatial boundaries of some NVIS polygons, which with improved coverage of high-resolution imagery for validation supported reclassification of many areas.
For the Forests of Australia (2018) dataset, the 2015 annual spatial layer of the National Greenhouse Gas Inventory (NGGI) dataset was used as an input into the MLE process. For the Forests of Australia (2023) dataset, five annual NGGI layers (2016 to 2020 inclusive) were combined to form a single input. This allowed retention of disturbed forest areas where canopy cover had temporarily reduced below 20%, and enabled identification of forest areas previously incorrectly identified as non-forest.
Woody vegetation clearing data for 2017-20 from the Statewide Landcover and Trees Study (SLATS) programs in Queensland and New South Wales was separated into areas of forest cleared by activities associated with a land-use change (e.g. urban development, pasture or mining), which were re-reclassified as non-forest, and areas where canopy cover loss was temporary (e.g. forest harvesting or thinning), which were retained as forest.
It was more difficult to identify areas classified as non-forest in the Forests of Australia (2018) dataset but that are now classified in the Forests of Australia (2023) dataset as forest due to regrowth or forest expansion. This is because transitions from non-forest to forest are generally gradual, whereas transitions from forest to non-forest are generally abrupt.
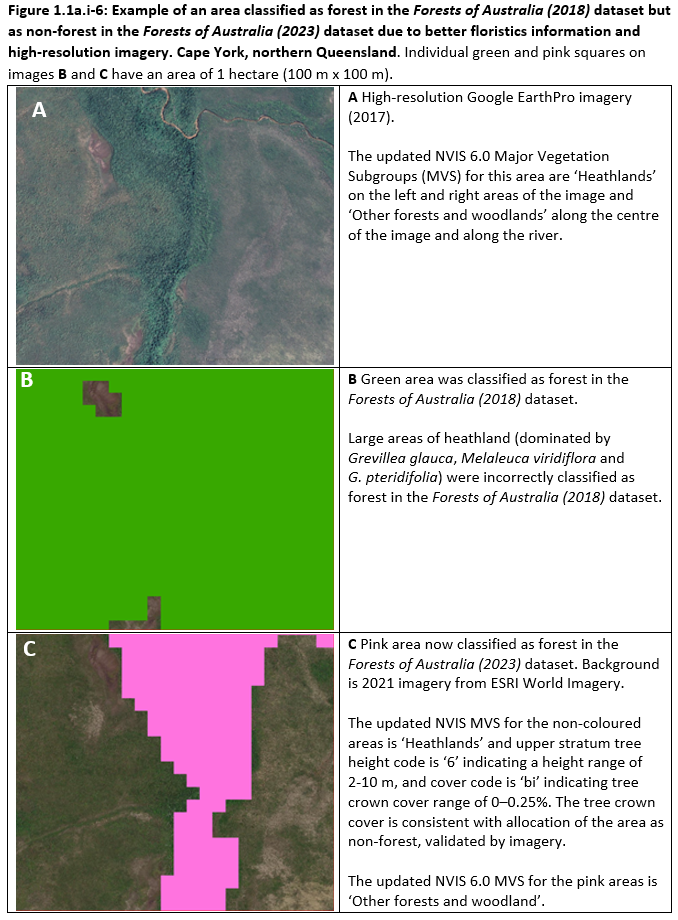
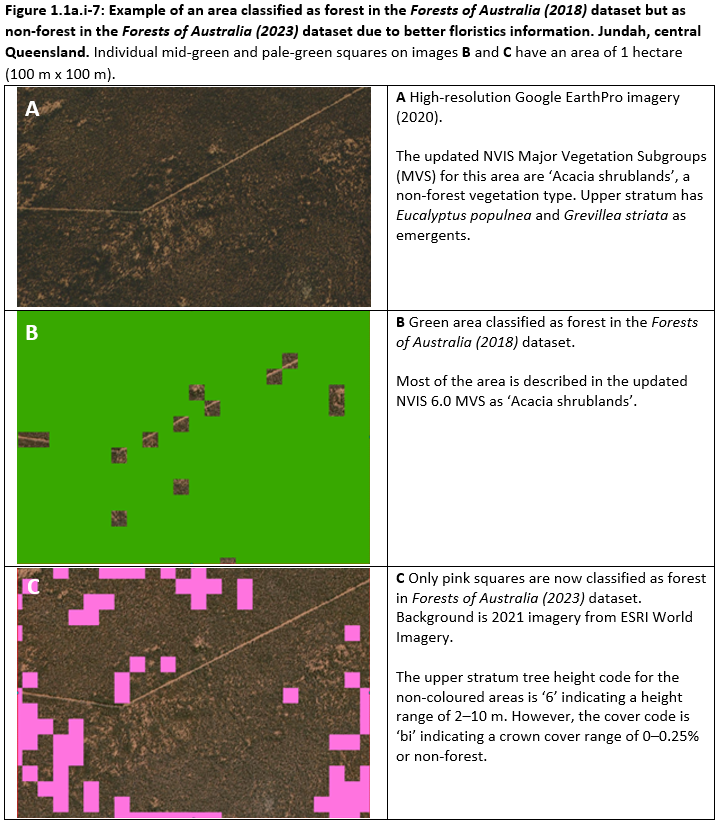
The examples provided in Figures 1.1a.i-6 and 1.1a.i-7 show areas classified as forest in the Forests of Australia (2018) dataset but reallocated as non-forest in the in the Forests of Australia (2023) dataset due to new data and improved coverage of high-resolution imagery for validation. They do not relate to actual on-ground change in forest cover.
Reallocation as non-forest of areas incorrectly classified as forest in the Forests of Australia (2018) dataset occurred for naturally treeless landscapes (heathlands, shrublands and grasslands) including: Grevillea heathlands on Cape York (Figure 1.1a.i-6); Acacia shrublands in central Queensland (Figure 1.1a.i-7); treeless plains of the Northern Territory (Figure 1.1a.i-5 above); and hummock grasslands on sandstone peninsulas in the King Leopold Ranges in Western Australia.
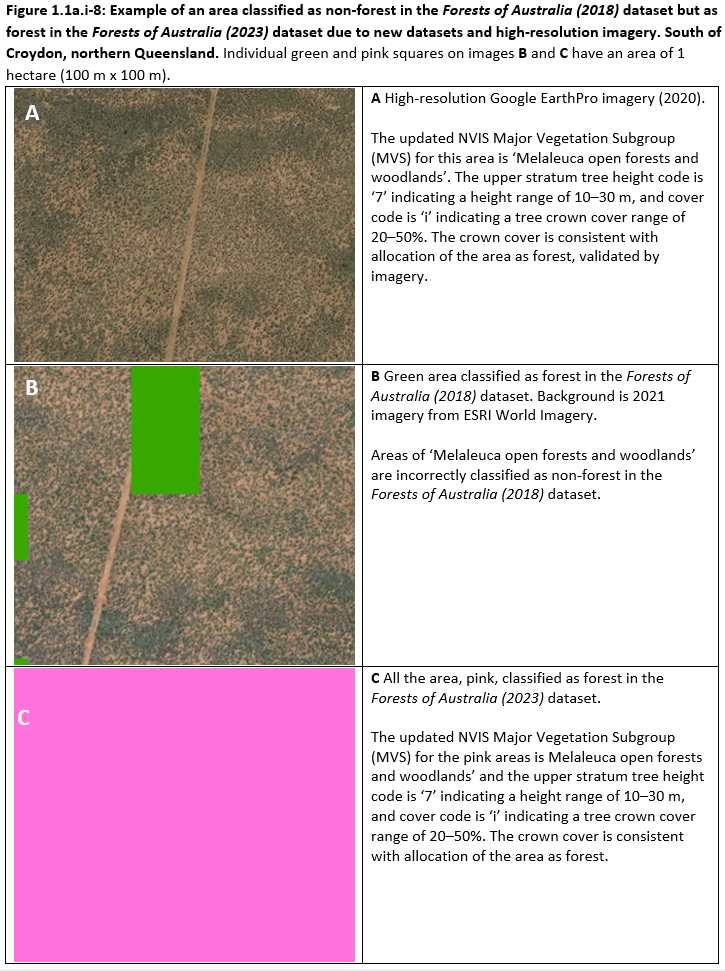
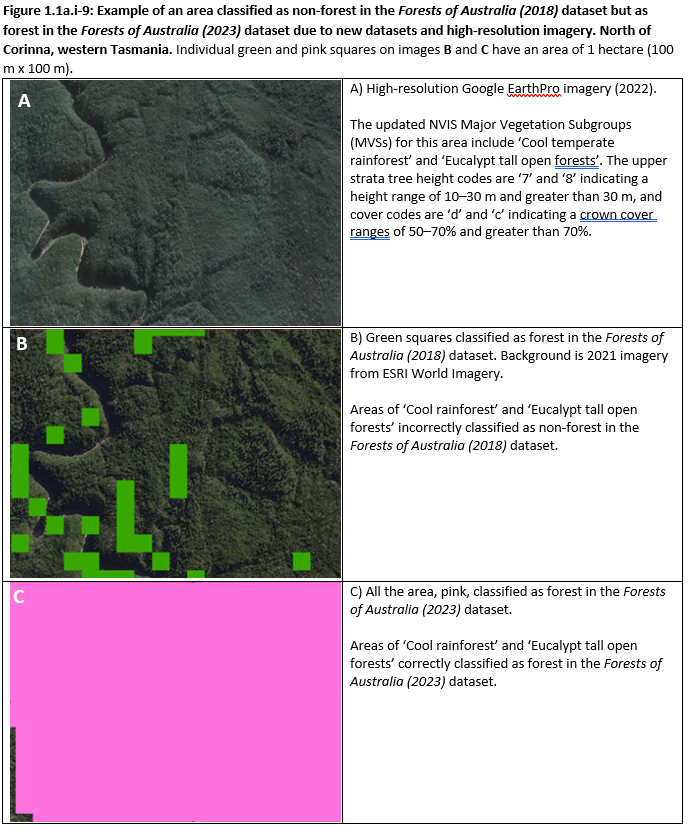
The examples provided in Figures 1.1a.i-8, 1.1a.i-9 and 1.1a.i-10 show areas classified as non-forest in the Forests of Australia (2018) dataset but reallocated as forest in the Forests of Australia (2023) dataset due to new data and improved coverage of high-resolution imagery for validation. They do not relate to actual on-ground change in forest cover.
The examples are from different ecosystems including woodland, rainforest and mangrove forests.
ABARES (2020). Catchment Scale Land Use of Australia – Update December 2020. Australian Bureau of Agriculture and Resource Economics and Sciences, Canberra CC By 4.0. doi.org/10.25814/aqjw-rq15
Australian Land Information Group and Carnahan JA (1990). Atlas of Australian Resources, Vegetation. Australian Government Publishing Service, Canberra.
Bunting P, Rosenqvist A, Lucas RM, Rebelo L-M, Hilarides L, Thomas N, Hardy A, Itoh T, Shimada M, Finlayson CM (2018). The Global Mangrove Watch—A New 2010 Global Baseline of Mangrove Extent, Remote Sensing, 10(10), 1669. doi.org/10.3390/rs10101669
Department of Environment, Parks and Water Security (DEPWS) (2020). Land Use Mapping Project of the Northern Territory, 2016 - 2022 (LUMP) - Dataset - NTG Open Data Portal. Northern Territory government, Darwin, CC By 4.0.
Department of Industry, Science, Energy and Resources (DISER) (2020). National Inventory Report 2020. Commonwealth of Australia, CCBY 4.0 dcceew.gov.au/climate-change/publications/national-inventory-report-2020
Department of Industry, Science, Energy and Resources (DISER) (2021). National forest and sparse woody vegetation data. Version 5.0. Commonwealth of Australia, Canberra CC BY 4.0 data.gov.au/data/dataset/national-forest-and-sparse-woody-vegetation-data-version-5-2020-release
Emberg J, Petursson J, May R (2023). Land Resources of Groote Eylandt (in prep).
Forwood (1975). Report on the forestry and wood-based industries development conference 1974. Australian Forestry Council, Canberra.
Legg P, Frakes I, Gavran M (2021). Australian plantation statistics and log availability report 2021. ABARES research report. doi.org/10.25814/xj7c-p829
Scarth P, Armston J, Danaher T (2008). On the relationship between crown cover, foliage projective cover and leaf area index. Proceedings of the 14th Australian Remote Sensing and Photogrammetry Conference, 29 September – 3 October 2008, Darwin.
Thomas N, Lucas R, Bunting P, Hardy A, Rosenqvist A, Simard M (2017). Distribution and drivers of global mangrove forest change, 1996–2010. PLoS ONE 12(6): e0179302. doi.org/10.1371/journal.pone.0179302
Further information
Click here for Key information on 1.1a.i Forest area by type:
- Defining forest, forest categories and forest types
- Forest area by jurisdiction and category
- Native forest area by type
- Native forest area by crown cover, height and form
- Area of Commercial plantations and Other forest

