
This indicator (Indicator 1.1a) uses the area for each forest type over time as a broad measure of the extent to which forest ecosystems and their diversity are being maintained. Reporting on forest tenure aids our understanding of how different land management regimes may impact on forest biodiversity.
This part of Indicator 1.1a Area of forest by forest type and tenure, published December 2023, presents the change in forest area over time.
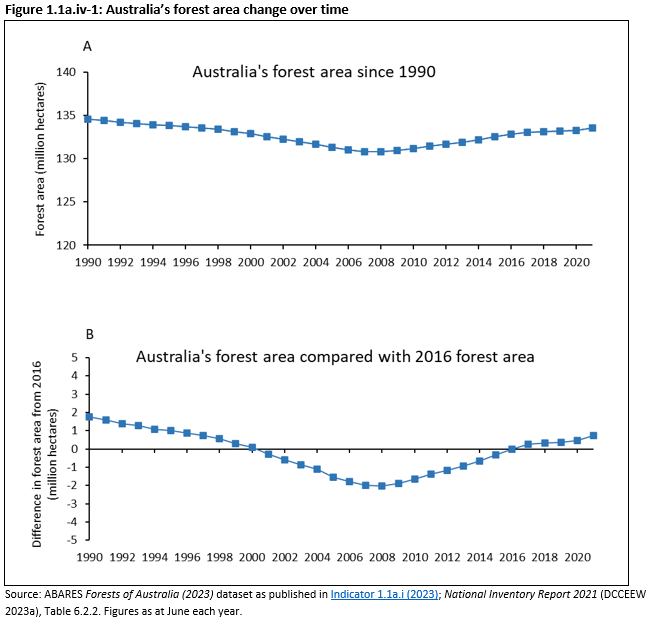
- Australia’s total forest area increased by 0.75 million hectares over the five-year period from 2016 to 2021.
- Australia’s total forest area has continued to increase since 2008.
- Forest area change is calculated by applying forest area change data from Australia’s greenhouse gas inventory reporting to Australia’s total forest area of 133.6 million hectares.
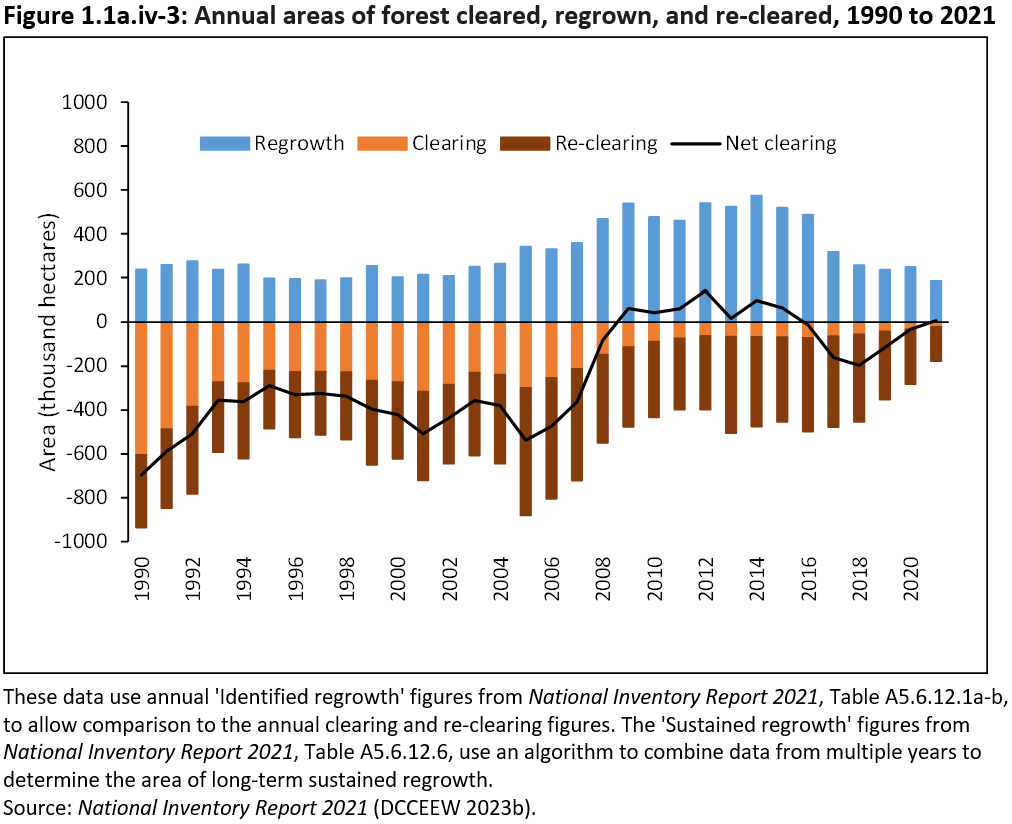
- The total area of both primary (first-time) clearing and secondary clearing (re-clearing) of forest has been progressively reducing over time.
Australia's forest area increased by 0.75 million hectares over the 5-year period from 2016 to 2021. This maintained the rise in total forest area that has been observed since 2008 (Figure 1.1a.iv-1A,B).
The annual change in Australia's forest area is calculated by application of forest area change data from Australia's National Inventory Report 2021 (DCCEEW 2023a,b) to the total forest area figure of 133.6 million hectares determined by ABARES using the Multiple Lines of Evidence process (see Indicator 1.1a.i Forest area by forest type).
Trends in forest area over the period from 1989 to 2021 differ between states and territories:
- in New South Wales and Queensland, forest area decreased from 1989 to 2008, by a combined total of 6.6 million hectares, but there was no substantial change after 2008
- in South Australia and Western Australia, forest area increased progressively over the whole period from 1989 to 2021, by a combined total of 4.9 million hectares
- in the Australian Capital Territory, Victoria, Tasmania and the Northern Territory, there was minimal change in forest area over the whole period from 1989 to 2021.
Click here for a Microsoft Excel workbook of the data for Figure 1.1a.iv-1.
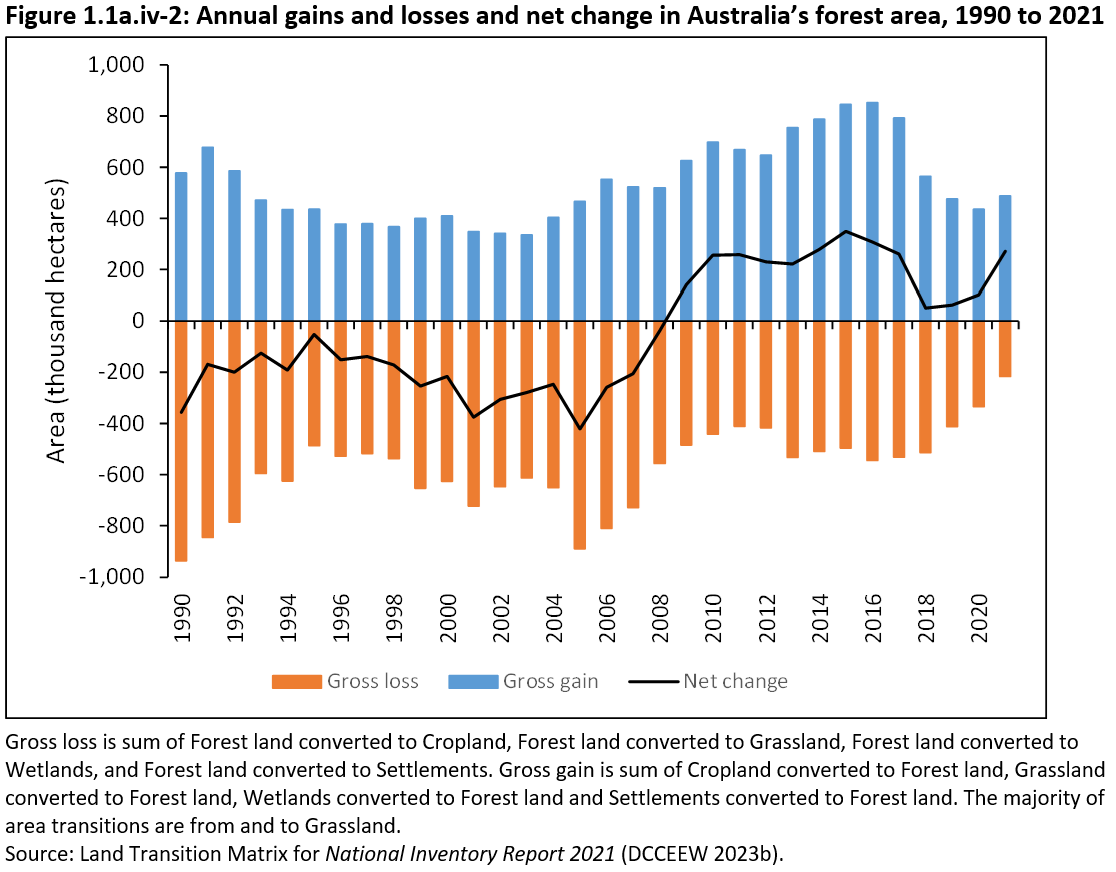
The gains and losses in forest area each year, and the resultant net annual change in forest area, are shown in Figure 1.1a.iv-2. The net annual area changes are the net result of a number of processes:
- natural expansion of forest onto areas of grassland that have not held forest for many years
- clearing of forest for agriculture, regrowth of forest onto recently cleared land, and re-clearing of regrowth forest
- clearing of forest for urban expansion, mining or other infrastructure
- changes in the area of commercial plantations
- new environmental plantings
- changes in the area of mangroves.
Click here for a Microsoft Excel workbook of the data for Figure 1.1a.iv-2.
One component of change in Australia’s forest area is clearing of forest, followed over time by regrowth of forest onto recently cleared land, then by re-clearing of that regrowth forest. This pattern of land management can be found in some of Australia’s grazing lands, mostly in Queensland and New South Wales. The national area of forest cleared, regrown and re-cleared is shown in Figure 1.1a.iv-3. Harvesting and replanting of native forest or plantations, as temporary changes in canopy cover in forest remaining forest, are not considered clearing or regrowth.
The total area of both primary (first-time) clearing and secondary clearing (re-clearing) of forest has been progressively reducing over time. The areas of forest cleared and re-cleared in 2020–21 were the lowest in this data series, at 22 thousand (cleared) and 155 thousand (re-cleared) hectares; and in that year the area of forest cleared or re-cleared was exceeded by the area of forest regrowing from previous clearing (185 thousand hectares). The average annual area of first-time forest clearing in the 5-year period 2016–21 was 43 thousand hectares.
Click here for a Microsoft Excel workbook of the data for Figure 1.1a.iv-3.
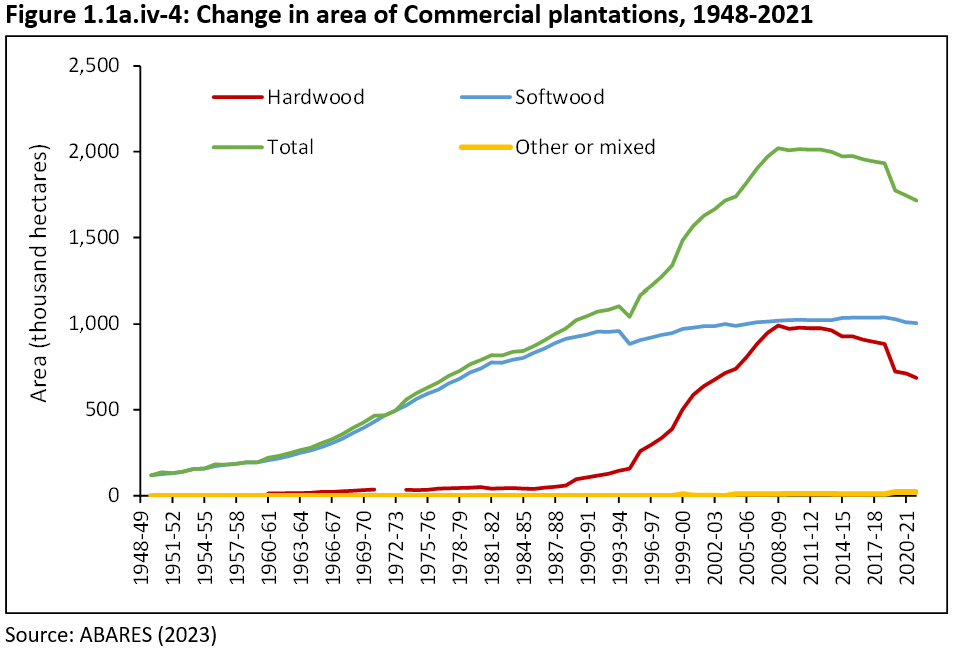
The area of Commercial plantations decreased by 239 thousand hectares (12%) over the period 2016–17 to 2021–22 (Figure 1.1a.iv-4), mostly due to a decrease of 221 thousand hectares (24%) in the area of hardwood plantations. Some of this area was returned to agriculture or other uses upon the expiration of hardwood plantation lease arrangements, while some still carries plantation trees now judged not to be commercial (so classified as ‘Other forest’, not ‘Commercial plantation’) and likely to be converted to agriculture in the future. Only a small area of new plantations was established (see Indicator 2.1b).
Click here for a Microsoft Excel workbook of the data for Figure 1.1a.iv-4.
ABARES (Australian Bureau of Agricultural and Resource Economics and Sciences) (2023). Australian plantation statistics 2023 update, ABARES, Canberra, August, CC BY 4.0. doi.org/10.25814/hhk8-4x26
DCCEEW (Department of Climate Change, Energy, the Environment and Water) (2023a). National Inventory Report 2021. Volume 1. Commonwealth of Australia, Canberra. dcceew.gov.au/climate-change/publications/national-inventory-report-2021
DCCEEW (Department of Climate Change, Energy, the Environment and Water) (2023b). National Inventory Report 2021. Volume 2. Commonwealth of Australia, Canberra. dcceew.gov.au/climate-change/publications/national-inventory-report-2021
Further information
Click here for Supporting information on 1.1a.iv Forest area change over time
- Native forest clearance for mine development
- Native forest clearance for urban expansion
- Plantation clearance and conversion to agriculture
- Plantation establishment
- Establishment of environmental plantings
- Native forest expansion