
Key issues
- In the week ending 3 April 2024, widespread rainfall was recorded across much of the country, exceptions being in the west of the country.
- Across cropping regions, rainfall totals up to 100 millimetres across Queensland may have disrupted the harvest of summer crops. Damaged sorghum crops would likely see a downgrade in yield quality.
- Over the coming days, severe weather associated with a low-pressure trough across the east coast is expected to bring up to 200 millimetres of rain to eastern New South Wales, up to 150 millimetres in southern Queensland and up to 50 millimetres in eastern Victoria.
- Following a wet week in much of Queensland’s cropping region, some sorghum crops are at risk of quality downgrades and harvest interruption. However, expected rainfall will support confidence related to sowing of winter crops.
- A dry week in Western Australia and South Australia will likely see a decline in soil moisture levels.
- March rainfall was 86% above long-term average nationally, but generally average or below average across southeastern cropping regions. Similar patterns are seen for upper- and lower-layer soil moisture levels.
- For the 3 months to March 2024, above average rainfall totals resulted in average to well above average pasture production for this time of year across most grazing regions. High pasture availability will likely enable farmers to continue to maintain current stock numbers and provide opportunities to build standing dry matter availability.
- Water storage levels in the Murray-Darling Basin (MDB) decreased between 28 March 2024 and 4 April 2024 by 89 gigalitres (GL). Current volume of water held in storage is 16 975 GL, equivalent to 76% of total storage capacity. This is 15 percent or 2957 GL less than at the same time last year.
- Allocation prices in the Victorian Murray below the Barmah Choke decreased from $37 on 28 March 2024 to $23 on 4 April 2024. Prices are lower in the Murrumbidgee and regions above the Barmah choke due to the binding of the Murrumbidgee export limit and Barmah choke trade constraint.
Climate
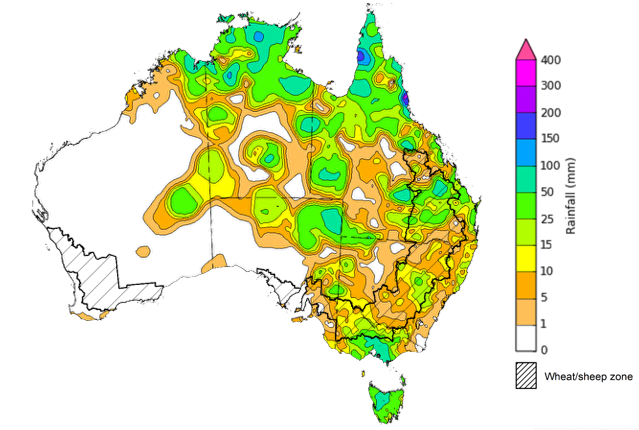
For the week ending 3 April 2024, low pressure systems in the northern tropics brought rainfall of up to 300 millimetres in scattered areas of far-north Queensland, with rainfall of up to 150 millimetres in the Northern Territory. A series of troughs moved across central and eastern parts of the country, bringing moderate rainfall totals, up to 100 millimetres in northern South Australia, and scattered areas in Queensland. High-pressure systems in the southwest kept Western Australia generally dry. In the southeast, a cold front brought rainfall to Tasmania and Victoria totalling up to 100 millimetres in some areas.
Across cropping regions, rainfall totals up to 100 millimetres were recorded across Queensland, which may have disrupted the harvest of summer crops as well as damaged the crops, which may result in downgrade of yield quality. In New South Wales and Victoria, rainfall up to 50 millimetres was recorded, while eastern South Australia recorded up to 10 millimetres. No rainfall was recorded across remaining cropping regions.
Rainfall for the week ending 3 April 2024
Issued: 03/04/2024
Note: The rainfall analyses and associated maps utilise data contained in the Bureau of Meteorology climate database, the Australian Data Archive for Meteorology (ADAM). The analyses are initially produced automatically from real-time data with limited quality control. They are intended to provide a general overview of rainfall across Australia as quickly as possible after the observations are received. For further information go to http://www.bom.gov.au/climate/rainfall/
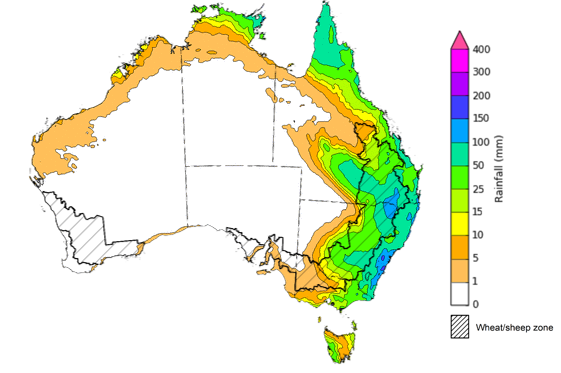
Over the 8 days to 11 April, severe weather associated with a low-pressure trough across the east coast is expected to bring up to 200 millimetres of rain in eastern New South Wales, 150 millimetres in southern Queensland and 50 millimetres in Victoria. A low-pressure system in the northern tropics is forecast to bring rainfall totals of up to 100 millimetres in the Northern Territory and far-north Queensland. A cold front is expected to bring rainfall totals of up to 50 millimetres in Tasmania. A high-pressure system is expected to keep the much of the country generally dry.
Across cropping regions, rainfall totals of up to 150 millimetres are forecast for southern Queensland and northern New South Wales. This is likely to disrupt the harvest of summer crops in the area. Additionally, this follow-up rain from previous week could downgrade the sorghum crop yield. Rainfall totals in parts of South Australia are forecast to reach 5 millimetres, and Victoria is forecast to receive up to 15 millimetres. Western Australia cropping regions are expected to remain dry and will likely see a decline in stored soil moisture.
Total forecast rainfall for the period 04 April to 11 April 2024
Issued 04/04/2024
Note: This rainfall forecast is produced from computer models. As the model outputs are not altered by weather forecasters, it is important to check local forecasts and warnings issued by the Bureau of Meteorology.
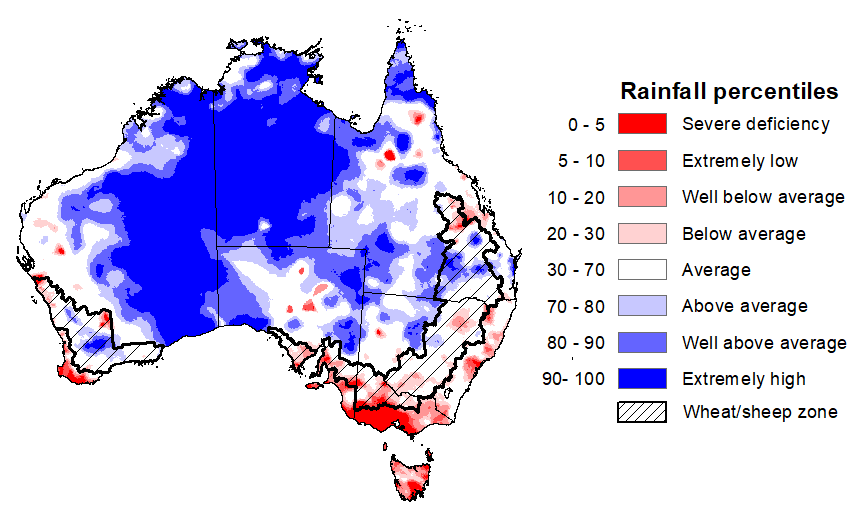
In March 2024, national rainfall was 86% above average, marking it as the third wettest March since records began in 1900. Rainfall was generally extremely high across northern, central, and western Australia, and below average for south-eastern and far south-western parts of the country.
In cropping regions, rainfall across South Australia and Victoria was predominately below average to average, whereas New South Wales observed generally average rainfall and Queensland observed average rainfall with above average rainfall in central areas. Western Australia cropping regions largely experienced between average and extremely high rainfall.
As we transition into the remainder of the autumn season, the focus shifts to ensuring adequate rainfall to prepare for the winter cropping season. This is especially crucial in regions that received below-average rainfall in March. Given a below median rainfall outlook for April, and April to June period, this necessitates a careful monitoring and strategic planning to mitigate potential impacts on upcoming winter crops.
Rainfall percentiles for March 2024
Source: Bureau of Meteorology
Upper layer soil moisture levels for March 2024 varied considerably throughout Australia. High levels of upper layer soil moisture were modelled in the northern and central regions, with most of the Northern Territory, parts of Queensland, South Australia and New South Wales, and central Western Australia showing very much above average upper layer soil moisture. In contrast, upper layer soil moisture in the south was modelled to be below average, with much of Victoria and Tasmania being below average for this time of year. Average levels of upper layer soil moisture was modelled for west Western Australia, parts of New South Wales, east Queensland, and central South Australia.
During this time of the year, the status of upper layer soil moisture guides planting of winter crops, as well as supports pasture development. It is also an important indicator of the ability to access paddocks for harvesting of late-planted summer crops in these regions.
Across cropping regions, March upper layer soil moisture was highly variable, with Western Australia and Queensland having areas above or below average. South Australia and Victoria were average to below average.
Modelled upper layer soil moisture for March 2024
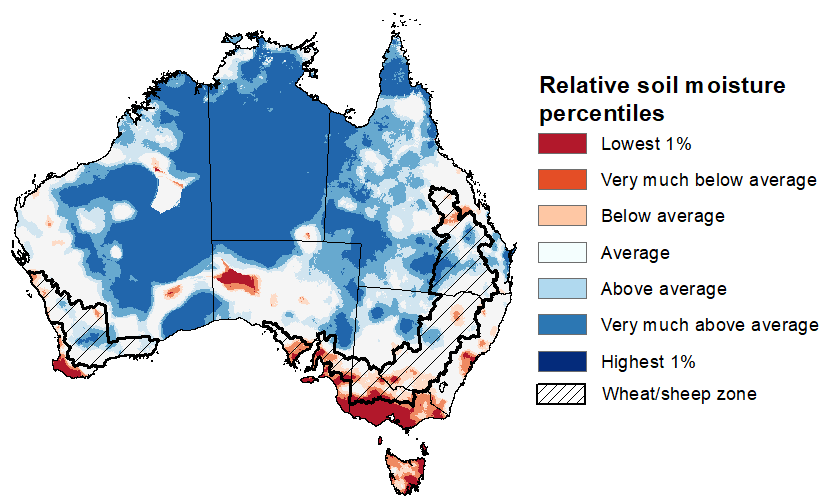
Source: Bureau of Meteorology (Australian Water Resources Assessment Landscape model)
Across the northern tropics, lower-layer soil moisture was average to very much above average in March. However, areas of below average lower layer soil moisture were evident in parts of New South Wales, Victoria, South Australia, and much of Tasmania. Across southern Queensland, much of New South Wales, and north South Australia, lower layer soil moisture was modelled as being average.
Lower-layer soil moisture plays a pivotal role in sustaining the growth of winter crops and pasture during their critical development stages. Across Australian cropping regions, lower layer soil moisture generally ranged from average to very much below average across South Australia, Victoria, and New South Wales. These deficient levels of soil moisture may impact the establishment of forthcoming winter crops since the climate outlook for the next three months is below the median rainfall.
Lower layer soil moisture was average to very much above average in Western Australia, while Queensland was modelled as having generally average lower layer soil moisture. High lower-layer soil moisture in Western Australia is expected to support the development of winter crops and promote pasture growth.
Modelled lower layer soil moisture for March 2024
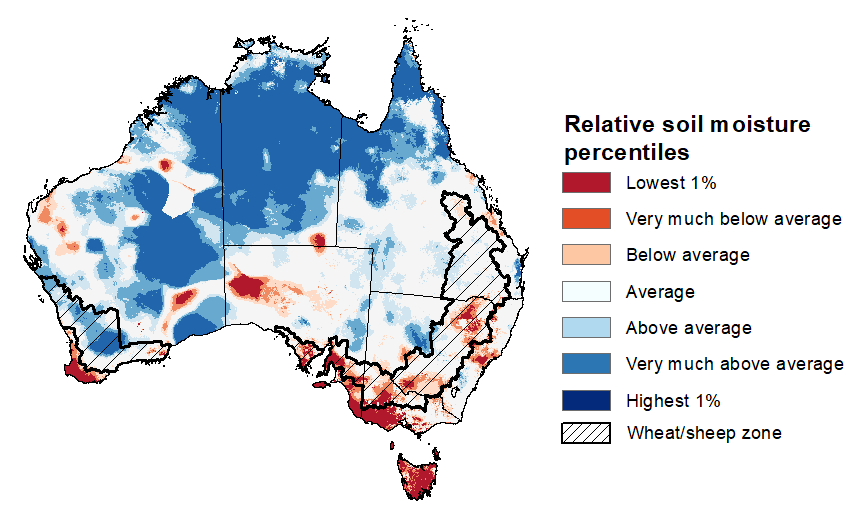
Source: Bureau of Meteorology (Australian Water Resources Assessment Landscape model)
January to March is the peak pasture growth period for northern Australia which typically provides the bulk of feed to maintain livestock production through the low pasture growth months of the northern dry season. Across southern Australia, the three months to March pasture growth is typically low reflecting lower rainfall totals, high temperatures and high evapotranspiration rates at this time of year. Pasture availability during this period influences the growth, branding and marking rates of lambs and calves, livestock turnoff and the production of meat, milk, and wool.
For the 3 months to March 2024, above average rainfall totals resulted in average to well above average pasture production for this time of year across most grazing regions. However, extremely low to below average pasture growth rates were recorded across western parts of Western Australia, northern New South Wales, and parts of eastern Victoria, as well as across Tasmania.
Above average to extremely high pasture availability will likely enable farmers to continue to maintain current stock numbers and provide opportunities to build standing dry matter availability.
Relative pasture growth for 3-months ending March 2024 (1 January to 31 March 2024)
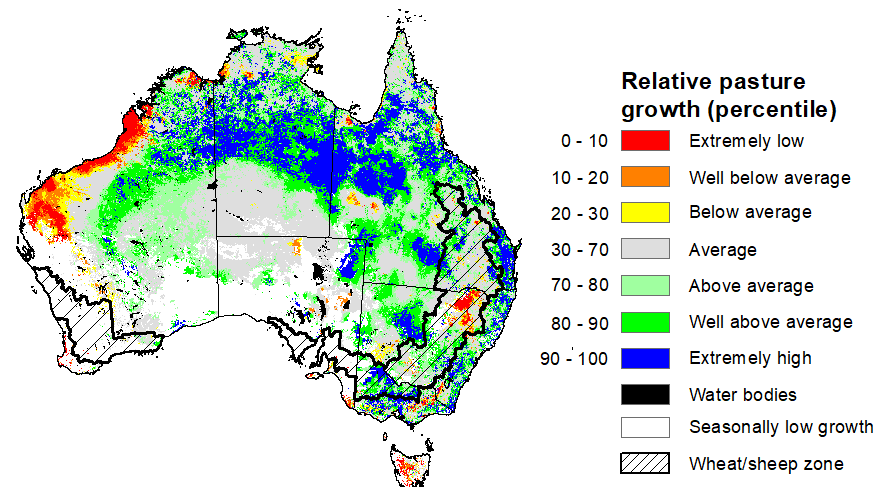
Source: Queensland Department of Science, Information Technology and Innovation
Water
Water storages, water markets and water allocations - current week
The Tableau dashboard may not meet accessibility requirements. For information about the contents of these dashboards contact ABARES.

Commodities
Information on weekly price changes in agricultural commodities is now available at the Weekly commodity price update.