
Key issues
- In the week ending 5 June 2024, rainfall was recorded across much of Australia.
- Across cropping regions, northern Queensland, central to southeastern parts of Western Australia, and localised areas in central South Australia, New South Wales, western Victoria and southern Queensland recorded up to 10 millimetres of rainfall. Remaining cropping regions recorded rainfall ranging from 10 to 100 millimetres.
- This rainfall has likely provided a relief to most cropping areas where topsoil moisture had dried out and will allow for germination of dry sown winter crops.
- Over coming days, little to no rainfall is forecast for central and northern parts of the country. The passage of a series of cold fronts is expected deliver heavy rainfall to parts of southern Australia. Onshore flow is expected to bring significant falls to south-eastern New South Wales.
- Across cropping regions, widespread falls of between 10 and 100 millimetres are expected in Western Australia, with between 5 and 50 millimetres forecast for central New South Wales and southern Victoria. Little to no rainfall is expected in the remaining cropping regions.
- If realised, this rainfall will boost soil moisture levels across cropping regions in Western Australia, allowing for the germination and establishment of winter crops.
- In May, the national rainfall was 35% below average. Rainfall was above average in a broad band extending from central New South Wales, into south Queensland and northern South Australia, and through to the northwest Western Australia. Extremely low rainfall was observed across large areas of southern Australia, with southern Victoria, southern South Australia, and western Tasmania seeing the highest deficiencies.
- For the 3 months to May 2024, above average rainfall totals resulted in average to well above average pasture production for this time of year across most grazing regions across northern and eastern Australia. High pasture availability will likely enable farmers to continue to maintain current stock numbers and provide opportunities to build standing dry matter availability. Across southern Australia, graziers will be more reliant on the supplementary feed to maintain current stocking rate and production given extremely low pasture growth in these areas.
- Water storage levels in the Murray-Darling Basin (MDB) increased between 30 May 2024 and 6 June 2024 by 114 gigalitres (GL). Current volume of water held in storage is 16 939 GL, equivalent to 76% of total storage capacity. This is 16 percent or 3,296 GL less than at the same time last year. Water storage data is sourced from the BOM.
- Allocation prices in the Victorian Murray below the Barmah Choke decreased from $22 on 30 May 2024 to $21 on 6 June 2024. Prices are lower in the Murrumbidgee due to the binding of the Murrumbidgee export limit.
Climate
For the week ending 5 June 2024, rainfall was recorded across much of Australia. Cold fronts brought isolated thunderstorms and rainfall to the far south-west of Western Australia. A low-pressure trough interacted with tropical moisture, generating rainfall over broad area extending from the northwest to the southeast of Australia. Meanwhile, an offshore low-pressure system brought significant rainfall totals of up to 100 millimetres to parts of eastern New South Wales and Victoria, and southern Queensland.
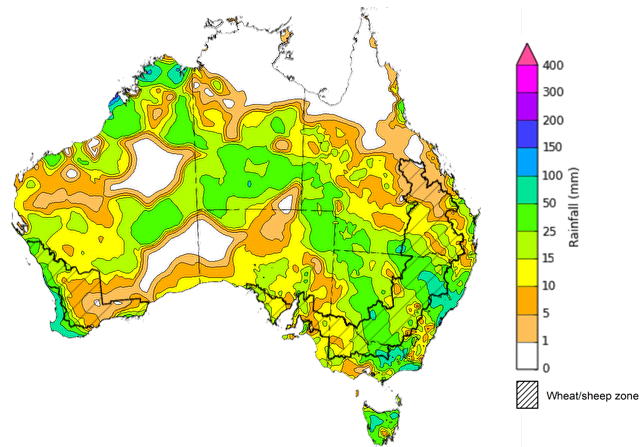
Across cropping regions, rainfall totals were highly variable for the week ending 5 June 2024. Northern Queensland, central to southeastern parts of Western Australia, and localised areas in central South Australia, New South Wales, western Victoria and southern Queensland recorded up to 10 millimetres of rainfall. Remaining cropping regions recorded falls ranging from 10 to 100 millimetres. This week rainfall has likely provided a relief to most cropping areas where topsoil moisture had dried out and will allow for germination of dry sown winter crops. Rainfall in New South Wales, eastern Victoria and southern areas of Queensland will continue to built-up layer soil moisture profiles.
Rainfall for the week ending 5 June 2024
Issued: 05/06/2024
Note: The rainfall analyses and associated maps utilise data contained in the Bureau of Meteorology climate database, the Australian Data Archive for Meteorology (ADAM). The analyses are initially produced automatically from real-time data with limited quality control. They are intended to provide a general overview of rainfall across Australia as quickly as possible after the observations are received. For further information go to http://www.bom.gov.au/climate/rainfall/
Over the 8 days to 13 June 2024, little to no rainfall is forecast for central and northern parts of the country. The passage of a series of cold fronts is expected deliver heavy rainfall to parts of southern Australia. The onshore flow is expected to bring significant amounts of rainfall to south-eastern New South Wales.
Across cropping regions, widespread falls of between 10 and 100 millimetres are expected in Western Australia, with falls of between 5 and 50 millimetres forecast for central New South Wales and southern Victoria. Little to no rainfall is expected in the remaining cropping regions. If realised, this rainfall will provide further boost soil moisture levels across cropping regions in Western Australia, allowing for the germination and establishment of winter crops.
Total forecast rainfall for the period 6 June to 13 June 2024
![Map of the total forecast rainfall for the next 8 days. Image provided by the Bureau of Meteorology. Please refer to accompanying text for a more detailed description.]](/sites/default/files/images/forecast-rain-week-6-to-13-june-2024.PNG)
Issued 06/06/2024
Note: This rainfall forecast is produced from computer models. As the model outputs are not altered by weather forecasters, it is important to check local forecasts and warnings issued by the Bureau of Meteorology.
During May 2024, across the nation as a whole rainfall was 35% below average, and over 50% below average in Queensland, Victoria, Tasmania, and South Australia. Rainfall was above average in a broad band extending from central New South Wales, into south Queensland and northern South Australia, and through to the northwest Western Australia. Extremely low rainfall was observed across large areas of southern Australia, with southern Victoria, southern South Australia, and western Tasmania seeing the highest rainfall deficiencies.
In cropping regions, rainfall across South Australia, Victoria, northern Queensland, and Western Australia was generally below average to extremely low. The only cropping region to experience extremely high rainfall being western regions of New South Wales, with southern Queensland and the remainder of New South Wales experiencing generally average rainfall.
Rainfall percentiles for May 2024
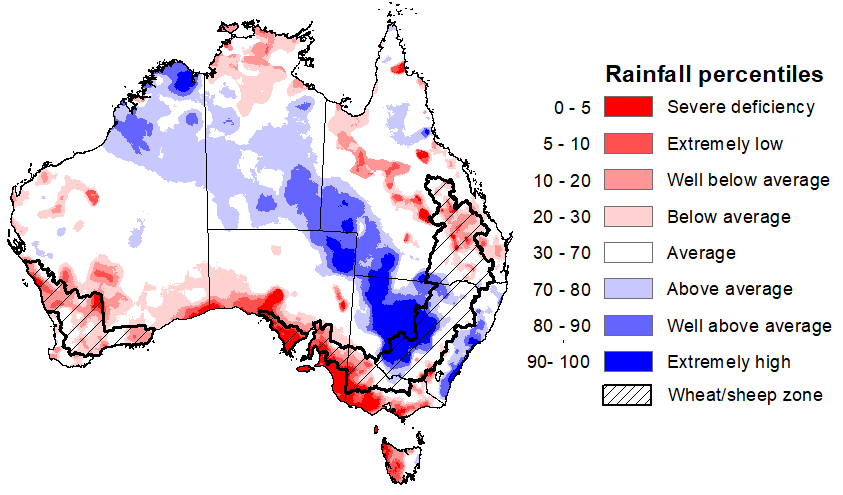
Source: Bureau of Meteorology
Upper layer soil moisture levels for May 2024 varied considerably throughout Australia. High levels of upper layer soil moisture were modelled in New South Wales, eastern parts of Western Australia, north-eastern parts of South Australia, and across parts of south-western and north-eastern Queensland. In contrast, upper layer soil moisture in the south, parts of east, and far-north was modelled to be below average, with large parts of Victoria, South Australia and Tasmania at the lowest 1% percentile of upper layer soil moisture.
At this time of the year, upper layer soil moisture is important for the germination and establishment of early sown winter crops across Australian cropping regions.
Across cropping regions, May upper layer soil moisture was highly variable. Much of South Australia, western Victoria, northern Queensland and northern and southern Western Australia showing below average levels of upper layer soil moisture. By contrast, upper layer soil moisture was average to very much above average in New South Wales, southern Queensland and central areas of Western Australia and Victoria. Low levels of upper layer soil moisture have seen a high proportion of this year’s winter crop dry sown and will require adequate and timely rainfall during June to allow for crop germination and establishment. For areas with below average levels of stored soil moisture, dry autumn conditions are also expected to have discouraged some growers from committing to their full planting intentions.
Modelled upper layer soil moisture for May 2024
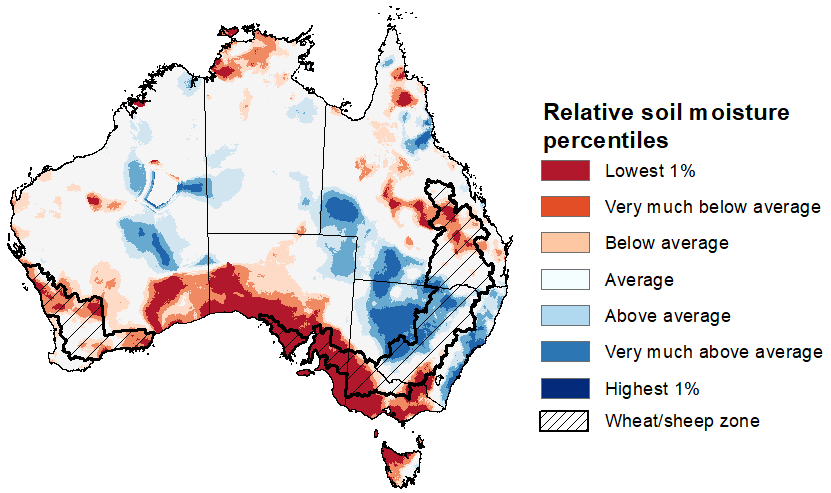
Source: Bureau of Meteorology (Australian Water Resources Assessment Landscape model)
Across northern and eastern Australia, lower layer soil moisture was average to very much above average in May. However, large areas of extremely low lower layer soil moisture were evident in southern Australia. Modelled lower layer soil moisture was generally average for remaining areas of Australia.
Lower layer soil moisture plays a pivotal role in sustaining the growth of winter crops and pasture during their critical development stages. Across Australian cropping regions, lower layer soil moisture generally ranged from average to very much above average across New South Wales and Queensland, and generally average across central areas of Victoria and Western Australia. Extremely low levels of lower layer soil moisture were modelled across much of South Australia, Western Australia and Victoria. These extremely low levels of stored soil moisture across much of South Australia, Western Australia and Victoria will mean that adequate and timely rainfall will be required during winter and spring to support current level of forecast crop and livestock production.
Modelled lower layer soil moisture for May 2024
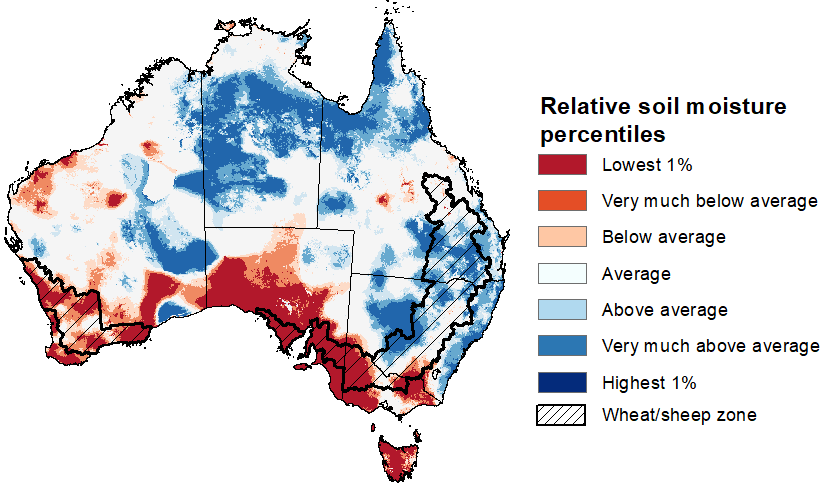
Source: Bureau of Meteorology (Australian Water Resources Assessment Landscape model)
Pasture growth during the March to May period affects the availability of fodder to support livestock production across northern Australia as it enters a seasonally low growth period. Across southern Australia, autumn pasture growth influences the standing biomass available to support livestock production over winter and the reliance on hay and grain during this period.
For the 3 months to May 2024, above average rainfall totals resulted in average to extremely high pasture production for this time of year across most grazing regions across northern and eastern Australia. Average to extremely high pasture production across grazing regions will likely enable farmers to continue to maintain current stock numbers and provide opportunities to build standing dry matter availability.
In contrast, extremely low to below average pasture growth rates were recorded across western parts of Western Australia, parts of central Queensland, southern South Australia, and parts of southern and eastern Victoria and central Tasmania. Across southern Australia, graziers will be more reliant on the supplementary feed to maintain current stocking rate and production.
Relative pasture growth for 3-months ending May 2024 (1 March to 31 May 2024)
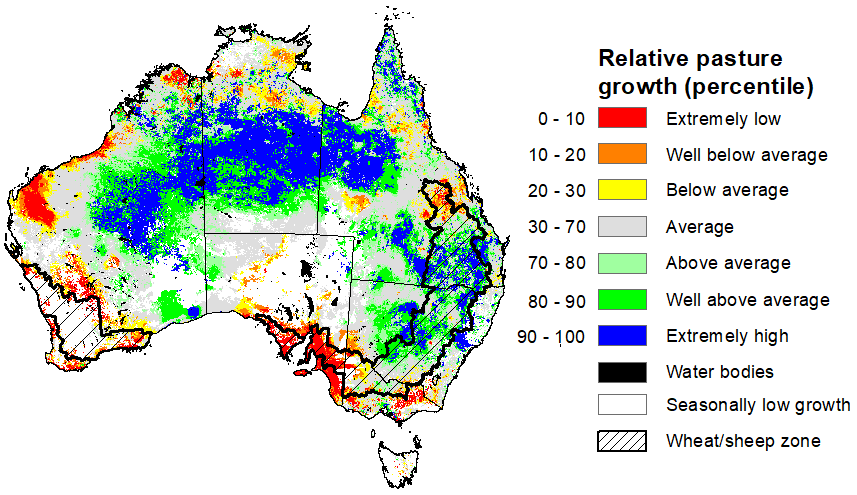
Source: Department of Environment, Science and Innovation
Water
Water storages, water markets and water allocations - current week
The Tableau dashboard may not meet accessibility requirements. For information about the contents of these dashboards contact ABARES.

Commodities
Information on weekly price changes in agricultural commodities is now available at the Weekly commodity price update.