
Key issues
- In the week ending 6 March 2024, rainfall was recorded across the majority of the mainland.
- Over the coming days, widespread storms and showers are forecast for much of northern Australia and Western Australia. Southerly onshore winds will bring showers to coastal New South Wales and Queensland. A cold front will bring showers to the western Tasmania.
- A dry week in Queensland and New South Wales will support uninterrupted harvest of early planted summer crops.
- If realized, forecast rainfall for a fourth week in a row across Western Australian cropping regions will provide some boost to soil moisture levels following several months of dryness. However, additional rainfall during the forthcoming autumn months will be imperative for adequately preparing for the winter cropping season.
- February 2024 rainfall across Western Australia and New South Wales was predominantly average to above average, whereas Queensland cropping regions observed generally average rainfall. South Australia and much of Victoria had extremely low rainfall for February.
- Upper and lower levels of soil moisture are average to extremely high across cropping regions with exceptions in South Australia and western Victoria and southern Western Australia where upper layer soil moisture is deficient. Current levels of lower layer soil moisture are expected to provide a solid foundation for the upcoming winter cropping season.
- Average to extremely high pasture production occurred across much of eastern and northern parts of the country. This will likely enable farmers to continue to maintain current stock numbers and provide opportunities to build standing dry matter availability.
- Water storage levels in the Murray-Darling Basin (MDB) decreased between 29 February 2024 and 7 March 2024 by 197 gigalitres (GL). Current volume of water held in storage is 17 819 GL, equivalent to 80% of total storage capacity. This is 12 percent or 2488 GL less than at the same time last year.
- Allocation prices in the Victorian Murray below the Barmah Choke increased from $25 on 29 February 2024 to $26 on 7 March 2024. Prices are lower in the Murrumbidgee and regions above the Barmah choke due to the binding of the Murrumbidgee export limit and Barmah choke trade constraint.
Climate
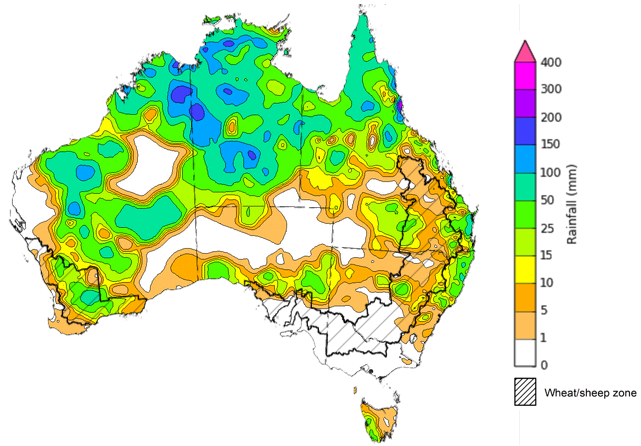
For the week ending 6 March 2024, extensive storms and showers linked with the monsoon trough were recorded across much of northern Australia and Western Australia. A sequence of troughs traversed Western Australia, Queensland, the Northern Territory, South Australia, and New South Wales, precipitating widespread showers and isolated thunderstorms across the majority of the mainland. A cold front moved across Tasmania, resulting in rainfall across the state.
In cropping regions, rainfall totals of up to 100 millimetres were recorded across large areas of Western Australia. This marks the third consecutive week of rainfall in Western Australia following a prolonged period of dryness. While these rainfall events likely provided respite from the preceding dry spell in Western Australia's cropping regions, further rainfall will still be necessary to bolster moisture levels before the commencement of winter crop planting.
Rainfall totals reaching up to 50 millimetres were recorded in both western and eastern Queensland, as well as in central New South Wales. These falls will further enhance the yield potential of summer crops in Queensland. Moreover, they will contribute to sustaining soil moisture levels to support pasture growth and consolidate soil moisture reserves in preparation for the forthcoming winter cropping season.
In contrast, cropping regions in South Australia, Victoria, and southern New South Wales remained dry during this week.
Rainfall for the week ending 6 March 2024
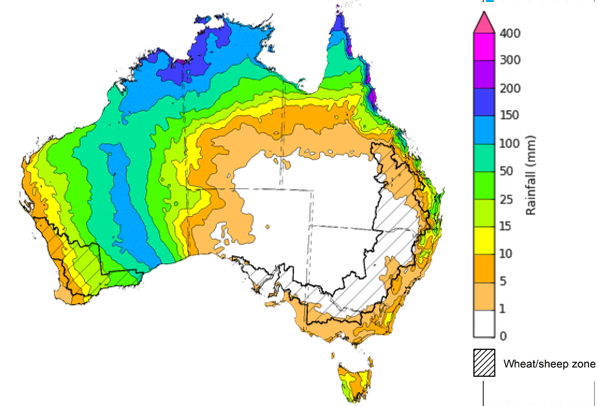
Over the 8 days to 14 March 2024, widespread storms and showers are forecast for much of Western Australia and Australia’s tropical north. Southerly onshore winds are expected to bring showers to parts of eastern New South Wales and Queensland. Meanwhile, a cold front is expected to bring showers to western Tasmania. A high-pressure system is likely to keep much of the remainder of the country mainly dry.
Across cropping regions, rainfall totals up to 10 millimetres are forecast for northern Queensland and parts of eastern New South Wales and southern Victoria. If realised, these falls will continue to benefit soil moisture levels for pasture growth and support the growth of long season and later sown summer crops. With the harvest of early planted summer crop now underway, dry conditions over the next 8-days would support an uninterrupted harvest.
For the fourth week in a row large area of Western Australia are expected to receive up to 50 millimetres of rainfall. If realised, these falls will continue to build soil moisture levels ahead of the upcoming winter cropping season. However, timely falls will be required closer to planting of winter crops to consolidate this recent boost in soil moisture.
Little to no rainfall is expected across remaining cropping regions.
Total forecast rainfall for the period 7 March to 14 March 2024
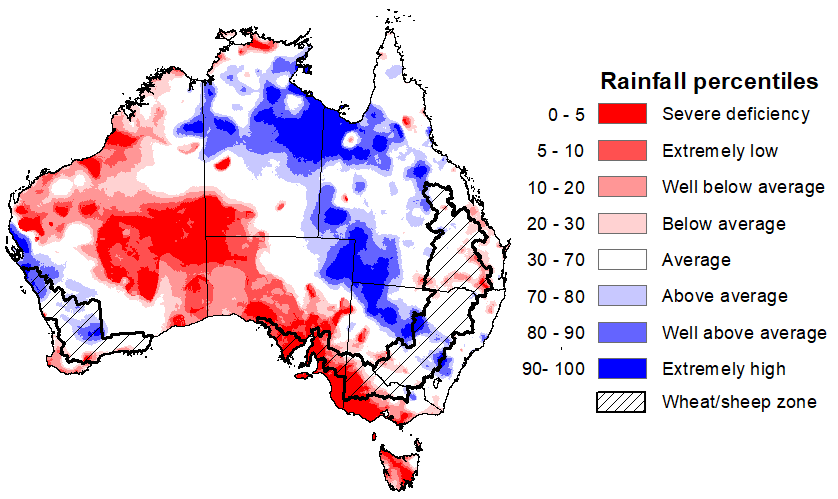
Rainfall during February 2024 was generally above average to extremely high for parts of northern, eastern and south-western Australia, and below average across most of central Western Australia, western and southern South Australia and Victoria, and Tasmania.
In cropping regions, rainfall across Western Australia and New South Wales was predominantly average to above average, whereas Queensland cropping regions observed generally average rainfall. In contrast, February rainfall was generally extremely low in South Australia and much of Victoria.
The eastern cropping regions benefited from rainfall levels surpassing the average, fortifying soil moisture reserves that were previously established by the moist conditions of December and January. Although the rainfall observed in the western agricultural regions during February provided some relief from preceding dry spells, additional rainfall during the forthcoming autumn months will be imperative for adequately preparing for the winter cropping season.
Rainfall percentiles for February 2024
Upper layer soil moisture levels for February 2024 varied considerably throughout Australia. Extremely low upper layer soil moisture was modelled for much of western and southern Victoria, southern parts of South Australia, and expansive areas in central, southeastern, and northern Western Australia, and Tasmania. In contrast, upper layer soil moisture levels were modelled to be above average for north-eastern South Australia, central New South Wales, a significant portion of Queensland, and the northern regions of the Northern Territory. Average levels of upper-layer soil moisture were modelled for the remaining areas of Australia.
During this time of the year, the status of upper layer soil moisture assumes critical importance for late-planted summer crops in northern New South Wales and Queensland, as well as for pasture growth throughout northern Australia, given that plant germination and establishment heavily rely on this moisture. It is also an important indicator of the ability to access paddocks for the harvesting of early planted summer crops.
Across cropping regions, upper layer soil moisture was generally at or above average levels for this time of the year, with exceptions noted in South Australia, large areas of western Victoria, and the southern margins of Western Australia, where it was markedly deficient.
Modelled upper layer soil moisture for February 2024
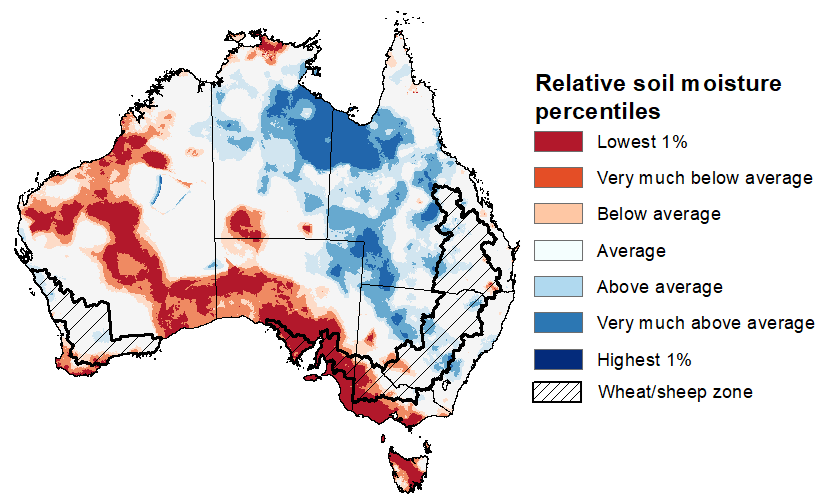
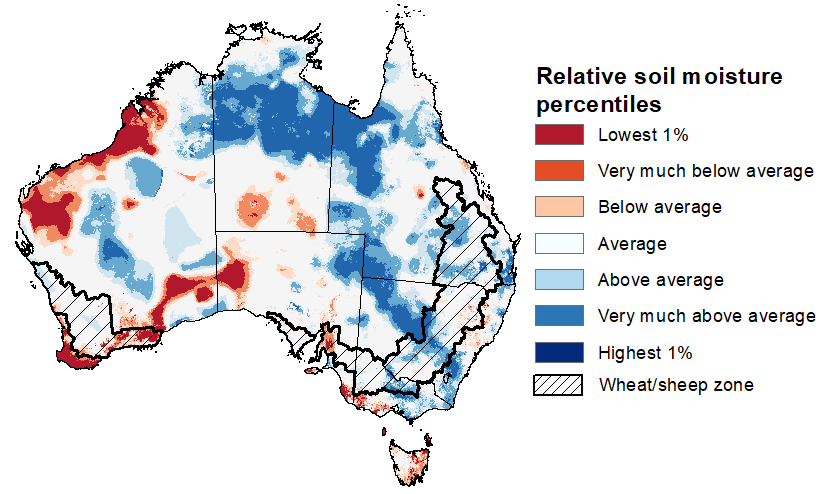
Lower layer soil moisture plays a pivotal role in sustaining the growth of summer crops and pasture during their peak development stages. Across much of the country, lower layer soil moisture ranged from average to above average in February. However, areas of below average lower layer soil moisture were evident across parts of north-western and southern Western Australia, portions of southern Northern Territory, western South Australia, southern Victoria, and throughout eastern Tasmania.
Within Australian cropping regions, lower layer soil moisture was generally average to very much above average. Notable exceptions being parts of central South Australia, southern Western Australia, and scattered areas of north-eastern New South Wales, where levels fell below the average range. These elevated levels of lower layer soil moisture are expected to sustain above average yield prospects for summer crops across New South Wales and southern Queensland and promote strong pasture growth rates across much of eastern and northern Australia. Additionally, these current levels of lower layer soil moisture are expected to provide a solid foundation for the upcoming winter cropping season.
Modelled lower layer soil moisture for February 2024
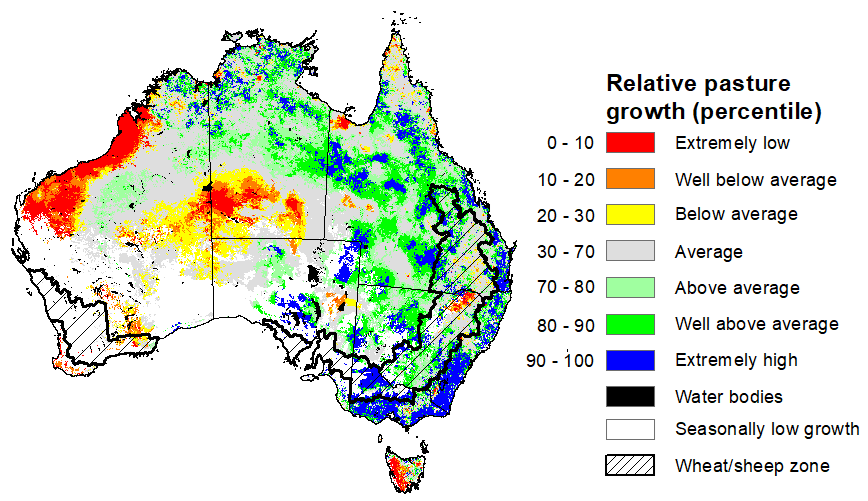
December to February is the peak pasture growth period for northern Australia which typically provides the bulk of feed to maintain production through the low pasture growth months of the northern dry season. Across southern Australia, December to February pasture growth is typically low reflecting lower rainfall totals, high temperatures and high evapotranspiration rates at this time of year. Pasture availability during this period influences the growth, branding and marking rates of lambs and calves, livestock turnoff and the production of meat, milk, and wool.
For the 3 months to February 2024, above average rainfall totals and mild summer temperatures resulted in average to well above average pasture production for this time of year across most grazing regions. However, extremely low to below average pasture growth rates were recorded across parts of central Australia, and northwest and southern parts of Western Australia, western Tasmania and across relatively small area in the northeast New South Wales.
Average to extremely high pasture production occurred across much of eastern and northern parts of the country. This will likely enable farmers to continue to maintain current stock numbers and provide opportunities to build standing dry matter availability.
Relative pasture growth for 3-months ending February 2024 (1 December to 29 February 2024)
Water
Water storages, water markets and water allocations - current week
The Tableau dashboard may not meet accessibility requirements. For information about the contents of these dashboards contact ABARES.

Commodities
Information on weekly price changes in agricultural commodities is now available at the Weekly commodity price update.