Skip to main content Skip to main navigation Skip to search
Home

Top navigation main

  • News & media
  • Jobs
  • Ministers
  • Contact us
Main menu

AWE Main

  • Agriculture and land
    Agriculture and land Building stronger and more sustainable agriculture, fisheries, forestry and land care.
    • Animal health
    • Climate change and agriculture
    • Drought, disaster and rural support
    • Farming, food and drought
    • Fisheries
    • Forestry
    • Levies and charges on agricultural products
    • Mouse infestation advice
    • Plant health
    Xylella

    Protect against unwanted plant pests

    Our biosecurity system helps protects us. Everyone has a role in supporting our biosecurity system.

    Find out more

  • Biosecurity and trade
    Biosecurity and trade
    • Aircraft, vessels and military
    • Biosecurity policy
    • Cats and dogs
    • Exporting
    • Importing
    • Pests, diseases and weeds
    • Public awareness and education
    • Trade and market access
    • Travelling or sending goods to Australia
    • Report a concern
    Brown marmorated stink bug

    BMSB Seasonal Measures

    Australia has strengthened seasonal measures to manage the risk of BMSB.

    View our seasonal measures

  • Science and research
    Science and research Undertaking research and collecting data to support informed decisions and policies.
    • Australian Bureau of Agricultural and Resource Economics and Sciences (ABARES)
    • Plant Innovation Centre
    Abares

    ABARES Insights

    Get 'snapshots’ of agricultural, forestry and fisheries industries, or analysis of key issues.

    Find out more

  • About us
    About us We enhance our agricultural industries and trade, and manage the threat of biosecurity risks to Australia.
    • Accountability and reporting
    • Assistance, grants and tenders
    • Contact us
    • Fees and charges
    • News and media
    • Our commitment to you
    • Payments
    • People and jobs
    • Publications
    • What we do
    • Who we are
    Budget 2025-26

    Budget 2025-26

    The 2025–26 Portfolio Budget Statements were released on 25 March 2025.

    Find out more

  • Online services
    Online services We do business with you using online platforms. This makes it easier for you to meet your legal requirements.
Department of Agriculture

Breadcrumb

  1. Home
  2. About us
  3. News and media
  4. Snapshot of global fertiliser trade

Back to news - AWE

  • Back to news

Snapshot of global fertiliser trade

  • Newsletter
  • Trade
30 September 2022

High natural gas prices, export restrictions, and Russia’s invasion of Ukraine have placed pressure on the supply and price of fertilisers. There is no indication that prices are likely to experience substantial falls in the near-term.

Global fertiliser prices are rising

  • Average global fertiliser prices have almost tripled since January 2020.
  • Most commercial cropping and horticulture operations rely on a combination of nitrogen (N), phosphorous (P) and potassium (K) fertilisers.
  • Nitrogenous fertilisers, such as ammonia and urea, are produced using natural gas. Rising gas prices are increasing costs for fertiliser producers, particularly in Europe, and have led to widespread production halts.
  • International sanctions have limited exports from Russia and Belarus.
  • In October 2021, China introduced additional inspection requirements for fertiliser exports. Exports have subsequently fallen to multi-year lows.

Figure 1: Price indices January 2020 - September 2022

This graph shows price indices January 2020 - September 2022.   From left to right of the x-axis, US fertiliser prices are represented by maroon, Australian fertiliser import unit prices are represented by blue, and US natural gas prices are represented by light orange.  January 2017 = 0
Sources: Green Markets, ABS, Markets Insider January 2017 = 0


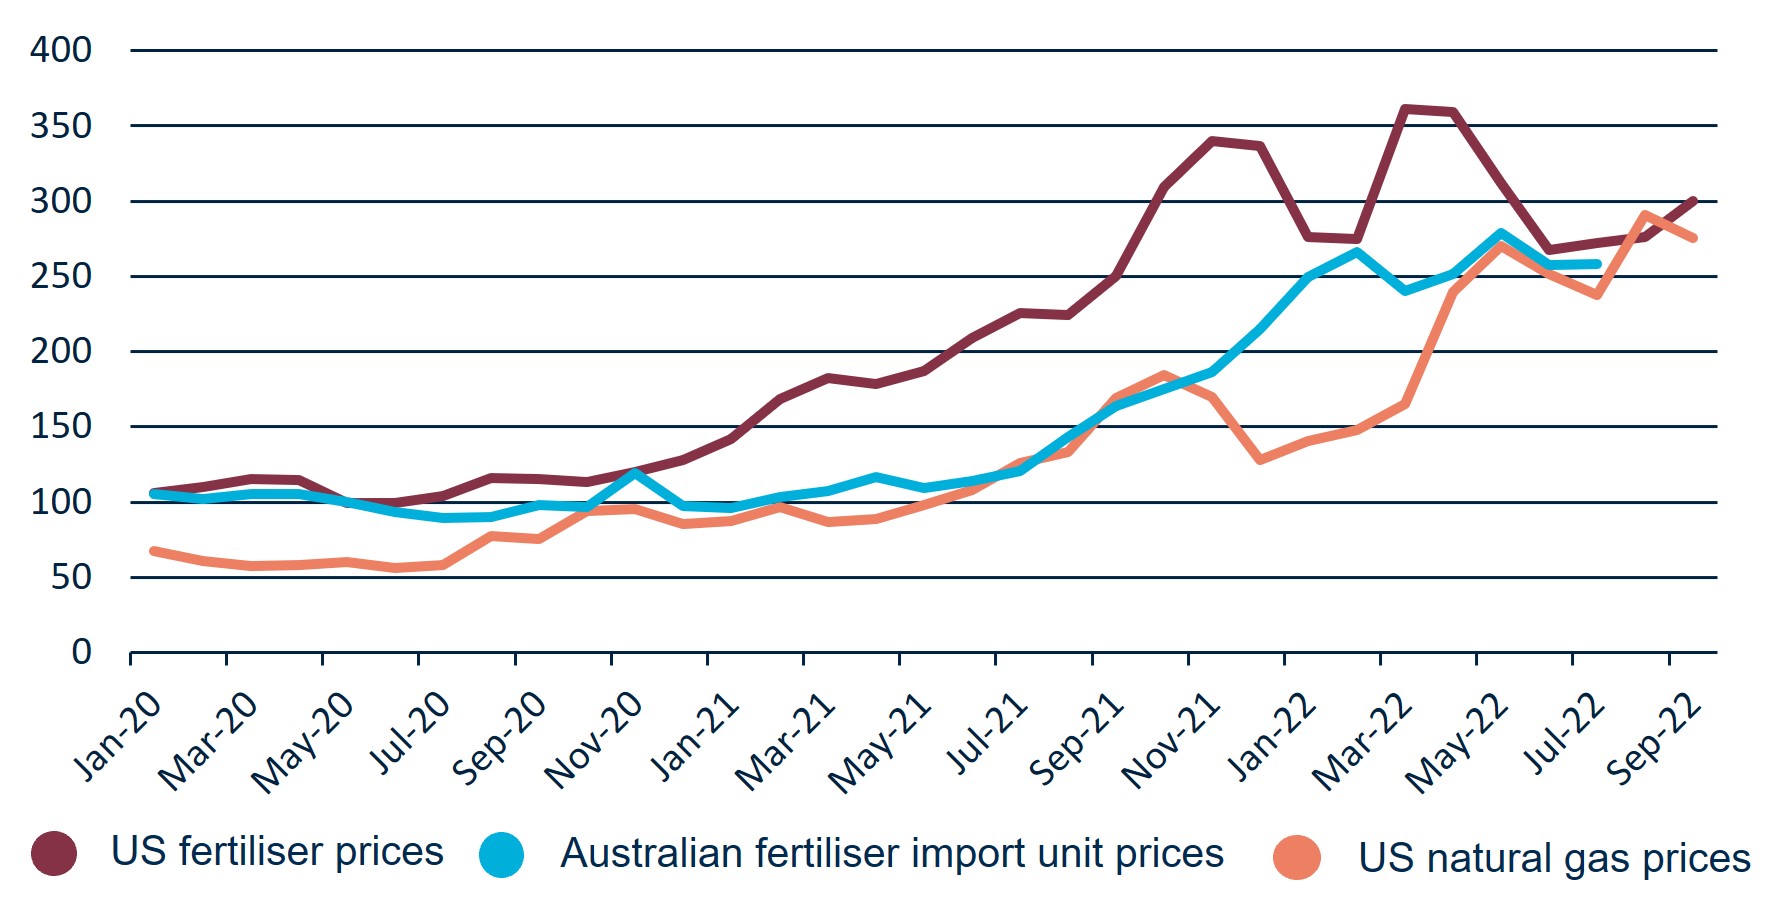
Figure 2: World fertiliser production and exports

This data shows world fertiliser production and exports.   From left to right, the first circle is Production, with China at 25% represented by orange, USA/Canada at 16% represented by dark green, Russia/Belarus at 15% represented by light green, India at 9% represented by Navy, EU at 8% represented by purple, and Other at 27% represented by blue.   The second circle is Exports, with EU at 19% represented by purple, Russia/Belarus at 14% represented by light green, China at 12% represented by orange, USA/Ca
Sources: Production: FAOSTAT, 2018-2020 avg.; Exports: TradeMap, 2019-2021 avg

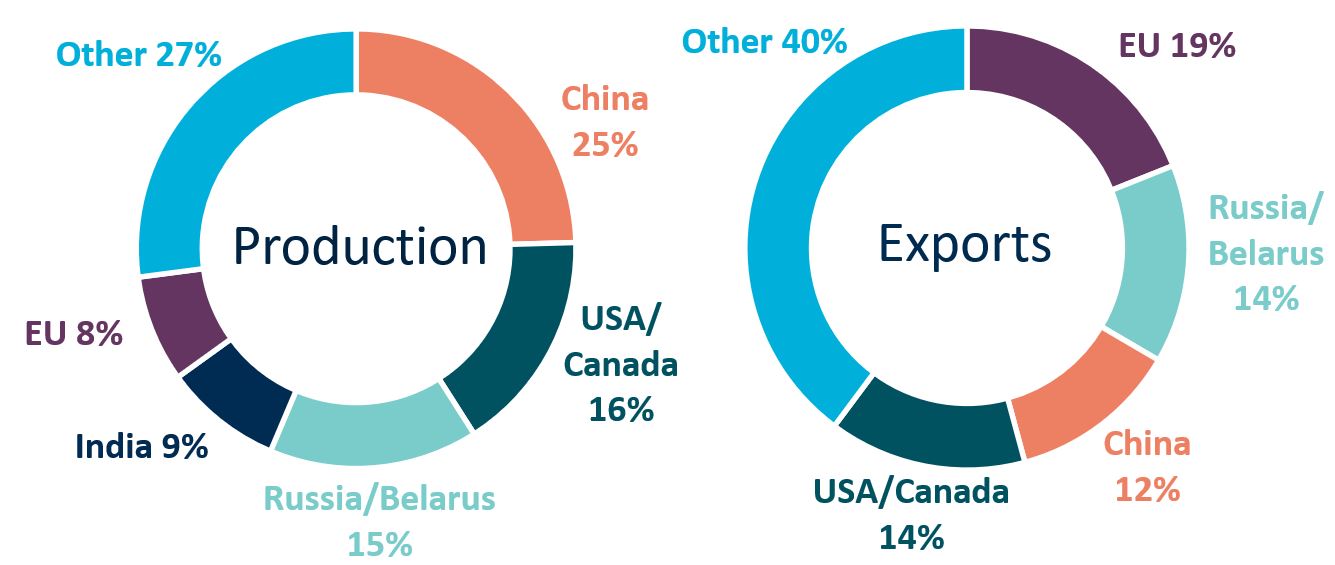
World fertiliser production and export markets are concentrated.

  • China, India, the US, Russia, and the EU, account for 66% of world nitrogen and phosphate fertiliser production.
  • Canada, Russia, Belarus and China account for 80% of world potash (potassium) production.
  • The EU, Russia, Belarus and China account for 46% of the value of world fertiliser exports.
  • There are important differences across nutrient types. For example, India is a major producer of nitrogen and phosphate, but relies on Belarus and Canada for potash supplies.
World fertiliser prices have almost tripled since January 2020 text with a picture of a graph rising.   Impact on food prices; rise of production cost for farmers, decrease of crop yields if fertiliser use is reduced text with a picture of plant fertiliser.   Australian import prices since 2020-21 - Urea: up 122%, MAP (Monoammonium phosphate): up 120%, and Potash: up 105% text with a picture of Australia.

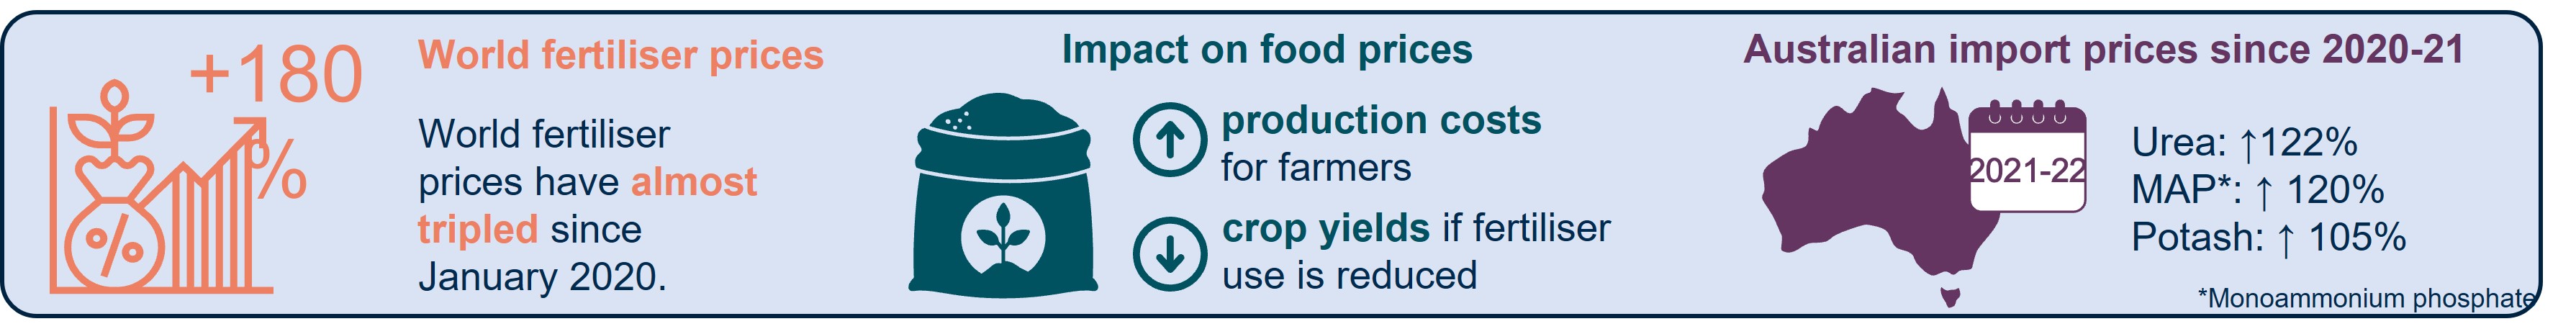
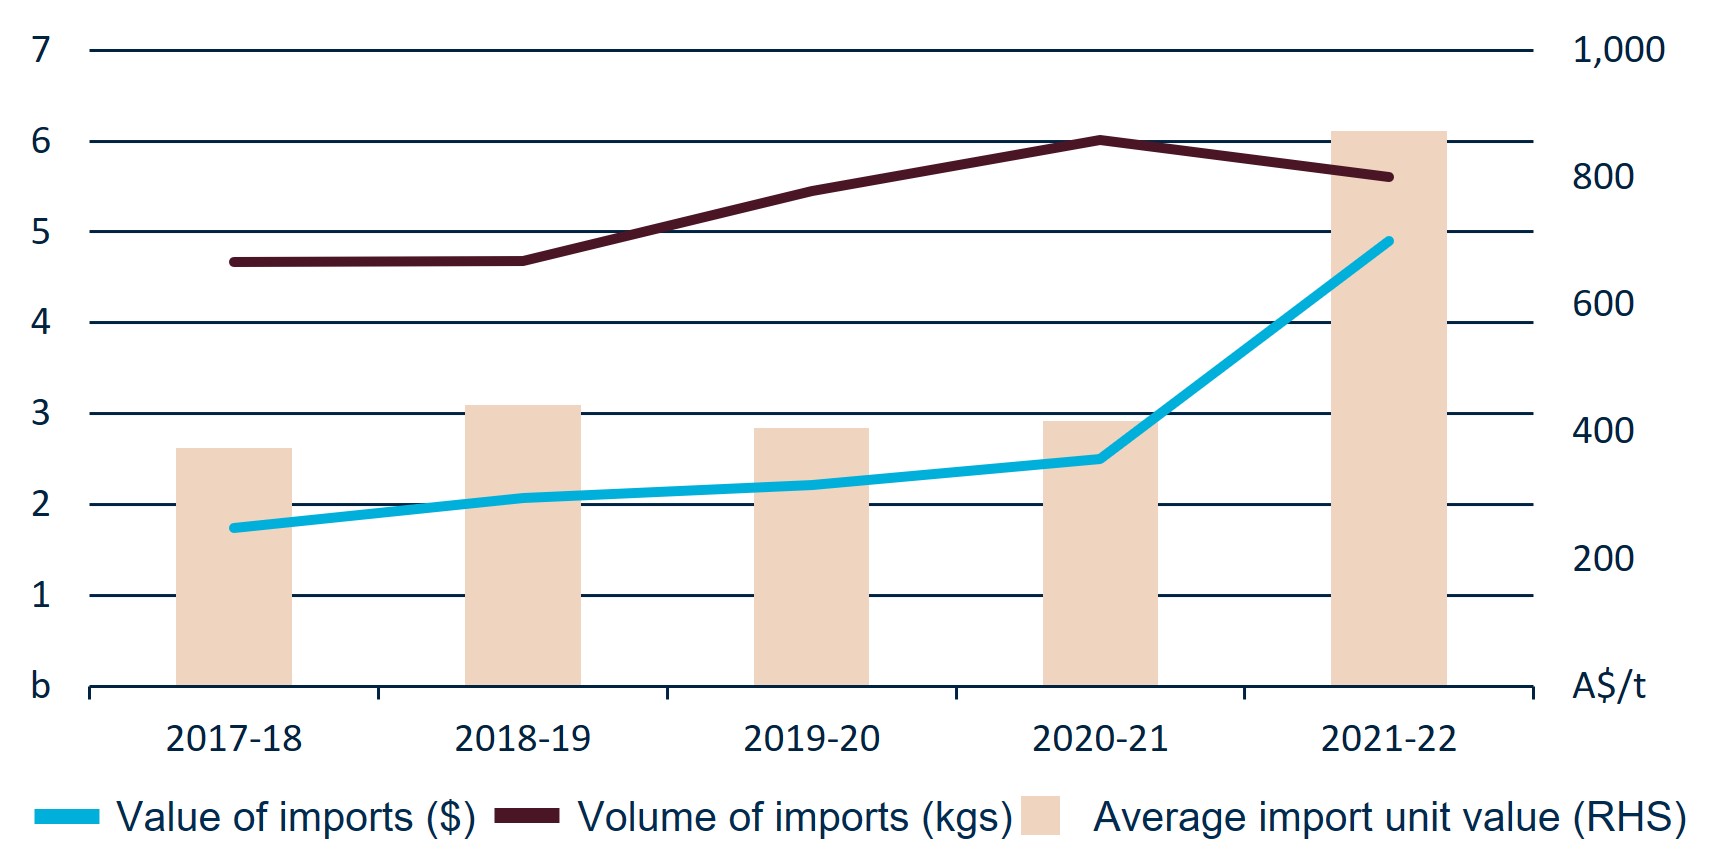
Figure 3: Australian fertiliser imports by financial year

This graph shows Australian fertiliser imports by financial year.  From left to right of the x-axis, Value of imports ($) is represented by blue, Volume of imports (kgs) is represented by maroon, and Average import unit value is represented by light yellow.
ABS, 2022 and ABARES Agricultural forecasts and outlook, September pp. 3-4

Impact of high global prices on Australian fertiliser imports

  • Figure 3 shows the volume of Australian fertiliser imports in 2021-22 was slightly down compared to 2020-21, but still at high levels.
  • The value of imports increased from $2.5b in 2020-21 to $4.9b in 2021-22. This is due to a 110% increase in average import unit value.
  • Ongoing high import volumes in 2021-22 are a good sign for Australian fertiliser supplies and indicate that Australian farmers are applying fertiliser at the same rate, despite high fertiliser prices.

How do price rises in Australia compare to the rest of the world?

  • Figure 1 shows the relative price increases of fertiliser in North America, Australian fertiliser imports, and US natural gas.
  • Australian import prices were slower to rise due to Australia’s limited imports from Russia and Belarus, seasonality, and the time lag between production overseas and imports entering Australia.
  • Australian prices are now beginning to converge with global prices.

Outlook for fertiliser prices

  • There is no indication that fertiliser prices will experience substantial falls in the near-term.
  • Natural gas prices are likely to rise further during the European winter, particularly following the closure of the Nord Stream 1 pipeline.
  • Neither export restrictions by China nor sanctions on Russia and Belarus are scheduled for removal.
  • High prices are encouraging new investment in fertiliser and natural gas production, including in Australia. However, these projects will have a limited impact in the short-term.

Download

Snapshot of global fertiliser trade PDF
Snapshot of global fertiliser trade DOCX

Connect with us

Follow our @AusAgTrade Twitter account for all your #TradeTips and Market Intel.

Subscribe to our monthly Agriculture Market Intelligence Insights newsletter.

  • Share on Facebook
  • Share on Twitter
  • Share on LinkedIn
  • Email
  • Copy link

Related

Aerial image of green and yellow segmented field

Cutting global farm subsidies can improve environmental outcomes

  • Media release
  • Agriculture
31 March 2025
Decorative image

Philippines-Australia Agriculture Forum

  • News
  • Trade
20 March 2025
Decorative

Non-tariff barriers: A multi-billion dollar burden

  • Media release
  • Exports
18 March 2025
Thanks for your feedback.
Thanks! Your feedback has been submitted.

We aren't able to respond to your individual comments or questions.
To contact us directly phone us or submit an online inquiry

CAPTCHA
This question is for testing whether or not you are a human visitor and to prevent automated spam submissions.

Please verify that you are not a robot.

Skip
Page last updated: 26 February 2024

We acknowledge the continuous connection of First Nations Traditional Owners and Custodians to the lands, seas and waters of Australia. We recognise their care for and cultivation of Country. We pay respect to Elders past and present, and recognise their knowledge and contribution to the productivity, innovation and sustainability of Australia’s agriculture, fisheries and forestry industries.

Artwork: Protecting our Country, Growing our Future
© Amy Allerton, contemporary Aboriginal Artist of the Gumbaynggirr, Bundjalung and Gamilaroi nations.

Footer

  • Contact us
  • Accessibility
  • Disclaimer
  • Privacy
  • FOI

© Department of Agriculture, Fisheries and Forestry

Facebook X LinkedIn Instagram