
The all non-livestock exports report includes total export numbers for non-livestock animal exports from Australia. This report is compiled from information on the export permit and health certificate issued by the department to exporters at the time of departure. If a prescribed species is not listed below, it has not been exported from Australia during the reporting period.
Financial Year
| Species | 2020/2021 | 2021/2022 | 2022/2023 | 2023/2024 | 2024/2025 |
|---|---|---|---|---|---|
| Bird | 5,096 | 4,164 | 8,605 | 6,994 | 2,604 |
| Cat | 4,239 | 4,296 | 3,564 | 3,771 | 4,173 |
| Coral | 43,613 | 37,056 | 25,979 | 24,122 | 16,151 |
| Crustacean | 1,738 | 1,216 | 1 | 27 | 233 |
| Day Old Chick | 395,530 | 1,493,521 | 756,659 | 264,732 | 0 |
| Dog | 6,346 | 6,930 | 8,169 | 8,630 | 9,631 |
| Donkey | 0 | 3 | 0 | 0 | 0 |
| Ferret | 0 | 2 | 0 | 0 | 3 |
| Fingerling | 3,606,593 | 10,428,184 | 17,080,337 | 15,321,826 | 21,413,780 |
| Fish | 6,915 | 2,167,577 | 34,465 | 238,600 | 1,739,862 |
| Hatching Egg | 202,673 | 809,190 | 1,883,430 | 936,360 | 381,600 |
| Horse | 1,883 | 1,881 | 2,230 | 2,246 | 2,383 |
| Insect | 19,208 | 37,690 | 30,531 | 73,829 | 26,505 |
| Laboratory Animal | 54,019,963 | 4,821 | 6,519 | 1,093 | 298,854 |
| Marine Invertebrate | 484 | 1,443 | 3,584 | 68 | 7,131 |
| Mollusc | 0 | 0 | 0 | 40 | 0 |
| Rabbit | 42 | 35 | 47 | 30 | 60 |
| Reptile | 1 | 0 | 0 | 0 | 0 |
| Rodent | 32 | 11 | 15 | 1 | 9 |
| Zoo Animal | 19 | 23 | 29 | 31 | 41 |
Calendar Year
| Species | 2021 | 2022 | 2023 | 2024 | 2025 |
|---|---|---|---|---|---|
| Bird | 3,615 | 6,524 | 10,771 | 2,059 | 10,360 |
| Cat | 4,656 | 3,615 | 3,615 | 4,033 | 4,632 |
| Coral | 42,097 | 25,059 | 29,713 | 20,779 | 12,349 |
| Crustacean | 958 | 1004 | 23 | 238 | 0 |
| Day Old Chick | 1,315,392 | 1,000,974 | 462,799 | 87,427 | 150,620 |
| Dog | 6,332 | 7,856 | 8,303 | 9,161 | 10,847 |
| Donkey | 3 | 0 | 0 | 0 | 0 |
| Ferret | 2 | 0 | 0 | 0 | 3 |
| Fingerling | 3,847,071 | 9,645,168 | 25,027,134 | 16,880,194 | 27,220,631 |
| Fish | 454,930 | 1,770,833 | 239,661 | 1,649,359 | 130,638 |
| Hatching Egg | 421,140 | 1,602,090 | 1,296,330 | 586,980 | 696,330 |
| Horse | 1,637 | 1,978 | 2,213 | 2,269 | 2,664 |
| Insect | 28,458 | 27,290 | 80,691 | 26,149 | 24,105 |
| Laboratory Animal | 18,013,448 | 8,056 | 1,026 | 6,634 | 58,065,376 |
| Marine Invertebrate | 1,746 | 3,696 | 1 | 178 | 7,245 |
| Mollusc | 0 | 0 | 0 | 40 | 0 |
| Rabbit | 46 | 40 | 35 | 66 | 39 |
| Reptile | 0 | 0 | 0 | 0 | 0 |
| Rodent | 35 | 18 | 4 | 5 | 8 |
| Zoo Animal | 21 | 28 | 18 | 38 | 37 |
Note: The department does not have a centralised database for non-livestock animal exports. These figures are collated from information provided by regional service centres using best available data. The figures are updated once all data has been received for that period. Documentation for some animals is processed in a different location to the port of export. This is reflected in the tables below e.g. Region: ACT, Load Port: Sydney.
The Excel spreadsheet will allow you to download data and develop your own reports. The figures provided in the spreadsheet are the total numbers (Head) exported by species, destination country and end use. The following fields have been provided to allow you to develop a variety of reports.
- State
- Port of export
- Destination country
- Species
- Quantity
- Month of export
- Year of export
- Financial year of export.
The excel spreadsheet is updated monthly. Figures are subject to change as more data becomes available.
To generate the data you are interested in, please download the Excel file and select the filter drop down arrow located in the grey highlighted header.
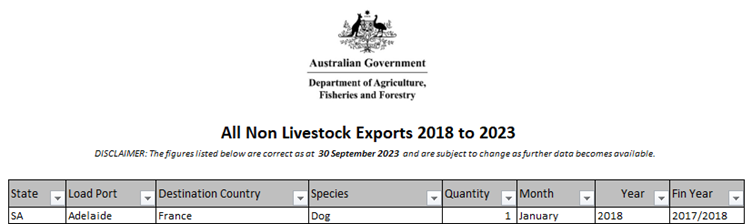
Please note: you are able to use multiple filters at one time – for example:
- Select the drop down arrow in Species and select Dog
- Select the drop down arrow in State and select FNQLD
- Select the drop down arrow in Year and select 2018.
These filtered fields will then provide you with the number of dogs that have been exported from FNQLD during 2018.
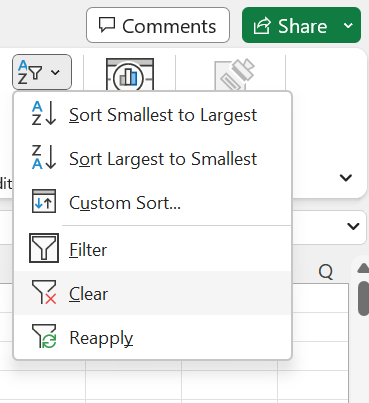
To clear any filtered selections, click on the Sort & Filter button in the top right corner of the ribbon and then select Clear.

Download
If you have difficulty accessing these files, contact us for help.
Greyhound exports
Statistical information about Greyhound exports from Australia, updated monthly.
Greyhound exports - May 2026
| Country | Jan | Feb | Mar | Apr | May | Jun | Jul | Aug | Sep | Oct | Nov | Dec | Total |
|---|---|---|---|---|---|---|---|---|---|---|---|---|---|
| Canada | 20 | 10 | 28 | 30 | 108 | 196 | |||||||
| China | 0 | 0 | 1 | 0 | 0 | 1 | |||||||
| France | 0 | 0 | 0 | 1 | 0 | 1 | |||||||
| Hong Kong SAR | 0 | 1 | 0 | 0 | 0 | 1 | |||||||
| Ireland | 0 | 0 | 0 | 0 | 1 | 1 | |||||||
| Japan | 0 | 0 | 0 | 0 | 1 | 1 | |||||||
| Netherlands | 1 | 0 | 0 | 0 | 0 | 1 | |||||||
| New Zealand | 1 | 0 | 1 | 1 | 2 | 5 | |||||||
| Portugal | 0 | 0 | 0 | 1 | 0 | 1 | |||||||
| Singapore | 0 | 0 | 1 | 1 | 0 | 2 | |||||||
| Thailand | 0 | 0 | 1 | 0 | 0 | 1 | |||||||
| United Kingdom | 0 | 0 | 0 | 1 | 0 | 1 | |||||||
| United States of America | 32 | 49 | 50 | 65 | 27 | 223 | |||||||
| Total | 54 | 60 | 82 | 100 | 139 | 435 |
Note: Number of Greyhound exports is correct as at 31 May 2026. The figures are updated once all data has been received for that period.
The excel spreadsheet is updated monthly. Figures are subject to change as more data becomes available.
To generate the data you are interested in, please download the Excel file and select the filter drop down arrow located in the grey highlighted header.
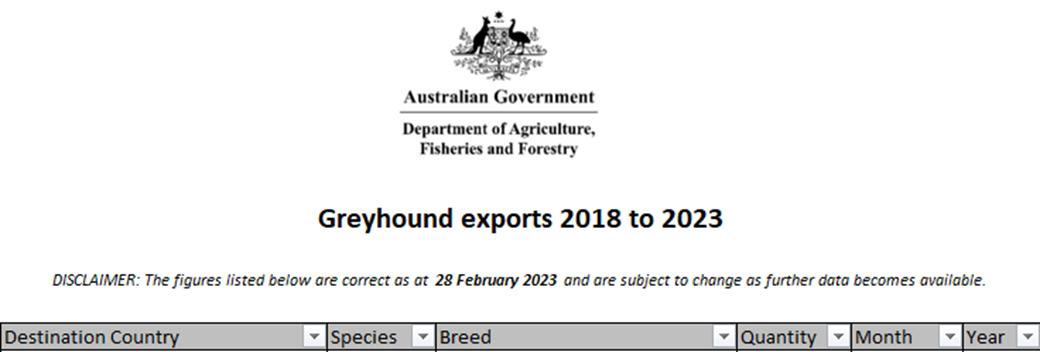
Please note: you are able to use multiple filters at one time – for example:
- Select the drop down arrow in Destination Country and select United Kingdom
- Select the drop down arrow in Month and select January
- Select the drop down arrow in Year and select 2018.
These filtered fields will then provide you with the number of greyhounds exported throughout January for 2018.
To clear any filtered selections, click on the Sort & Filter button in the top right corner of the ribbon and then select Clear.
Download
If you have difficulty accessing these files, contact us for help.