Skip to main content Skip to main navigation Skip to search
ABARES - Land use and management

Top navigation abares

  • Department
  • Ministers
  • Media Centre
Main menu

Main navigation ACLUMP

  • Land home
    Land home
  • About ACLUMP
    About ACLUMP
  • Land use
    Land use
  • Publications
    Publications
  • Data download
    Data download
  • Latest news
    Latest news
Department of Agriculture

Breadcrumb

  1. DAFF Home
  2. ABARES
  3. Land use and management
  4. Land use
  5. Catchment scale land use profiles

Secondary ACLUMP

  • Land use
    • Land use mapping
    • Catchment scale land use of Australia and Commodities – Update December 2023
    • Catchment scale land use profiles
    • Mapping technical specifications
    • Land use apps
    • Data download
    • Publications
    • Australian Land Use and Management Classification
      • ALUM Classification Version 8 (October 2016)
    • Australian Agricultural Census 2020–21 visualisations
    • Land use of Australia 2010–11 to 2020–21

Catchment scale land use profiles

Updated: 5 February 2025

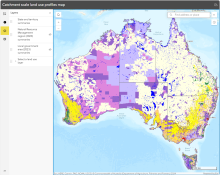
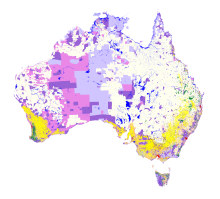
The Catchment scale land use profiles are a series of interactive dashboards and a Web Map of land use data assembled using the Catchment scale land use of Australia - Update December 2023 version 2 by commonly used regions. 

How to use the profiles dashboards

Follow these steps to select and view land use information for your region:

  1. Select a state or territory
  2. Select a region (not needed for state and territory dashboard)

You can also

  • Click features to filter – click again to remove filter
  • Hover over elements for more information
  • Hover over map for legend
  • Download data or image
  • Share 

Figure 1. Use top drop-down filters to select state or territory and then region (region not needed for state and territory dashboard).

Image of Catchment scale land use profiles local government area Showing Dropdown list to select state: New South Wales and Local Government Area: Albury. Dashboard shows a pie chart for percentage area of agricultural land use, bar chards for broad uses and top land uses by area, land use area summary statistics and land use map for the region.

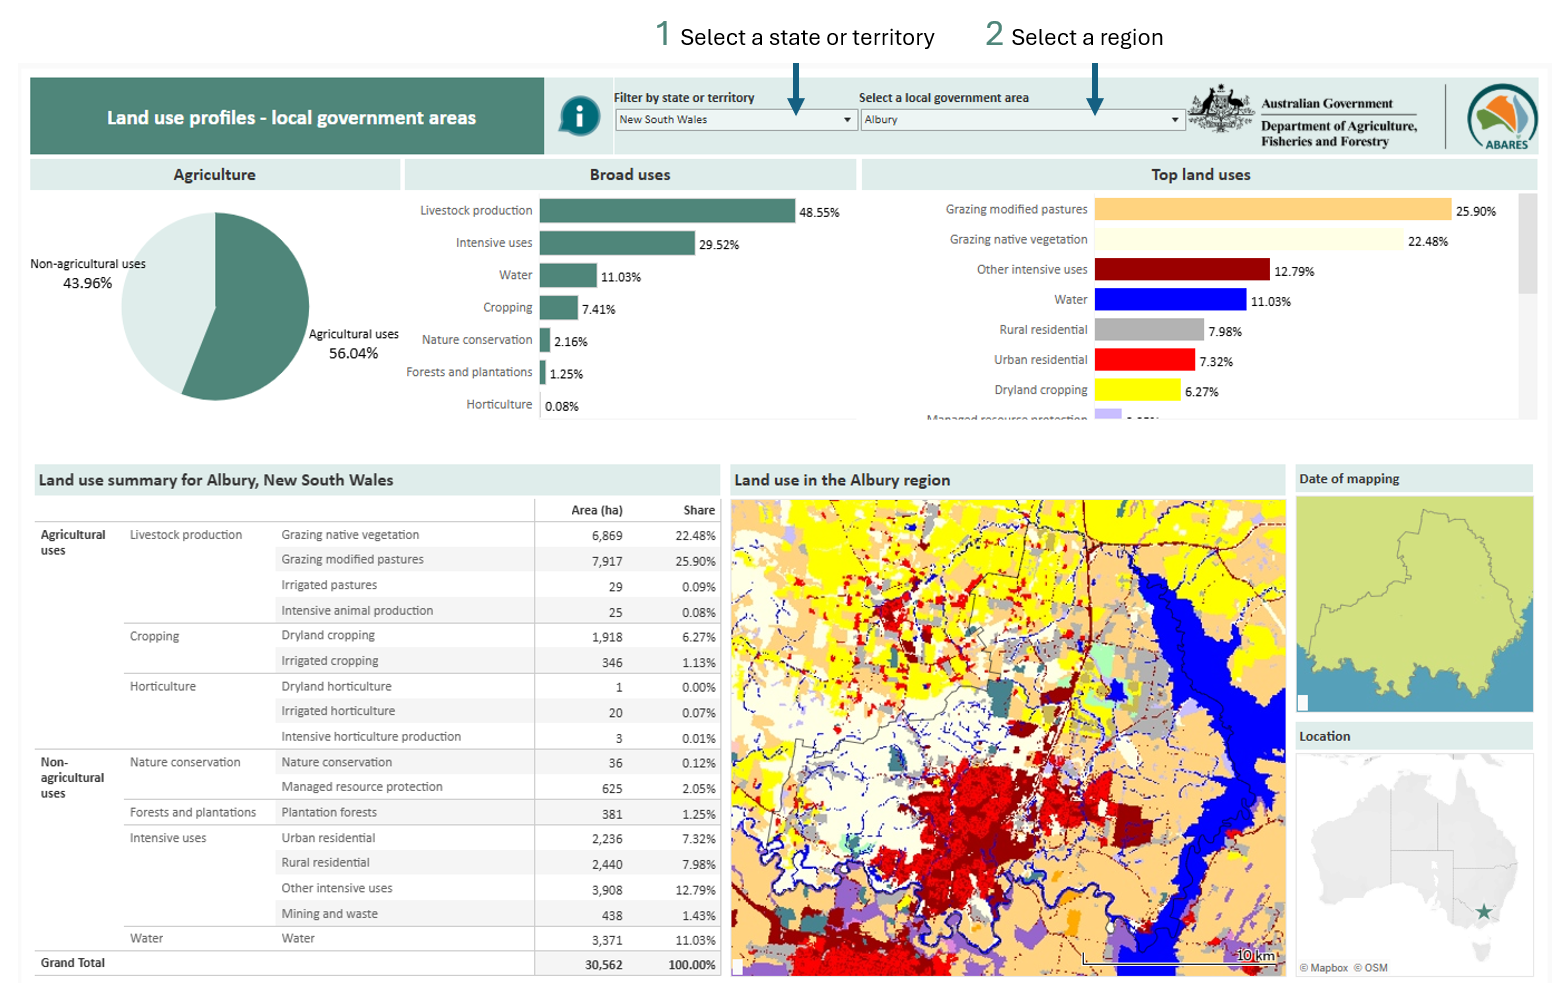
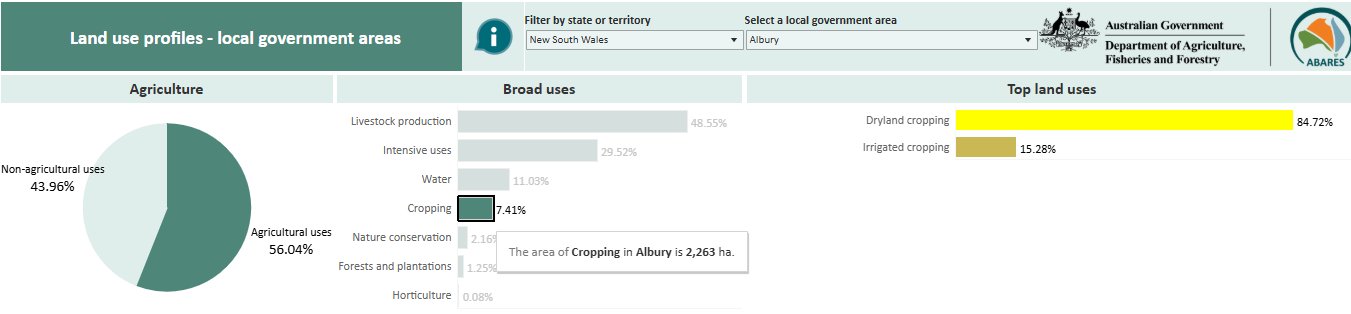
Figure 2. Click a chart slice or bar to filter the dashboard to show only that land use. Click again to see all the data. This example is filtered to cropping.

Image of Catchment scale land use profiles for New South Wales Local Government Area Albury showing charts filtered to cropping only.


Regions

  • States and territories (ABS 2021)
  • Natural Resource Management regions (DCCEEW 2023)
  • Local government areas (ABS 2023)

Land uses 

Land uses in the profiles Catchment Scale Land Use of Australia – Update December 2023 version 2 are mapped according to the Australian Land Use and Management Classification version 8 (ABARES 2016).

  • Land in transition are areas where the land use is unknown and cannot reasonable be inferred from the surrounding land use. Land has been (or is likely to be used for) agriculture or plantations.
  • Plantation forests includes commercial and other plantations. See the ABARES plantation statistics update for plantation data.

Extent

The Catchment scale land use data presented covers Australia's states and mainland territories and close off-shore islands, but not external territories. For example; land use is not shown for Christmas Island, Cocos (keeling) Island, Lord Howe Island, Norfolk Island, nor Boigu and Saibai islands in the Torres Strait.

  • ABS 2021, Australian Statistical Geography Standard (ASGS) Edition 3 - Main Structure and Greater Capital City Statistical Areas, July
  • ABS 2023, Local Government Areas, Australian Statistical Geography Standard (ASGS) Edition 3
  • ABARES 2024, Catchment Scale Land Use of Australia – Update December 2023 version 2, Australian Bureau of Agricultural and Resource Economics and Sciences, Canberra, February, CC BY 4.0, DOI: 10.25814/2w2p-ph98
  • ABARES 2016, Australian Land Use and Management Classification Version 8 (October 2016) 
  • DCCEEW 2023, Natural Resource Management regions, Department of Climate Change, Energy, the Environment and Water, August, CC BY 3.0
     

Summary data tables for each of the regions are also available for download on each dashboard page.

  • State and territory Catchment scale land use data table [107KB .xlslx] 
  • Natural Resource Management Region Catchment scale land use data table [303KB .xlslx]
  • Local government area Catchment scale land use data table [1.3MB .xsls]


States and territories

/abares/aclump/land-use/catchment-scale-land-use-reports-st

Use the dashboard

Natural Resource Management regions

/abares/aclump/land-use/catchment-scale-land-use-reports-nrm

Use the dashboard

Local government areas

/abares/aclump/land-use/catchment-scale-land-use-reports-lga

Use the dashboard

Web Map

Image of a web map showing land use and state boundaries for Australia


View the Web Map

Get spatial data

Catchment scale land use of Australia 2023 version 2 by simplified land use

Download the spatial data


Thanks for your feedback.
Thanks! Your feedback has been submitted.

We aren't able to respond to your individual comments or questions.
To contact us directly phone us or submit an online inquiry

CAPTCHA
This question is for testing whether or not you are a human visitor and to prevent automated spam submissions.

Please verify that you are not a robot.

Skip
Page last updated: 03 March 2025

We acknowledge the continuous connection of First Nations Traditional Owners and Custodians to the lands, seas and waters of Australia. We recognise their care for and cultivation of Country. We pay respect to Elders past and present, and recognise their knowledge and contribution to the productivity, innovation and sustainability of Australia’s agriculture, fisheries and forestry industries.

Artwork: Protecting our Country, Growing our Future
© Amy Allerton, contemporary Aboriginal Artist of the Gumbaynggirr, Bundjalung and Gamilaroi nations.

Footer

  • Contact us
  • Accessibility
  • Disclaimer
  • Privacy
  • FOI

© Department of Agriculture, Fisheries and Forestry

Facebook X LinkedIn Instagram