Skip to main content Skip to main navigation Skip to search
ABARES - Land use and management

Top navigation abares

  • Department
  • Ministers
  • Media Centre
Main menu

Main navigation ACLUMP

  • Land home
    Land home
  • About ACLUMP
    About ACLUMP
  • Land use
    Land use
  • Publications
    Publications
  • Data download
    Data download
  • Latest news
    Latest news
Department of Agriculture

Breadcrumb

  1. DAFF Home
  2. ABARES
  3. Land use and management
  4. Multi-Criteria Analysis Shell for Spatial Decision Support
  5. Quick Start Guide
  6. Introduction

Secondary ACLUMP

  • Quick Start Guide
    • 1. Introduction
    • 2. Set Up
    • 3. Input and Classification
    • 4. Composition and Comparison
    • 5. Building Criteria
    • 6. Reporting and Analysis
    • 7. Exporting

Introduction

​​The Problem

MCAS-S can assist in tracking the spread and increasing the effectiveness of control methods for invasive species. This guide is based on a simplified scenario of predicting the spread of a hypothetical invasive aquatic species across Australia.

If you have not already downloaded the template project or sample data and would like to follow along, it can be found in the Quick start guide.

Defining the Objective and Decision Criteria

For the purpose of this exercise, we have made some assumptions concerning the example species: "Dermatemys Exampilius"

  • It is a species of aquatic turtle.
  • The common method of arrival in Australia can be traced back to ports.
  • We have data outlining the climate envelope of the species.
  • The turtle cannot survive in high altitude environments.

In order to assess areas of possible establishment for the species across Australia, multiple criteria must be taken into account. In reality, many other criterion could be considered after consultation with a range of experts and stakeholders, the following are selected as a simple illustration:

  • Known presence: Data on where the species currently exists in Australia
  • Preferred habitat: The most suitable environments in which the species can live, based on a composition of climate data and proximity to bodies of water.
  • Proximity to ports: Distance from most likely entry point into Australia

The project template includes basic data on the locations of water bodies, locations of ports, the species' climate envelope and land elevation data.

Using this data as input, a means-to-an-end diagram can be constructed as follows:

Flow chart showing inputs, primary data, criteria and objective for the MCAS-S project

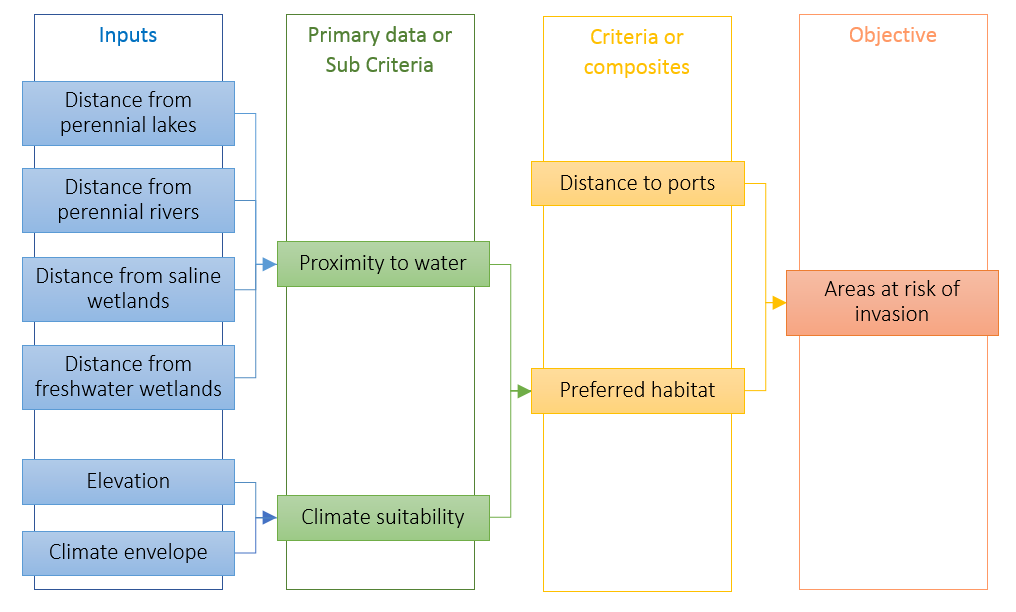
A means to an end diagram provides a structure to follow in creating an MCAS-S project. This process will also help to match the spatial and temporal scale of the input information and analysis to the objective.

Next Section: Set Up →

Contents

  1. Introduction
  2. Set Up
  3. Input and Classification
  4. Composition and Comparison
  5. Building Criteria
  6. Reporting and Analysis
  7. Exporting
Thanks for your feedback.
Thanks! Your feedback has been submitted.

We aren't able to respond to your individual comments or questions.
To contact us directly phone us or submit an online inquiry

CAPTCHA
This question is for testing whether or not you are a human visitor and to prevent automated spam submissions.

Please verify that you are not a robot.

Skip
Page last updated: 13 October 2021

We acknowledge the continuous connection of First Nations Traditional Owners and Custodians to the lands, seas and waters of Australia. We recognise their care for and cultivation of Country. We pay respect to Elders past and present, and recognise their knowledge and contribution to the productivity, innovation and sustainability of Australia’s agriculture, fisheries and forestry industries.

Artwork: Protecting our Country, Growing our Future
© Amy Allerton, contemporary Aboriginal Artist of the Gumbaynggirr, Bundjalung and Gamilaroi nations.

Footer

  • Contact us
  • Accessibility
  • Disclaimer
  • Privacy
  • FOI

© Department of Agriculture, Fisheries and Forestry

Facebook X LinkedIn Instagram