
Statistical reports can be generated for regions (saved in the Mask folder), points (saved in the Overlay folder), and to report on two input data layers within MCAS-S.
To view more specific details of your map layers, first check that you have the correct target mask(s) selected, right-click the chosen map and select Reporting.
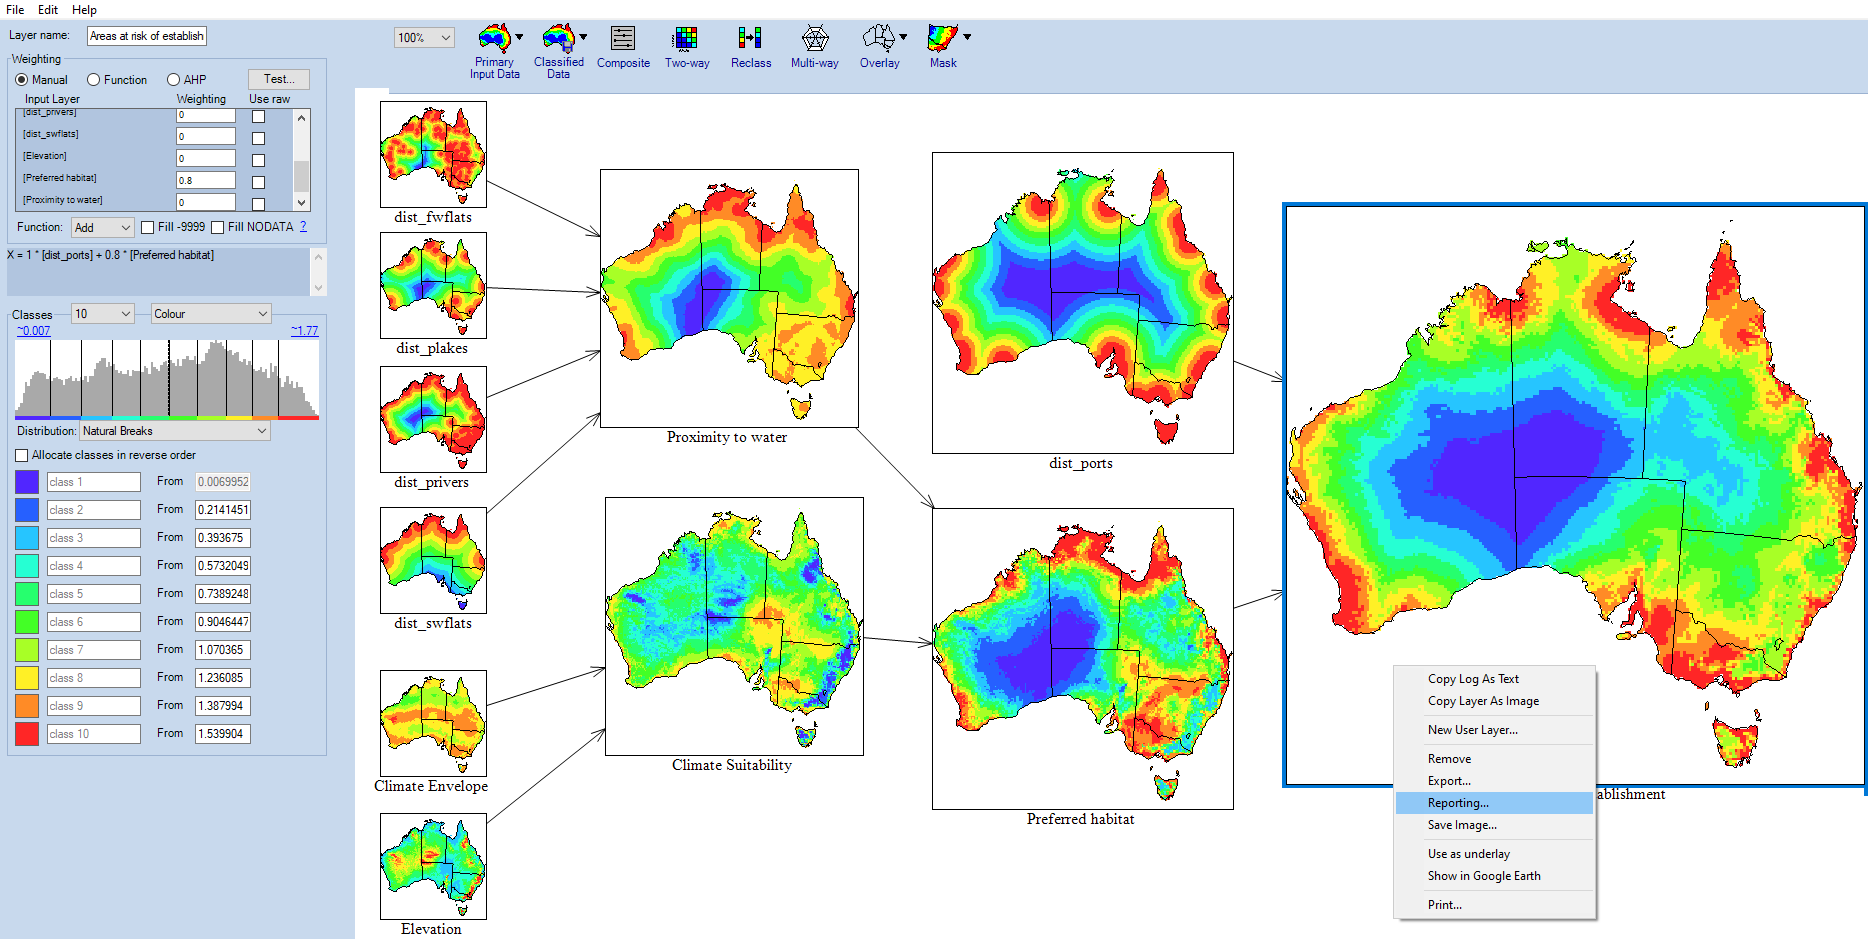
Select the type of report: Report by region, Report by point overlay, or Correlation report
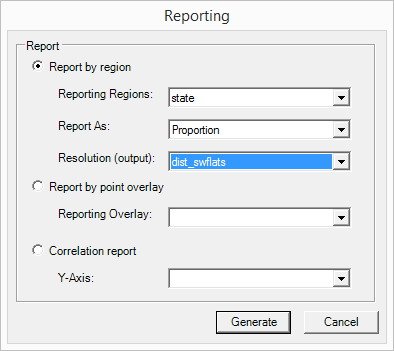
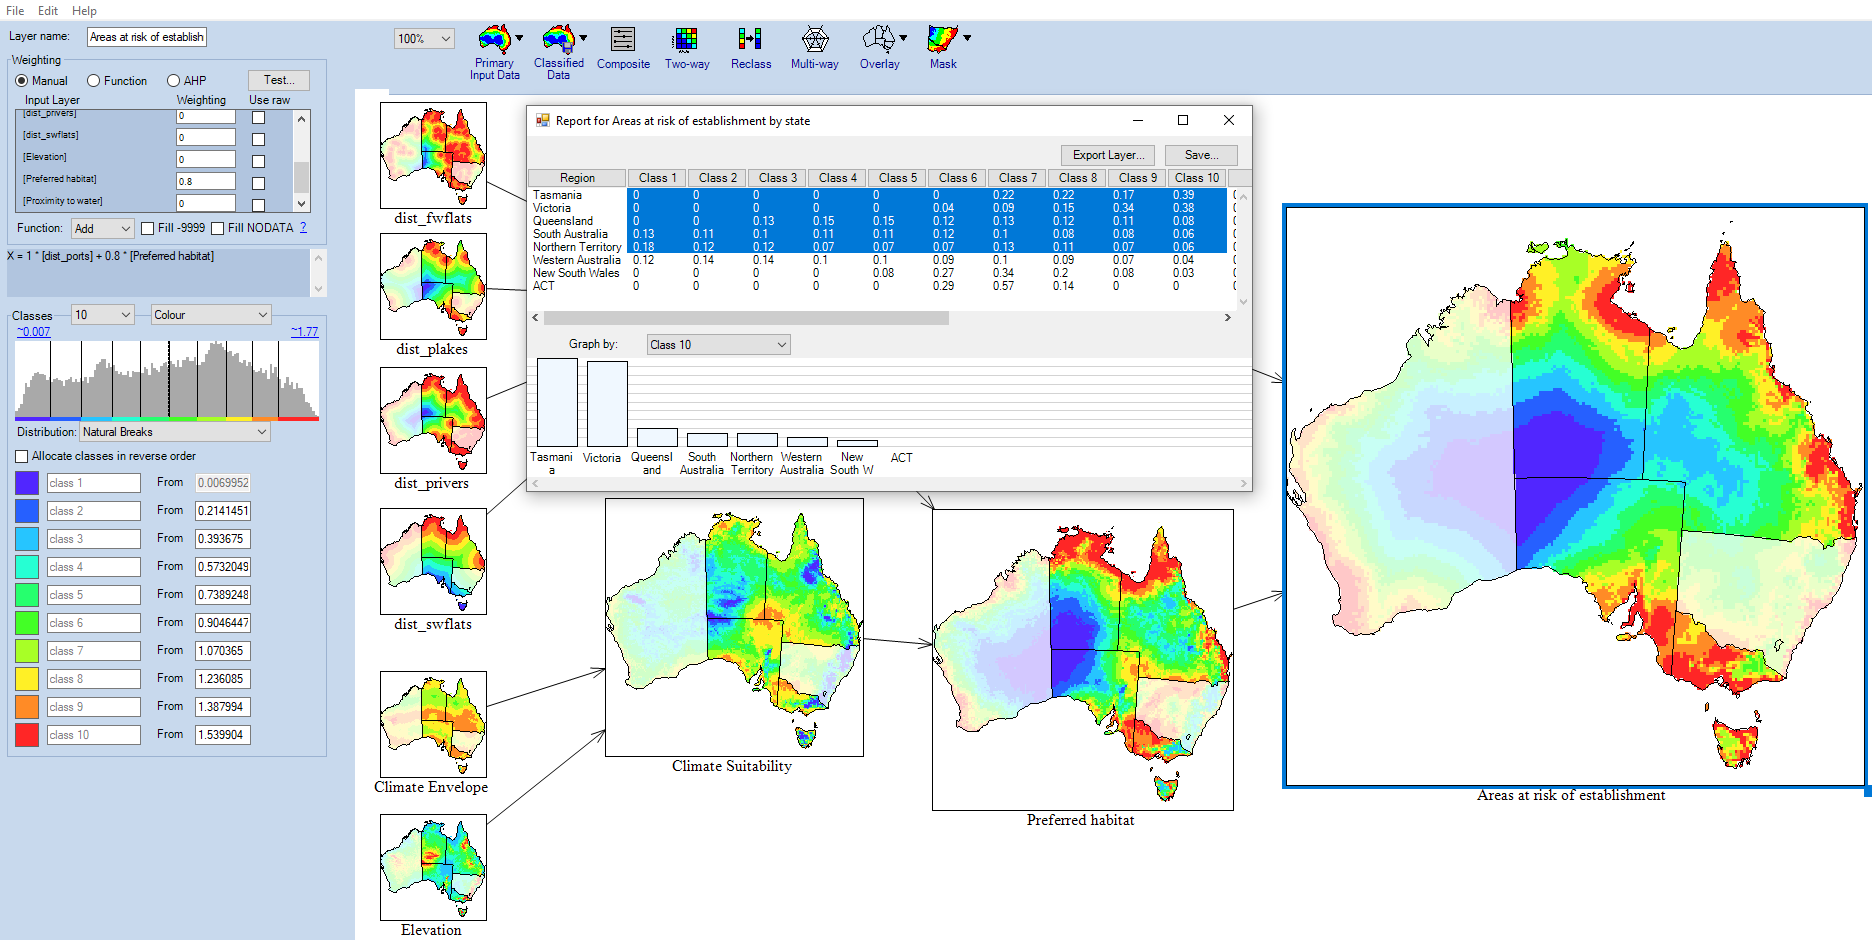
Report by region will generate statistics summarising pixels within regions that you choose from the mask data layers.
- The Proportion option calculates the proportion or fraction of cells in each class compared to the total number of pixels or cells in the region. This option is useful for comparing regions of different sizes where the relative proportion of the region is of interest. Proportional reports may be biased towards very small regions.
- Cell Counts option counts the number of cells or pixels in each region that fall into each class. This option is useful for estimating areas of each class in each reporting region. Cell counts may be biased towards larger regions.
Values under class attributes can be highlighted in the generated table. The highlighted selection will be highlighted in all relevant map windows.
Report by Point overlay will generate a table of the pixel values at point locations from an overlay. This will either show the class value for categorical data layer, or the raw value for continuous data layers; for example reporting on a primary layer of population by an overlay of capital cities will provide the pixel value for population at each capital city. A point overlay report for a composite, multi-way or two-way will show the scaled or class values for the pixels in the layer and the pixel values for all input layers.
Correlation report will shows similarities or correlation between two layers by generating a 'heat-map' or chart of the frequency of values in a layer plotted against another layer from the workspace. The correlation coefficient is provided at the bottom of the chart. The correlation report is more useful for comparing continuous primary data layers. Categorical data layers result in a blocky report.
More detailed information on reporting can be found in section 8.2 of the MCAS-S user guide.
← Previous Section: Building Criteria | Next Section: Exporting →