
Information on the latest global and Australian indicator prices for fertiliser-grade urea and import quantities. This dashboard also includes latest import information on other fertilisers.
Last update: 23 June 2026
Fertiliser grade urea
Key figures
Latest prices are as at 18 June 2026. Global indicator price is the Middle East FOB price, the conflict peak price was 22 April 2026. Australian indicator price is Geelong FCA price, the conflict peak price was 7 May 2026. Prices are sourced from Argus Media.
Urea imports
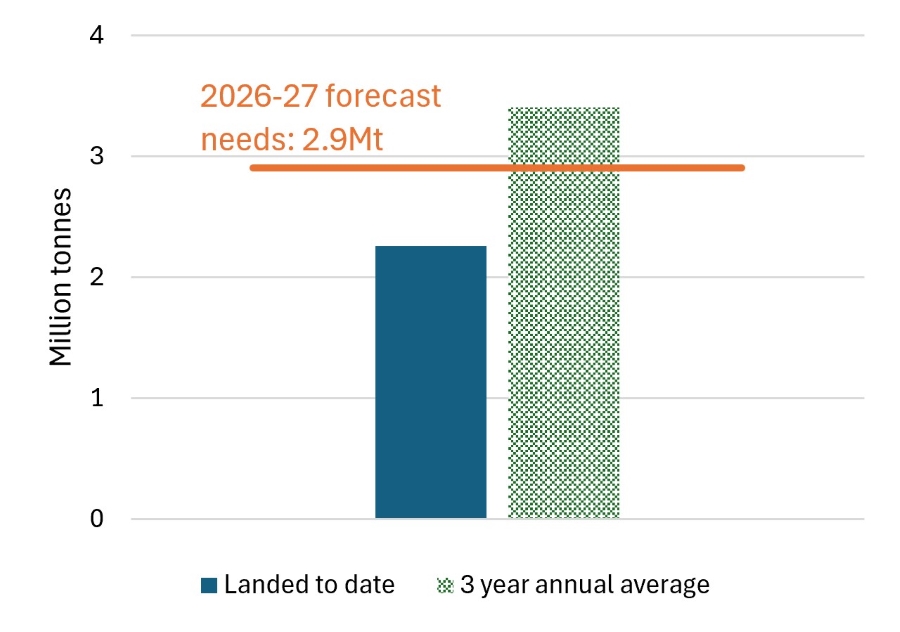
Note: “Landed to date” refers to period 1 November 2025 to 22 June 2026. “3 year annual average” is the average imported from 1 November to 30 October in the previous 3 years.
Understand nitrogen fertiliser needs
ABARES forecasts crop production in its quarterly Agricultural Commodities report. Based on ABARES June 2026 production forecasts, ABARES estimates that Australian agriculture requires around 1.9 million tonnes of nitrogen over the period November 2025-October 2026 to satisfy agronomic needs. Of this it is estimated that 70% (1.3 million tonnes of nitrogen) will come from 2.9 million tonnes of urea, leaving 0.6 million tonnes of nitrogen to be derived from other sources, e.g. MAP and DAP.
Import source of urea since 1 March 2026
| Source | Import volume |
|---|---|
| Malaysia | 0.31Mt |
| Brunei Darussalam | 0.26Mt |
| Nigeria | 0.25Mt |
| Indonesia | 0.24Mt |
| Oman | 0.18Mt |
| Qatar | 0.13Mt |
| Vietnam | 0.10Mt |
| All others | 0.23Mt |
Source: ICS.
Note: Import source of urea refers to consignment origin given in the ICS dataset. Data to 22 Jun 2026.
FFSF supported shipments of urea
Participating companies:
- Incitec Pivot
- CSBP
- Summit Fertilizers
10 trades completed totalling 340,000 tonnes.
128,000 tonnes landed under the scheme as at 23 June 2026.
Other fertilisers
Fertiliser type | Imports landed | % of 3-year average |
|---|---|---|
MAP | 1.30 Mt | 108% |
UAN | 0.45 Mt | 160% |
DAP | 0.17 Mt | 128% |
MOP | 0.37 Mt | 111% |
Superphosphates | 0.48 Mt | 201% |
SOA | 0.79 Mt | 281% |
NPK | 0.36 Mt | 146% |
Source: ICS, see notes below.
Different fertilisers play critical roles across the agriculture sector
| Fertiliser type | Important for | Key crops |
|---|---|---|
| Urea | Nitrogen increases yield potential, improves grain protein and supports biomass production. Primary uses are in broadacre cropping and pasture systems. | Wheat, barley, canola, sorghum, cotton, vegetables, orchards, vineyards, pastures (supports dairy pastures, grazing systems and hay and silage production). |
| MAP | Starter fertiliser for early root development and uniform crop establishment. | Wheat, barley, canola, lentils, chickpeas, lupins, sorghum, cotton, vegetables, potatoes, onions, melons, orchards, vineyards, nursery production and pasture establishment |
| UAN | Provided both rapid and sustained nitrogen availability and greater application flexibility across conditions. | Wheat, barley, cotton, sugarcane and horticulture. |
| MOP | Supports plant functions, improves grain quality, disease and frost resistance, and plant strength. | Horticulture, dairy pastures, cotton, sugarcane and some grains. |
| Superphosphates | Primarily used as phosphorus fertilisers for pastures and grazing systems. Supports root development. | Pastures, but also used in some cropping and horticultural applications where calcium is also required. |
| SOA | Used when both nitrogen and sulphur are required. | Canola, sugarcane, pastures and some horticulture. |
| DAP | Starter fertiliser that provides both phosphorus for early root development and higher nitrogen for early biomass production. | Wheat, barley, sorghum, cotton, sugarcane and some pasture establishment and horticultural applications. |
| NPK | Balanced fertiliser that supports vegetative growth, root development and water regulation and crop quality. | Horticulture, turf, sugarcane, cotton, intensive pastures. |
Historical import sources of Australian fertiliser
Fertiliser | Import source | Share of imports over 2023-2025 |
|---|---|---|
Ammonium nitrate | Vietnam | 24% |
| Korea, Republic of (South) | 22% | |
| Lithuania | 17% | |
| Indonesia | 14% | |
| Thailand | 13% | |
DAP | China (excludes SARs and Taiwan) | 42% |
| Saudi Arabia* | 30% | |
| Morocco | 22% | |
| Vietnam | 2% | |
| Oman | 2% | |
MAP | Morocco | 39% |
| Saudi Arabia* | 28% | |
| China (excludes SARs and Taiwan) | 22% | |
| United States of America | 9% | |
| Jordan | 1% | |
MOP | Canada | 63% |
| Jordan | 15% | |
| United States of America | 12% | |
| Germany | 6% | |
| Israel | 1% | |
NPK | Korea, Republic of (South) | 30% |
| China (excludes SARs and Taiwan) | 24% | |
| Finland | 6% | |
| Netherlands | 6% | |
| Belgium | 6% | |
SOA | China (excludes SARs and Taiwan) | 96% |
| Thailand | 2% | |
| Korea, Republic of (South) | 1% | |
| Canada | 0% | |
| Indonesia | 0% | |
SOP | Germany | 63% |
| Taiwan | 19% | |
| Indonesia | 8% | |
| Belgium | 2% | |
| United States of America | 2% | |
Superphosphates | China (excludes SARs and Taiwan) | 80% |
| Egypt | 18% | |
| Morocco | 1% | |
| Indonesia | 0% | |
| Vietnam | 0% | |
UAN | United States of America | 86% |
| China (excludes SARs and Taiwan) | 11% | |
| Lithuania | 3% | |
| India | <1% | |
| Canada | <1% | |
Urea | United Arab Emirates* | 23% |
| Saudi Arabia* | 17% | |
| Qatar* | 17% | |
| Malaysia | 11% | |
| Indonesia | 10% |
*Indicates import sources with ports beyond the Strait of Hormuz.
Date sourced from ABS, International Trade in Goods.
Notes on ICS data used on this page:
Entities (importers, brokers, etc.) importing goods into Australia are required to enter import details into the Department of Home Affairs’ Integrated Cargo System (ICS).
The Department of Agriculture, Fisheries and Forestry (DAFF) does not have direct access to the data stores behind ICS, nor to its warehouse. This report is built on a curated data model derived from the ICS5 Data Feed.
Limitations:
The data is subject to change over time. Data in ICS can be amended by the importing party prior to and after a consignment arrives in Australia. To manage this, totals are rounded to two significant figures.
‘Landed’ refers to goods that arrived in Australia on or before the date specified in this report. The “% of 3 year average” data is presented for comparison purposes, and is not intended as a strict representation of current fertiliser demand. Demand for different fertiliser types will be affected by price, crop type, domestic production, and seasonal conditions, all of which can vary from year to year.
Withdrawn and deleted cargo reports and declarations have been excluded from the dataset.