
Discover ABARES research through a variety of infographics and graphs. For the latest releases from ABARES visit the Products page.
Regular publications
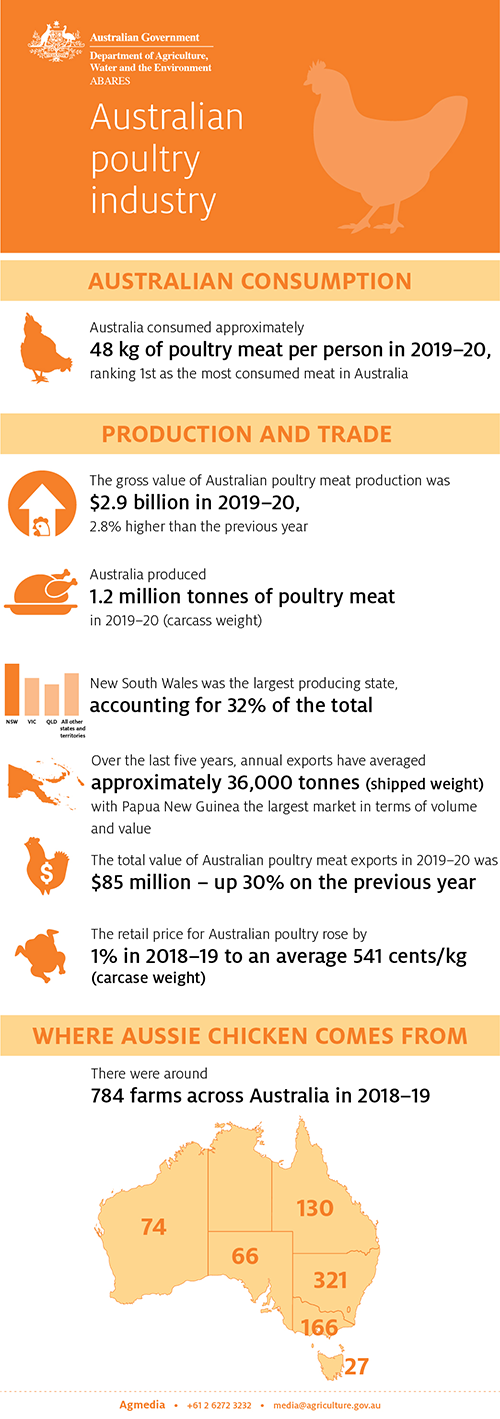
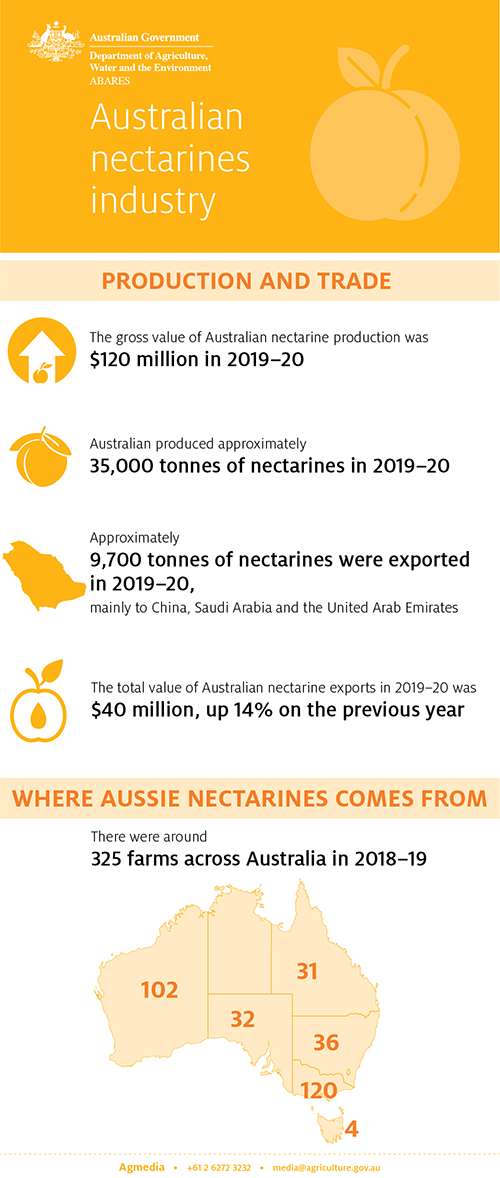
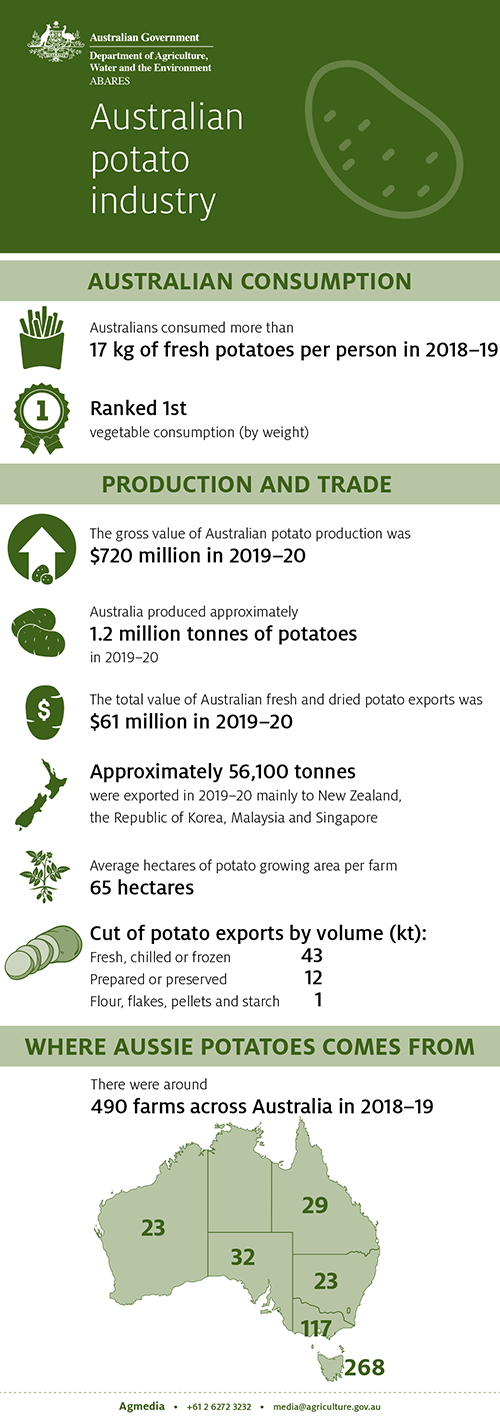
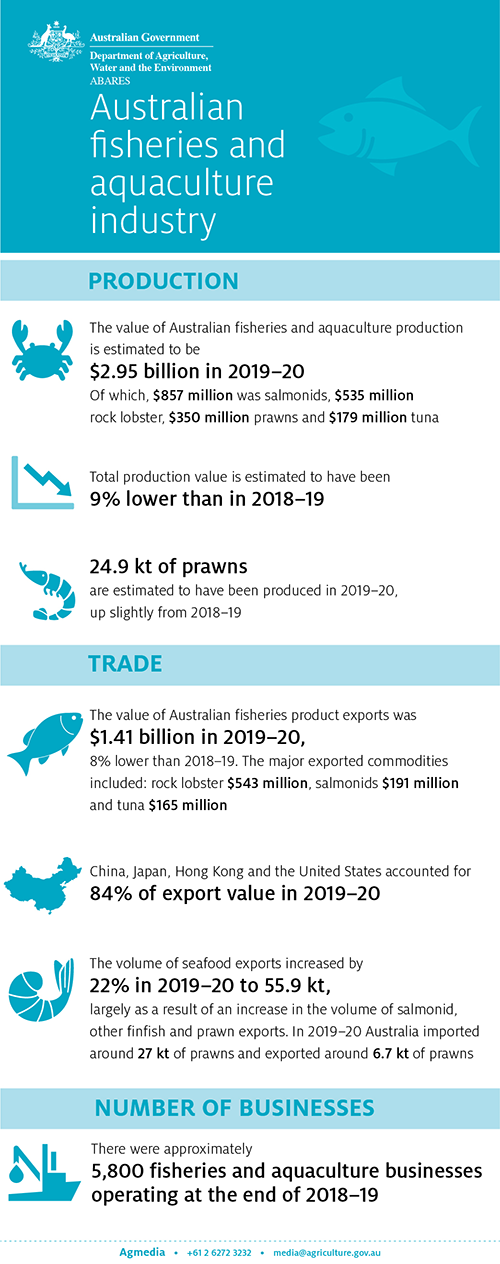
This is a selection of infographics from the Snapshot of Australian Agriculture. For more infographics and the full report, visit Snapshot of Australian Agriculture - DAFF
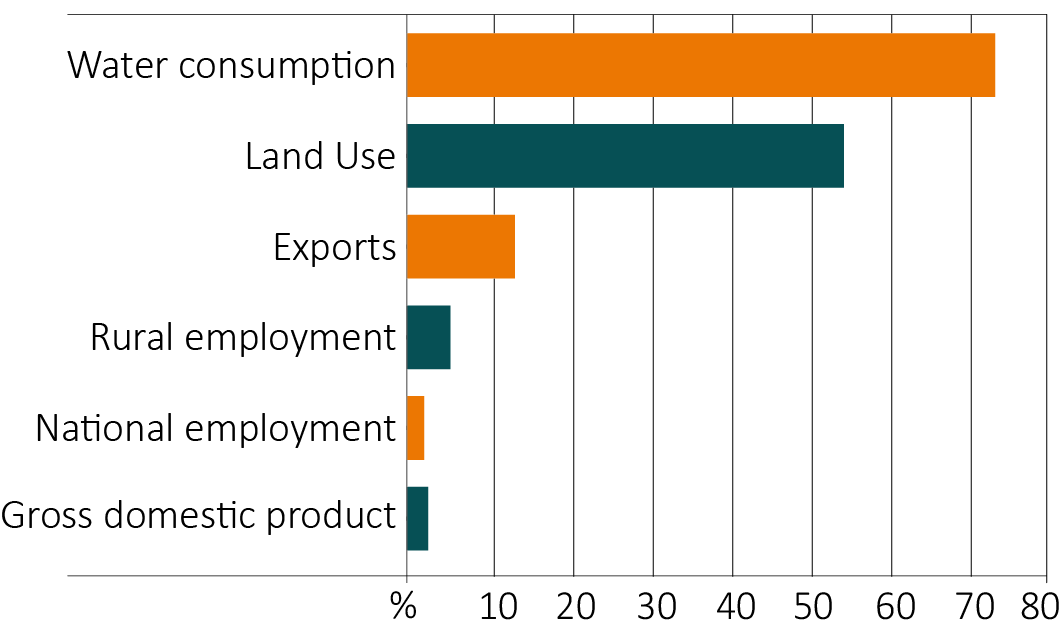
Selected contributions of agriculture
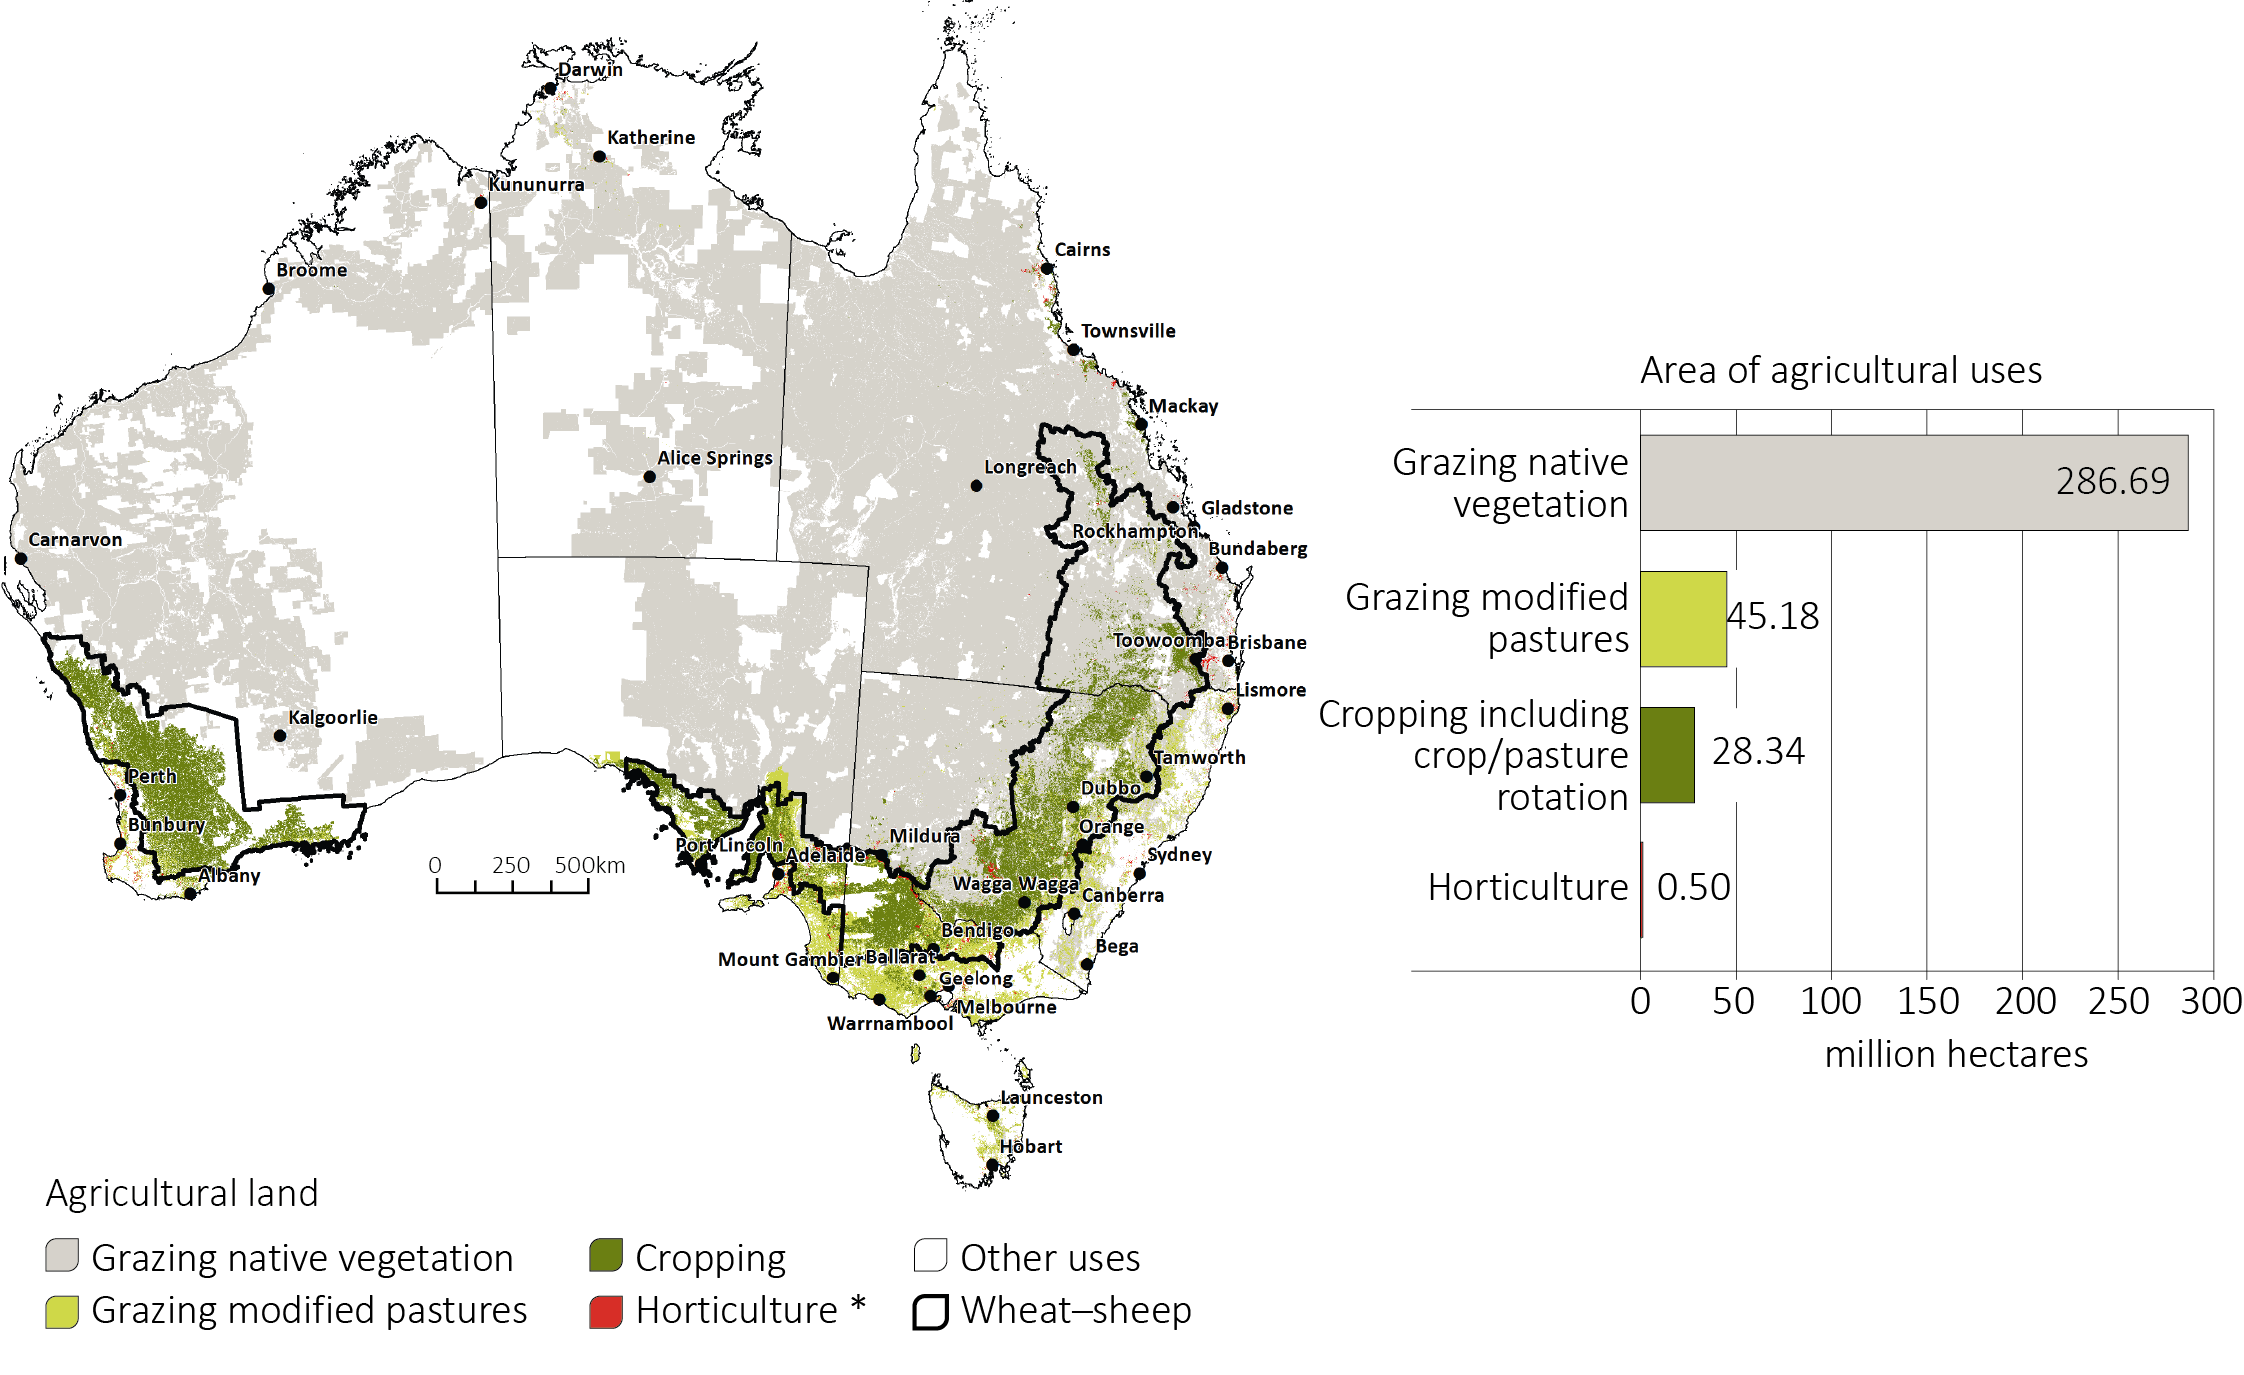
Agriculture production zone
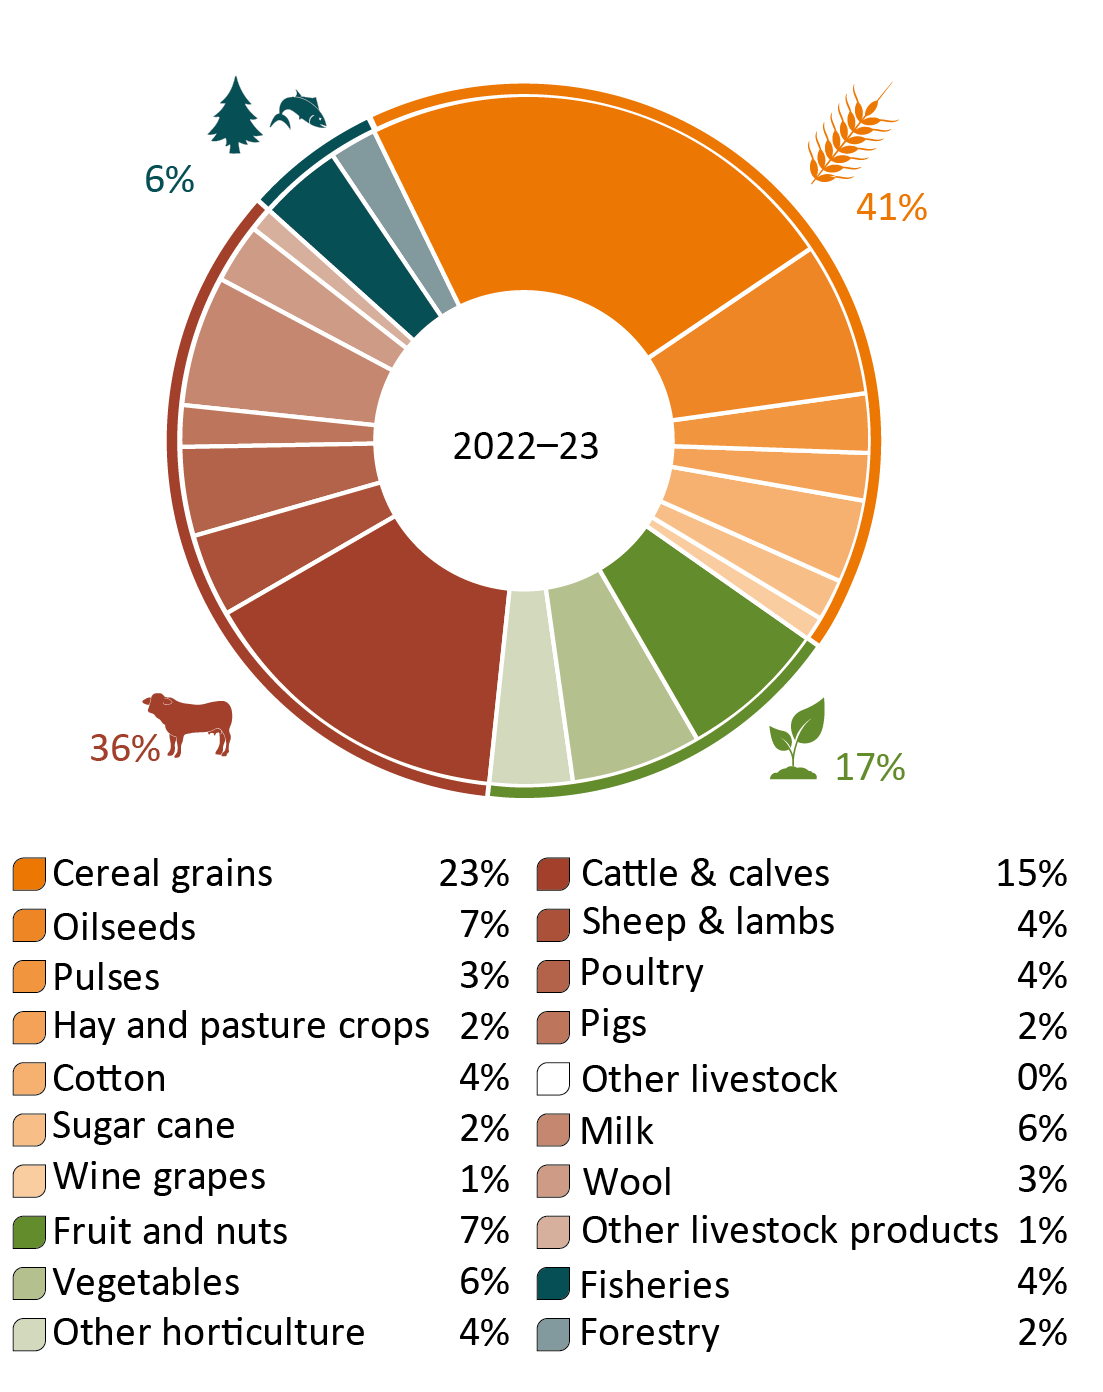
Agriculture, fisheries and forestry value of production, by commodity, 2022–23
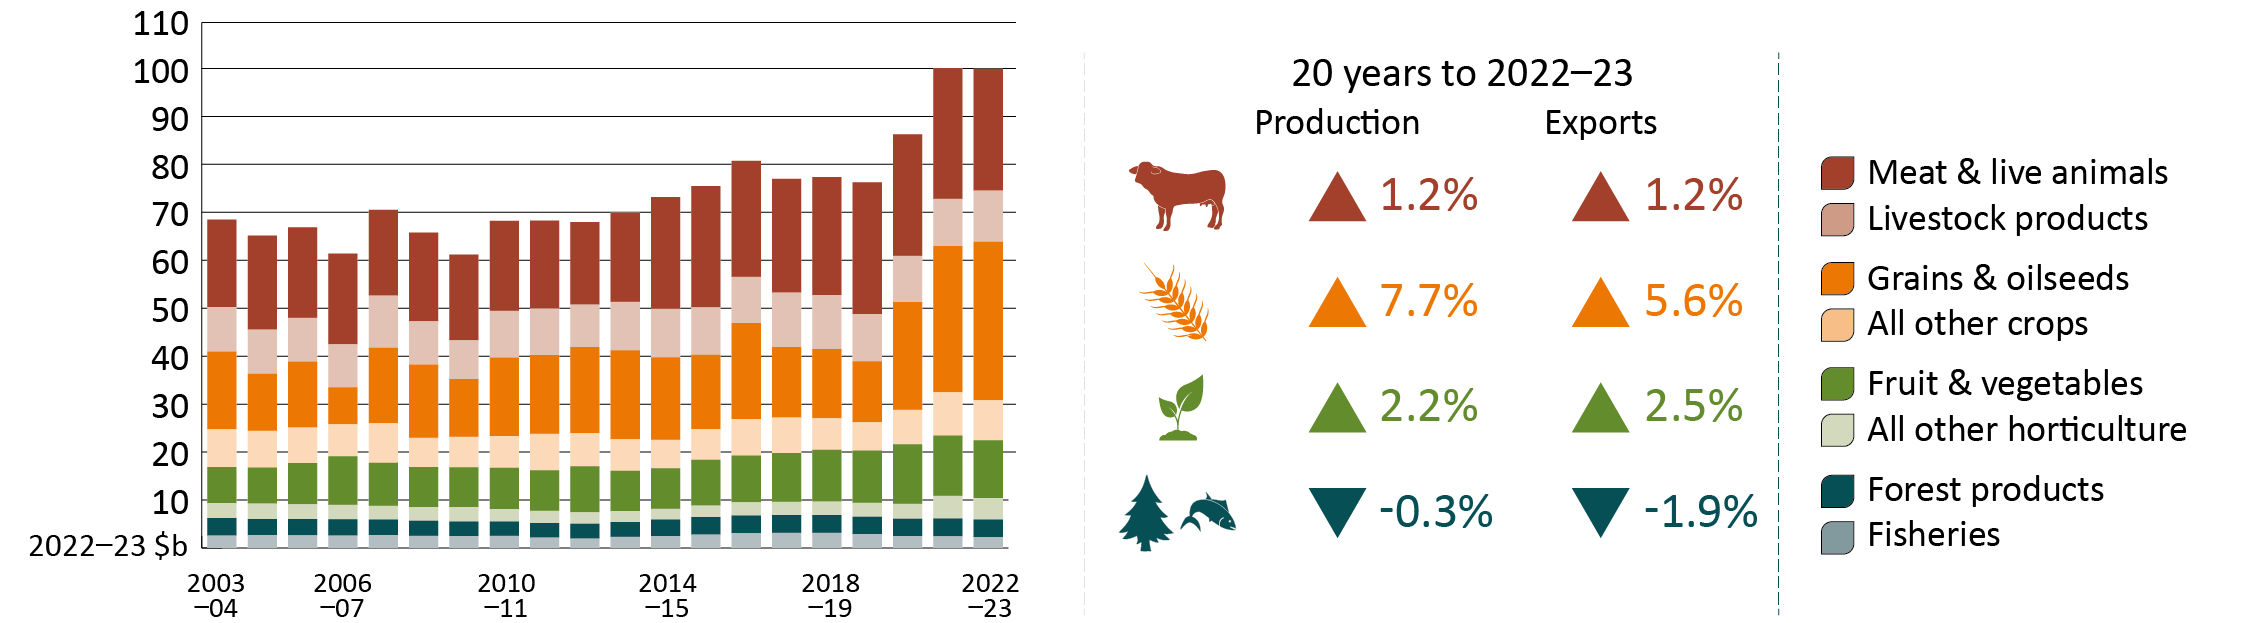
Agriculture, fisheries and forestry production over 20 years to 2022-23
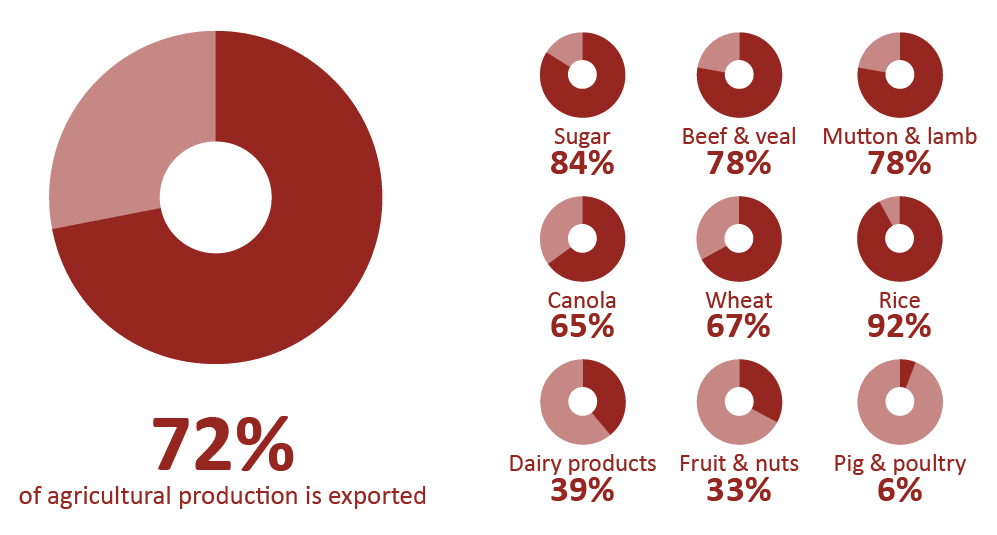
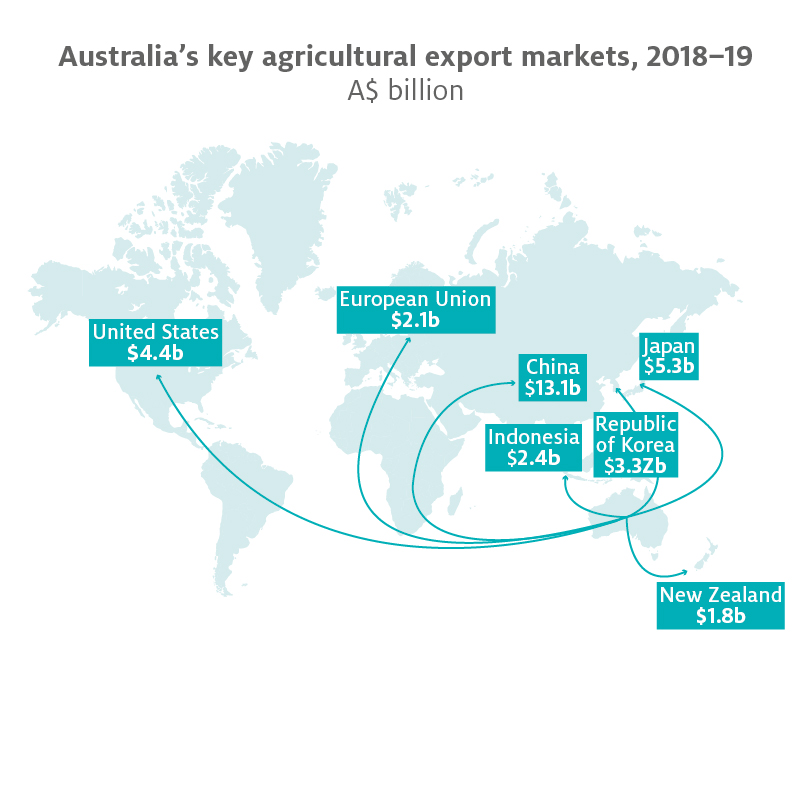
Australian agriculture export breakdown
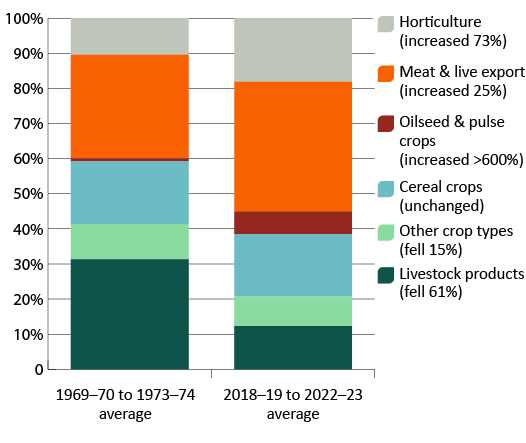
Volume of agricultural output by commodity – a comparison
Read the latest Agricultural Outlook
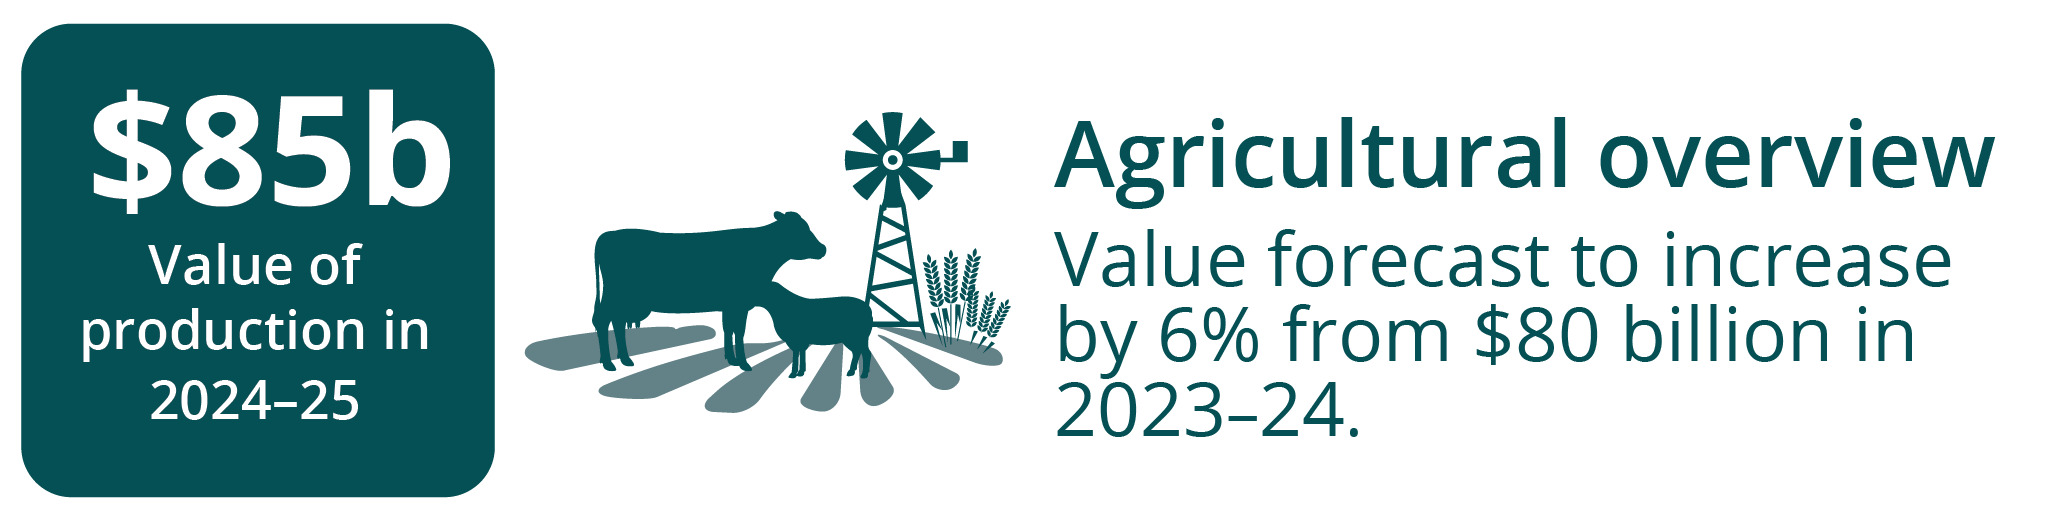
Agricultural overview – March quarter 2024
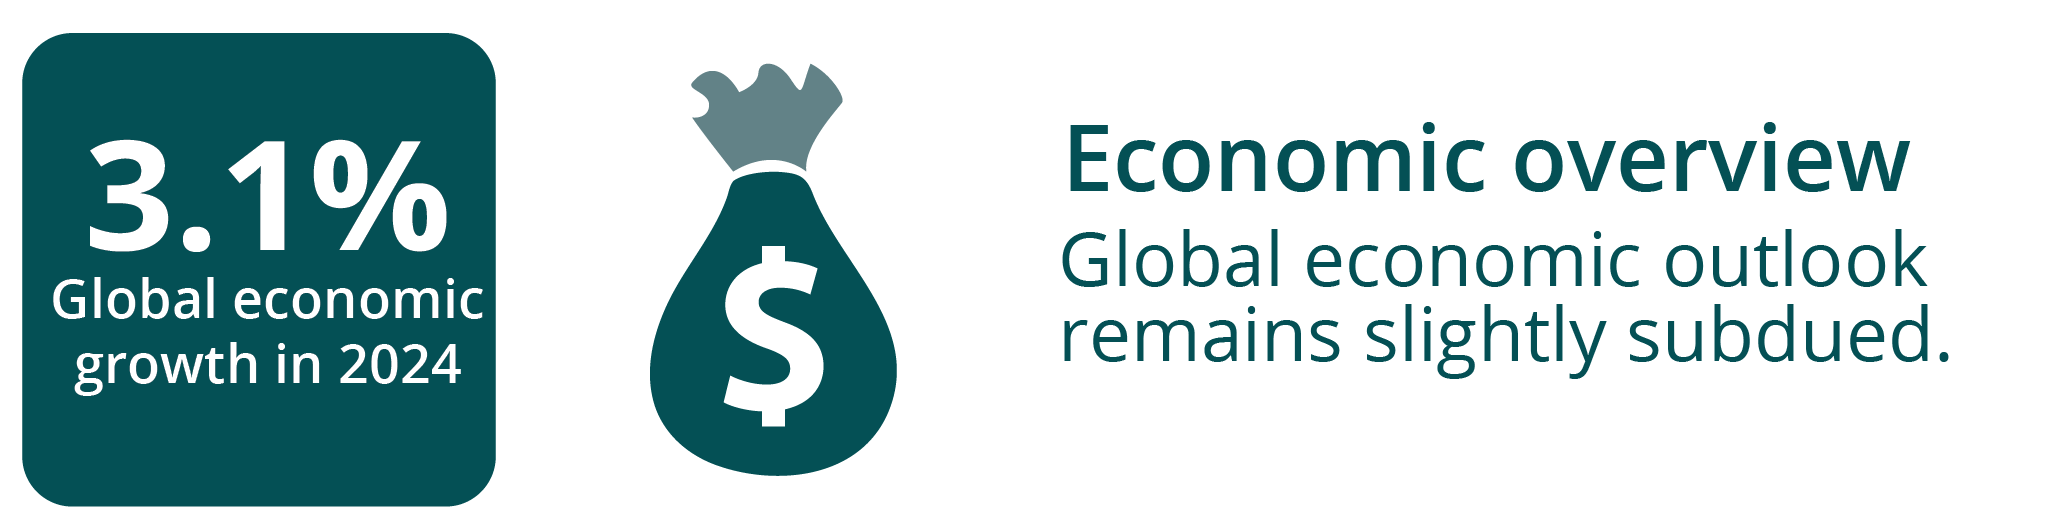
Economic overview – March quarter 2024
Seasonal conditions – March quarter 2024
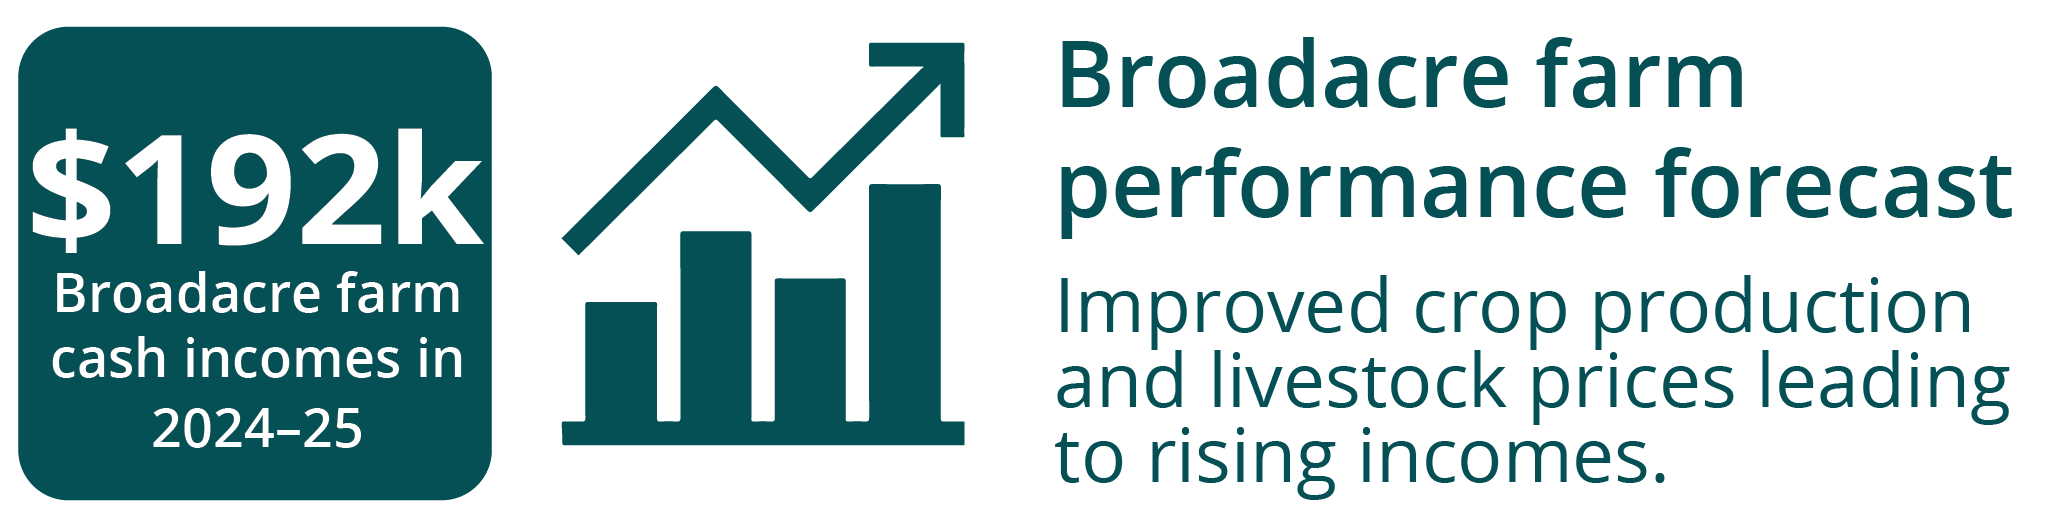
Farm performance – March quarter 2024
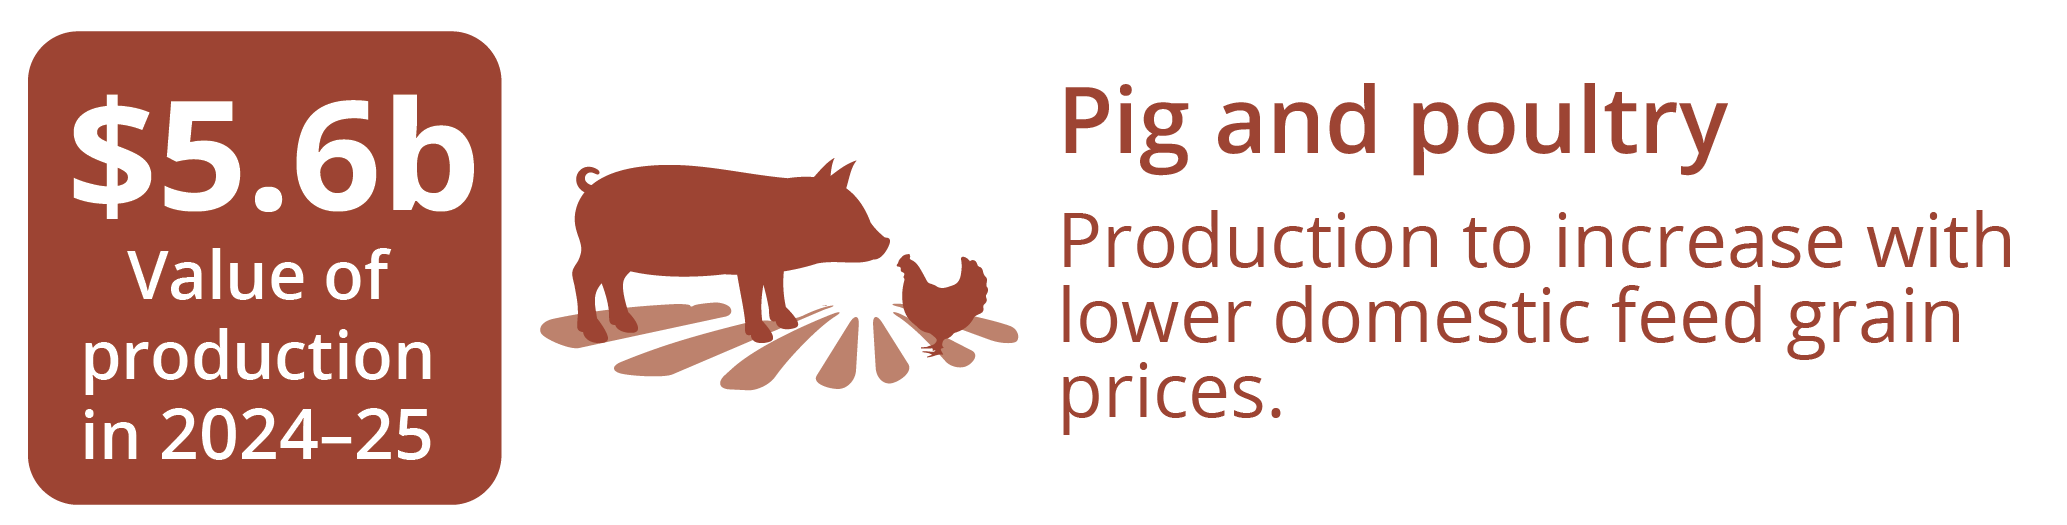
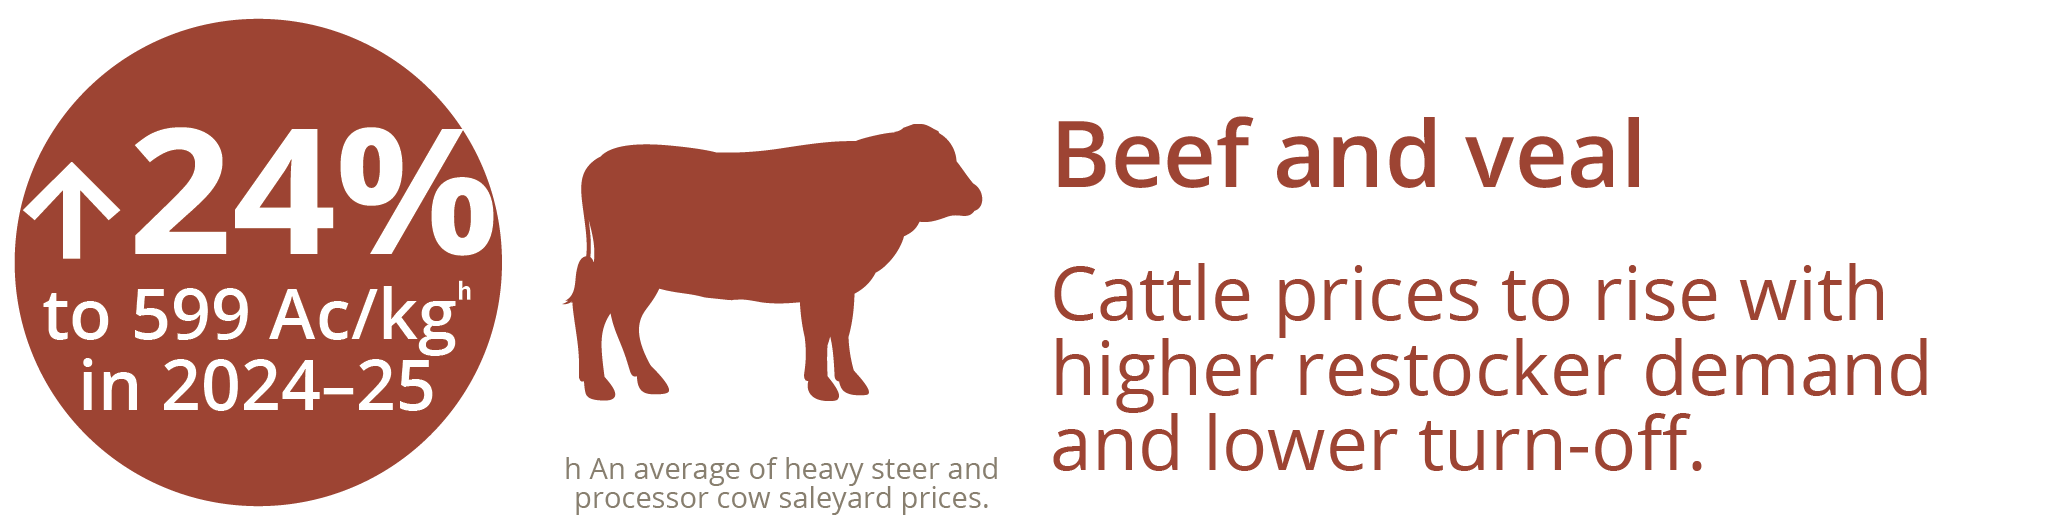
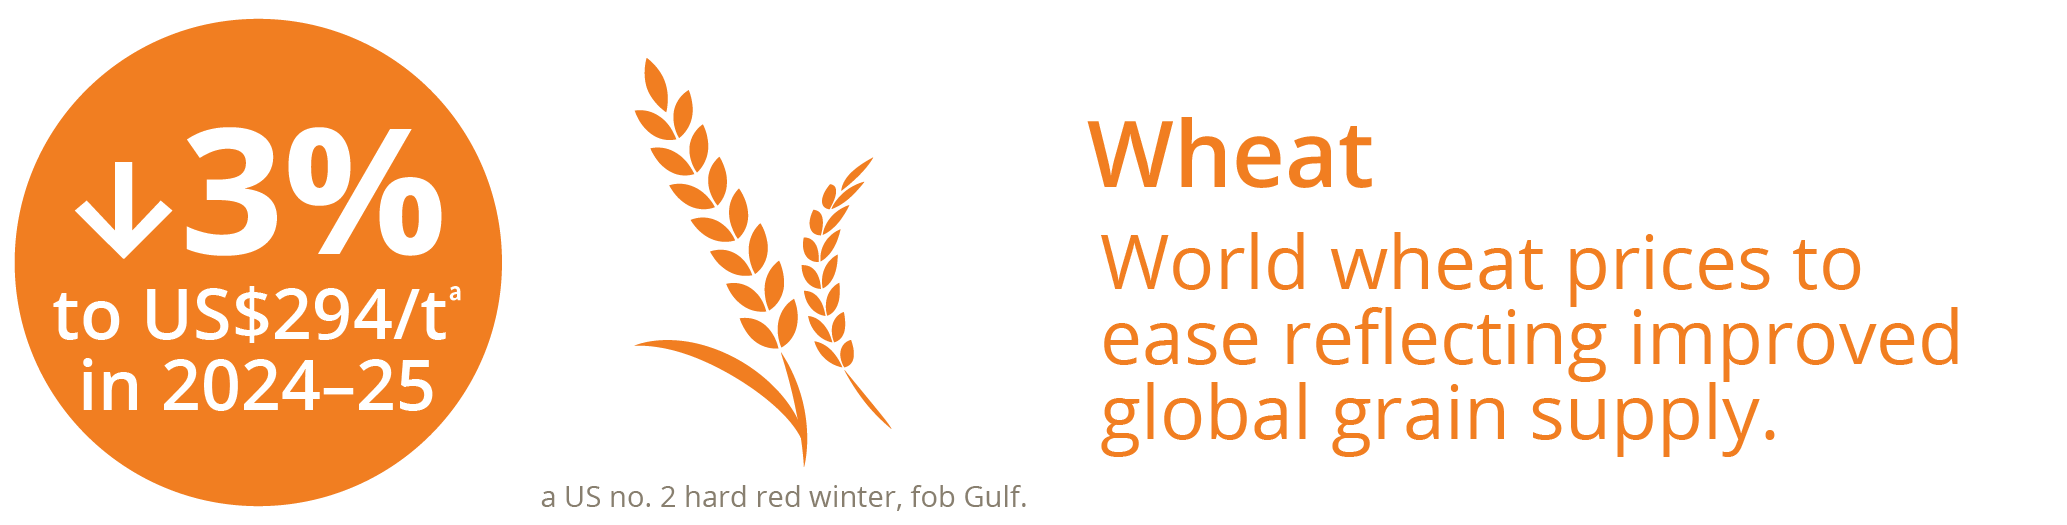
Commodities – March quarter 2024
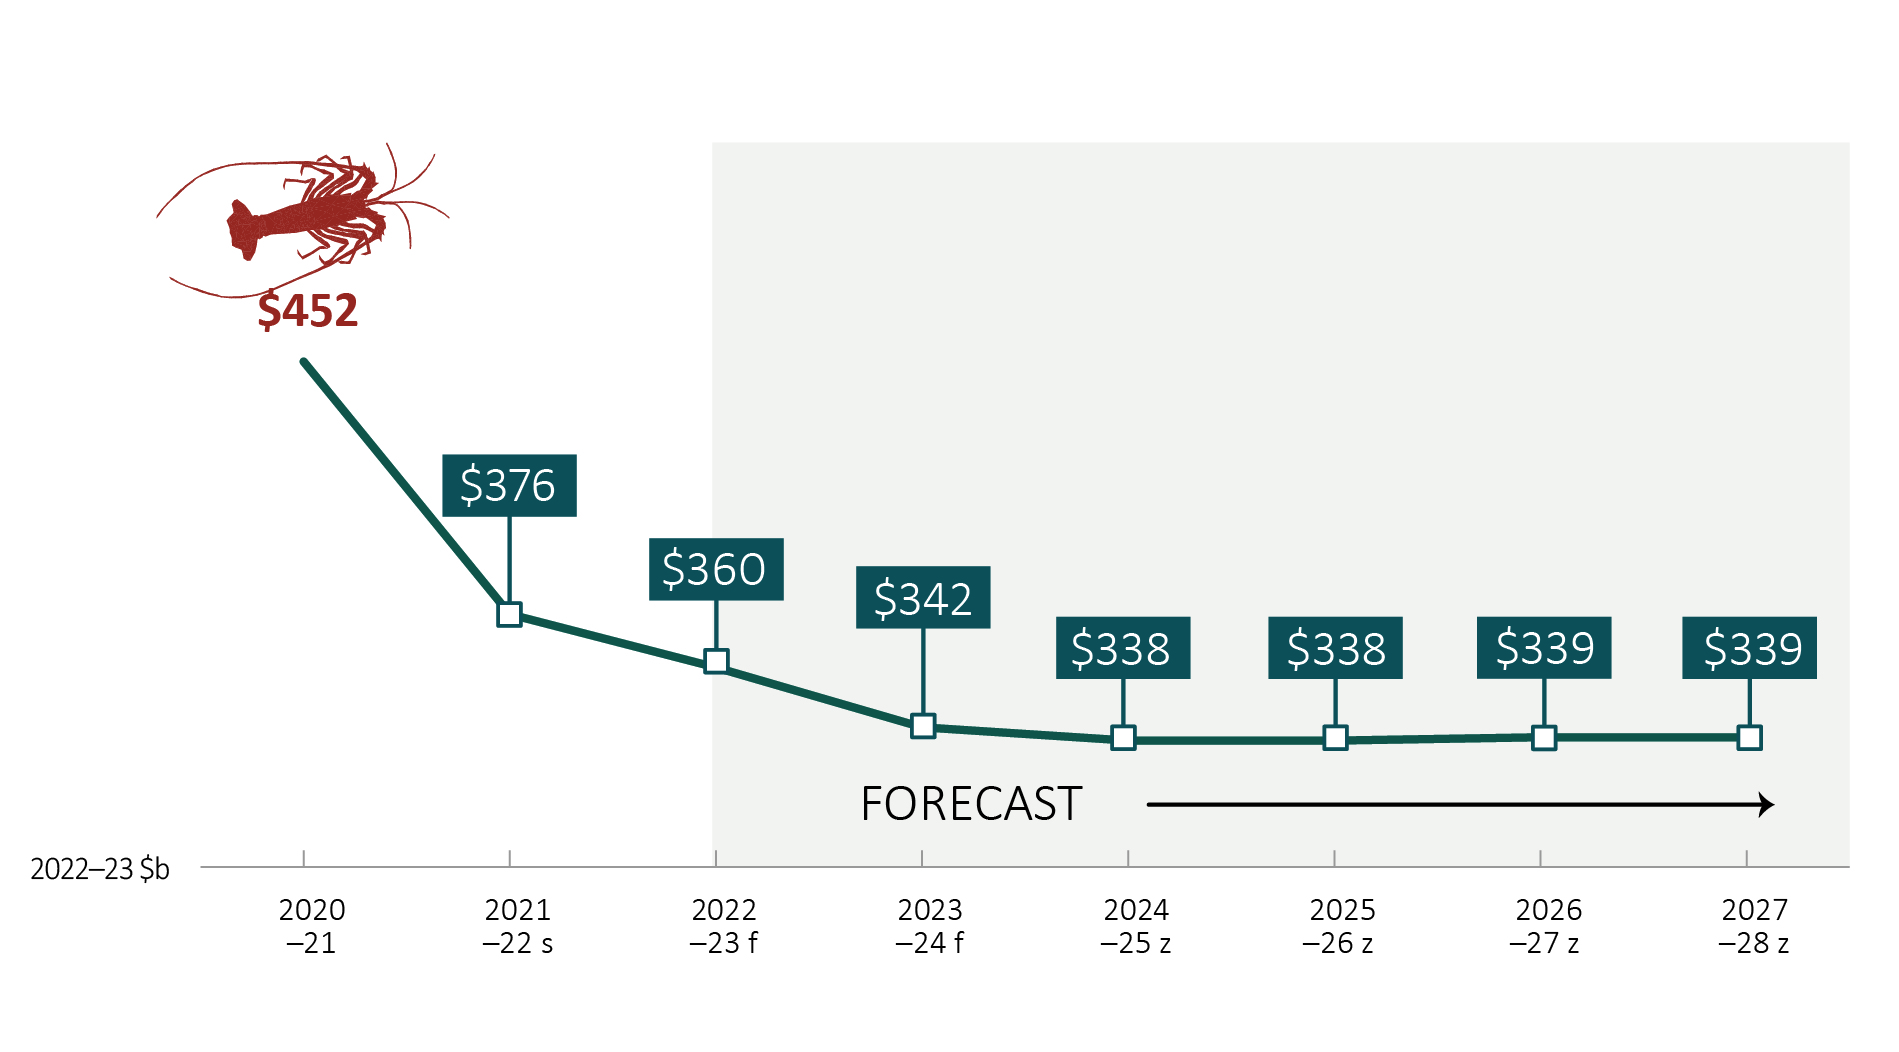
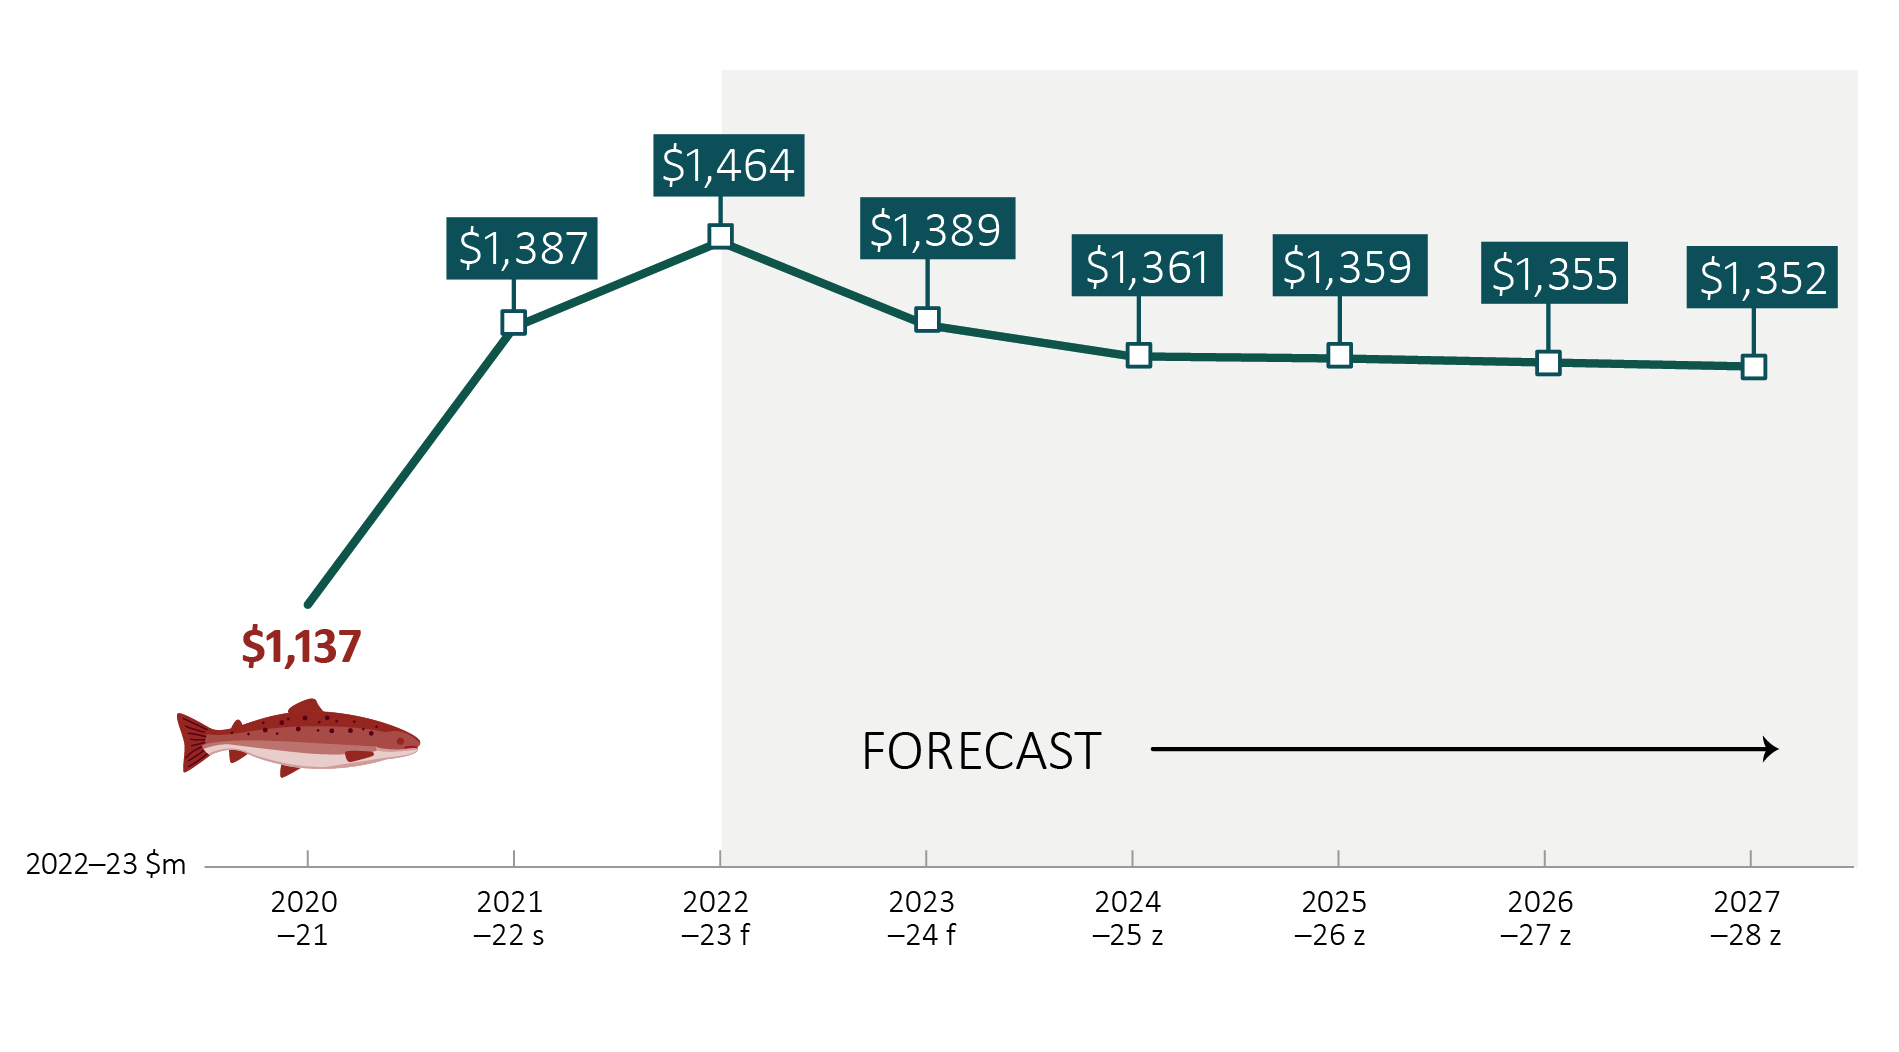
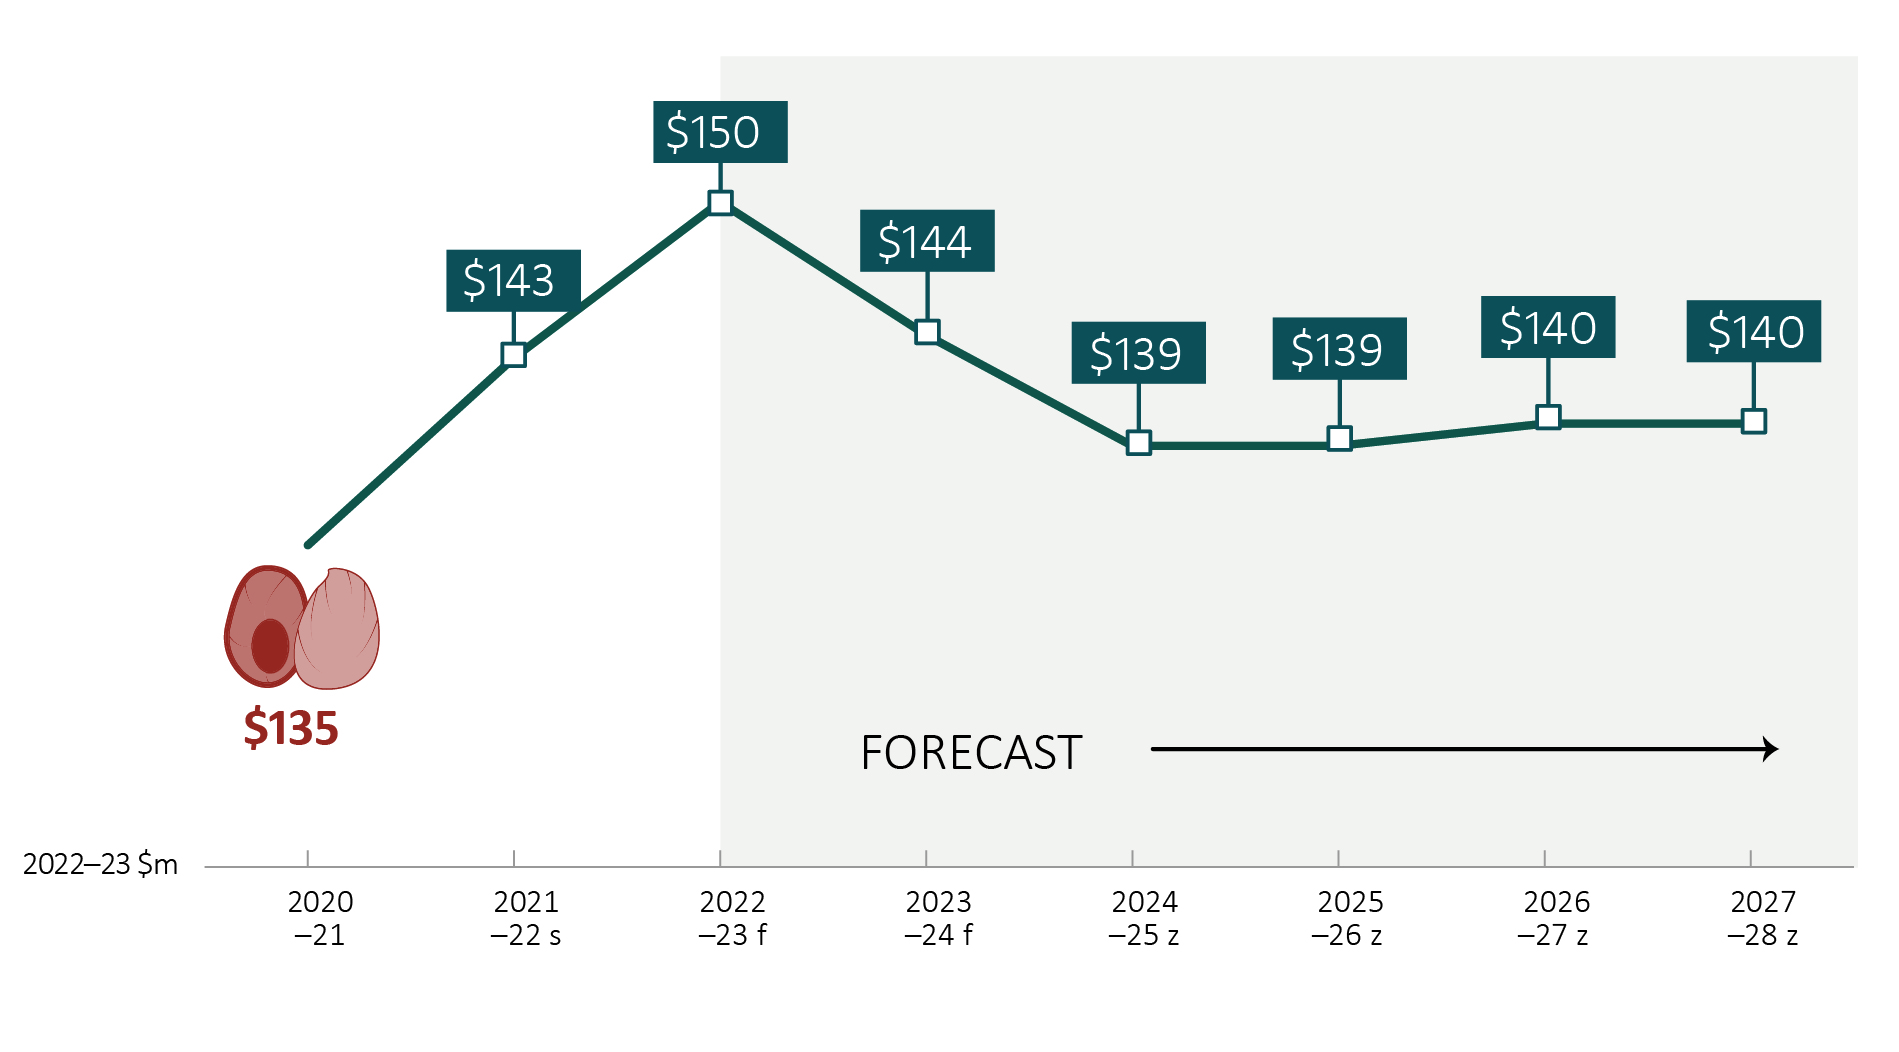
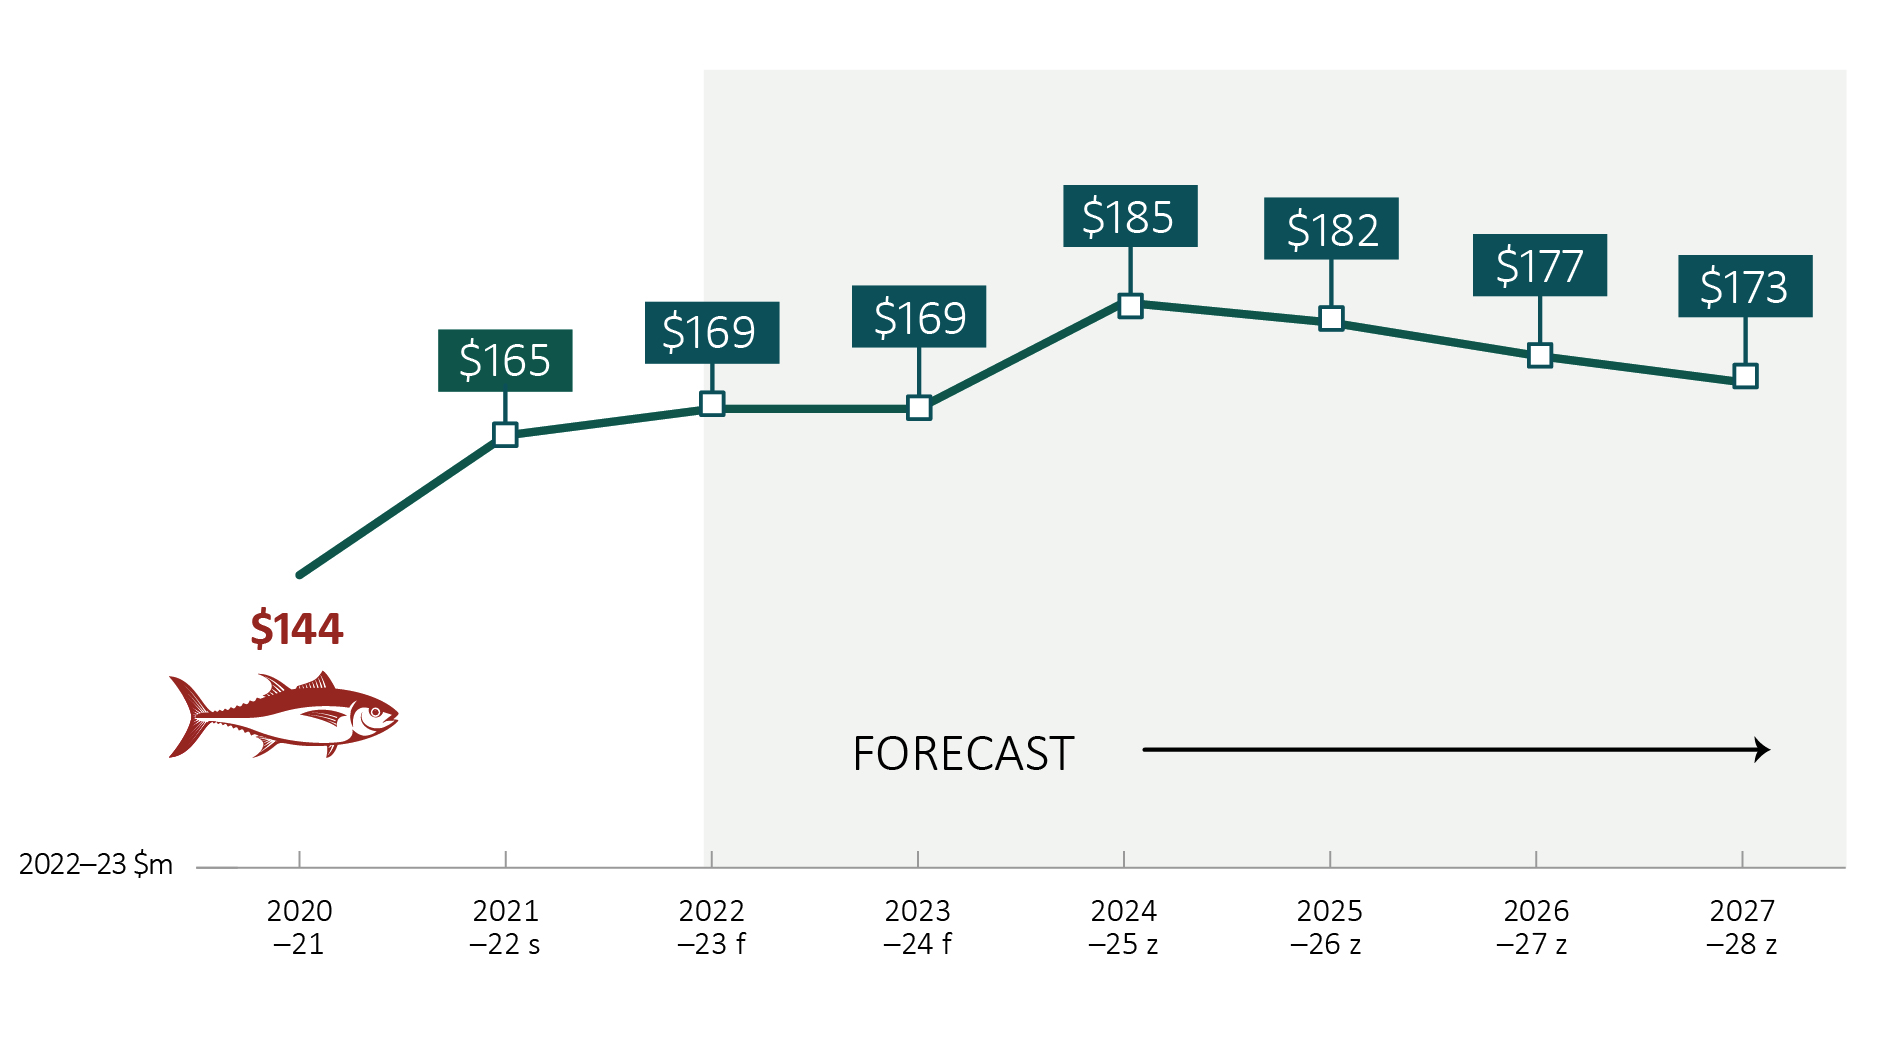
For full forecasts, including production volume and export value, visit Australian fisheries and aquaculture outlook.
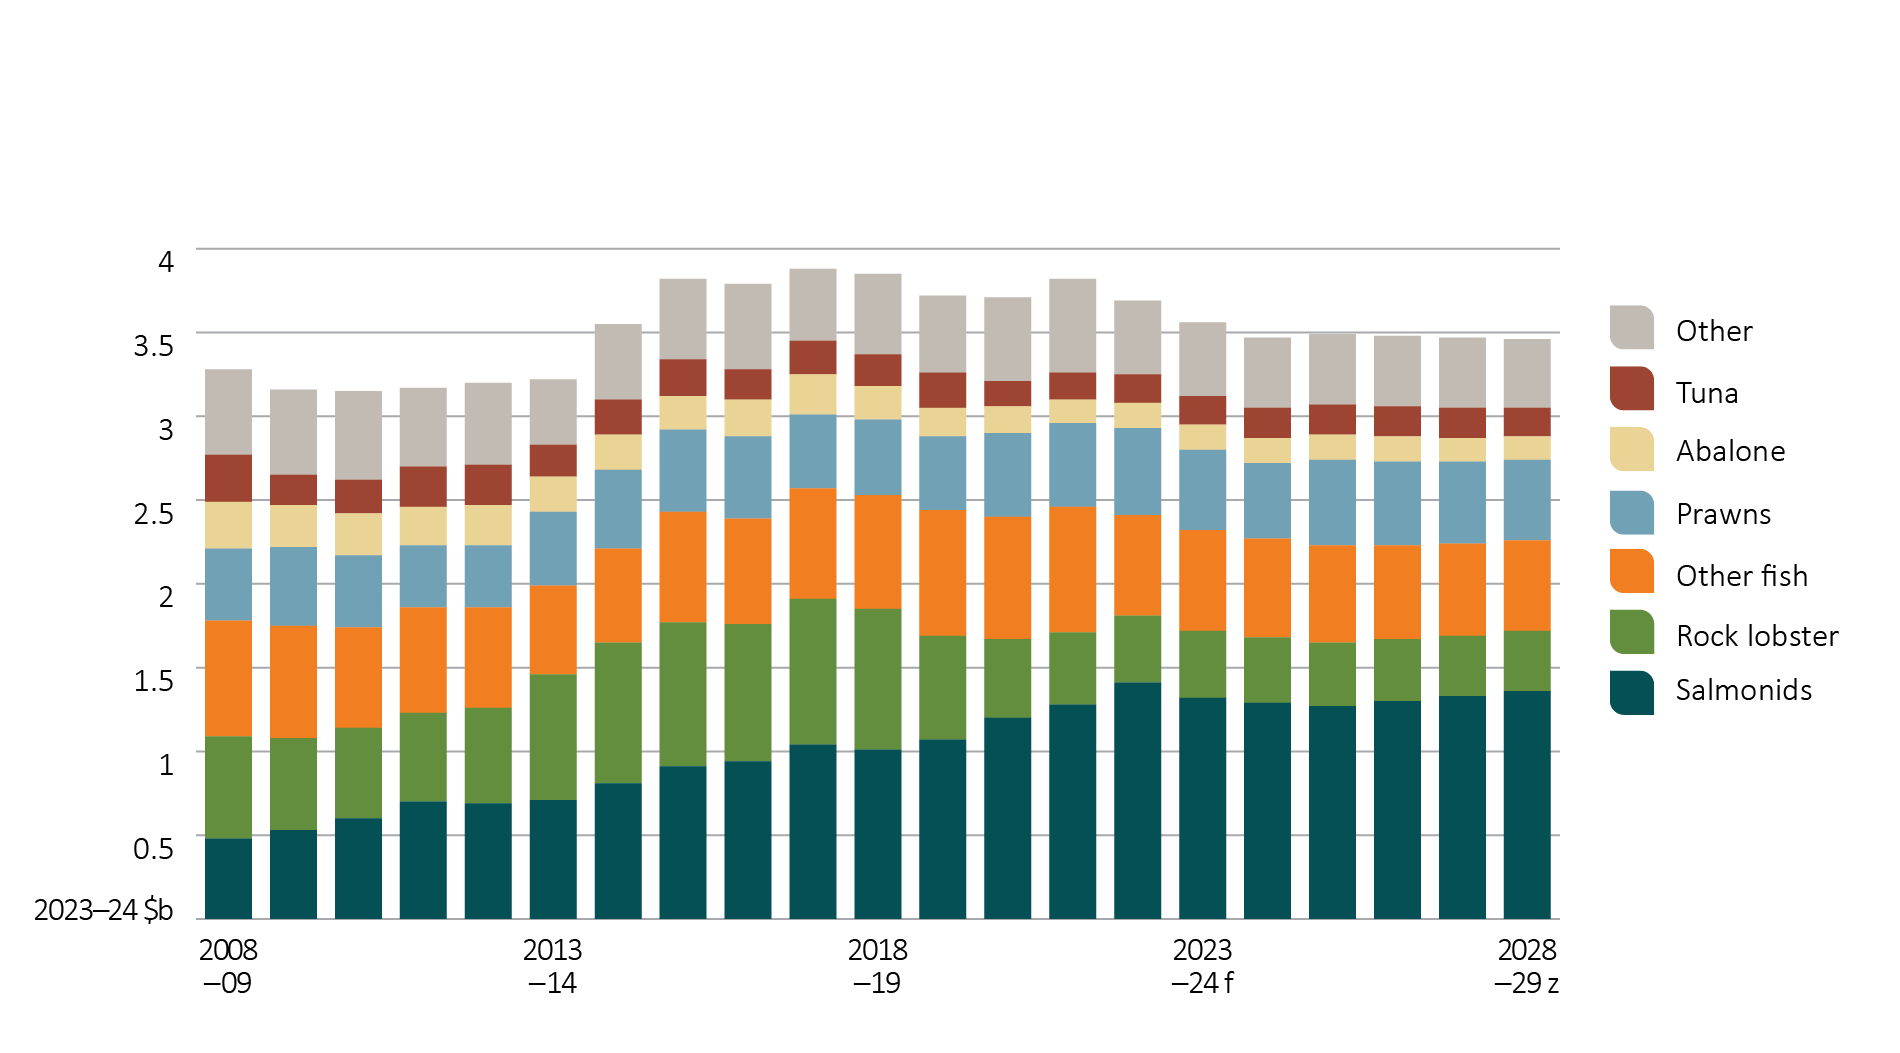
Real gross value of Australian fisheries and aquaculture, 2008-09 to 2028-29
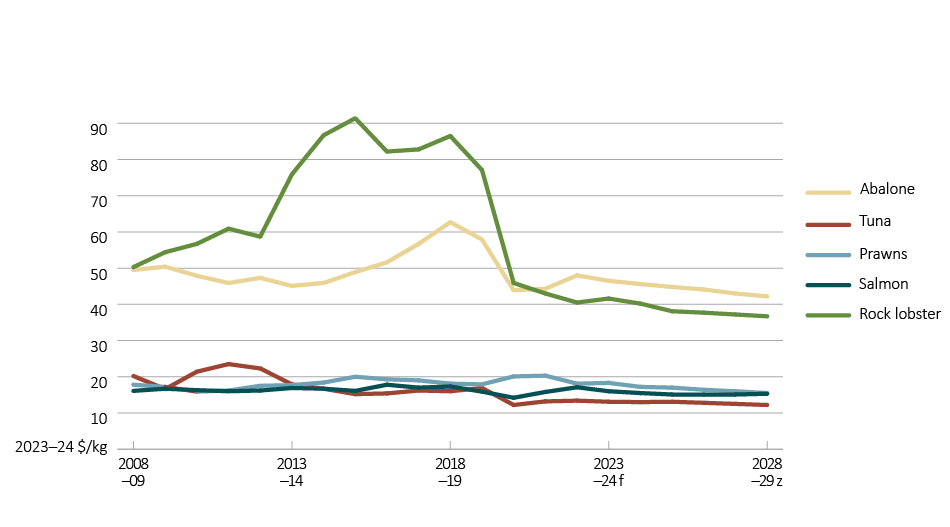
Average price by species 2008-09 forecast to 2028-29
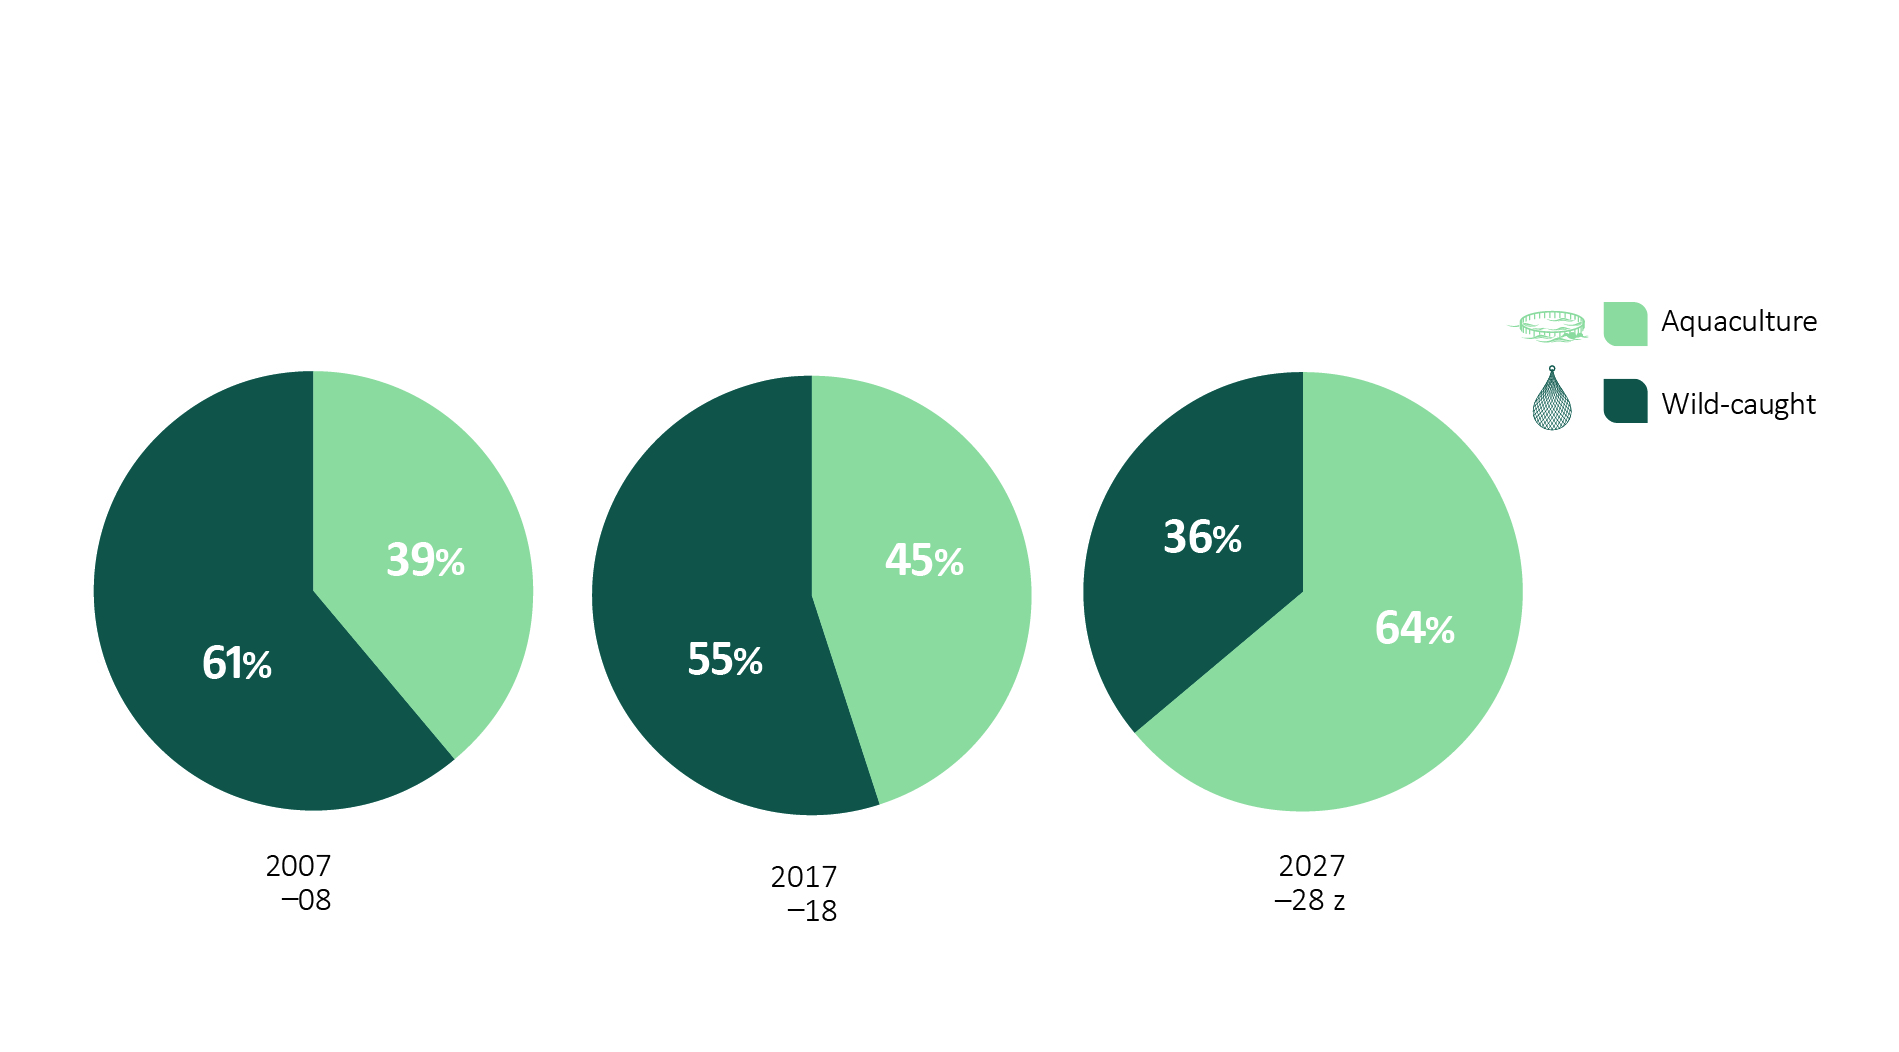
Aquaculture share of total Australian fisheries and aquaculture GVP (in 2022-23 dollars)
z. 2027-28 is an ABARES projection
Forecast GVP of rock lobster
Forecast GVP of salmonoids
Forecast GVP of Abalone
Forecast GVP of Tuna
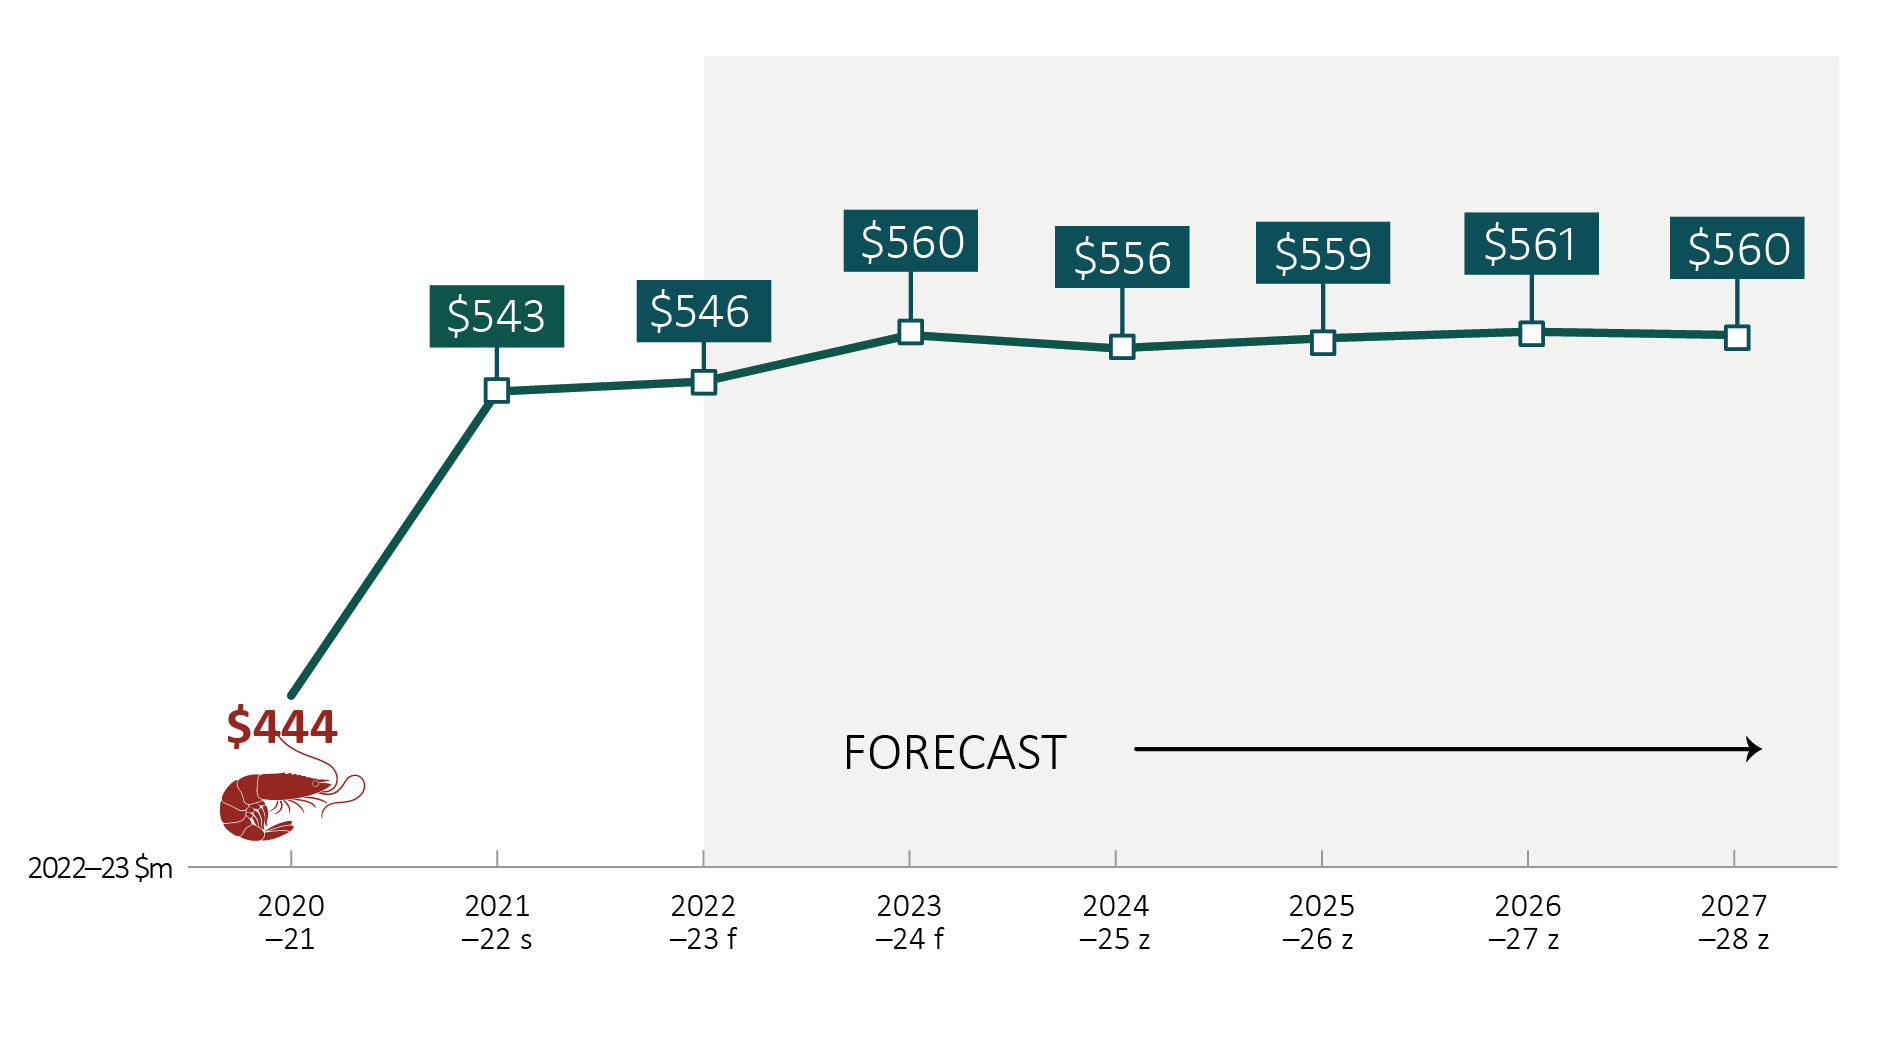
Forecast GVP of Prawn
If you have difficulty accessing these files, contact ABARES.
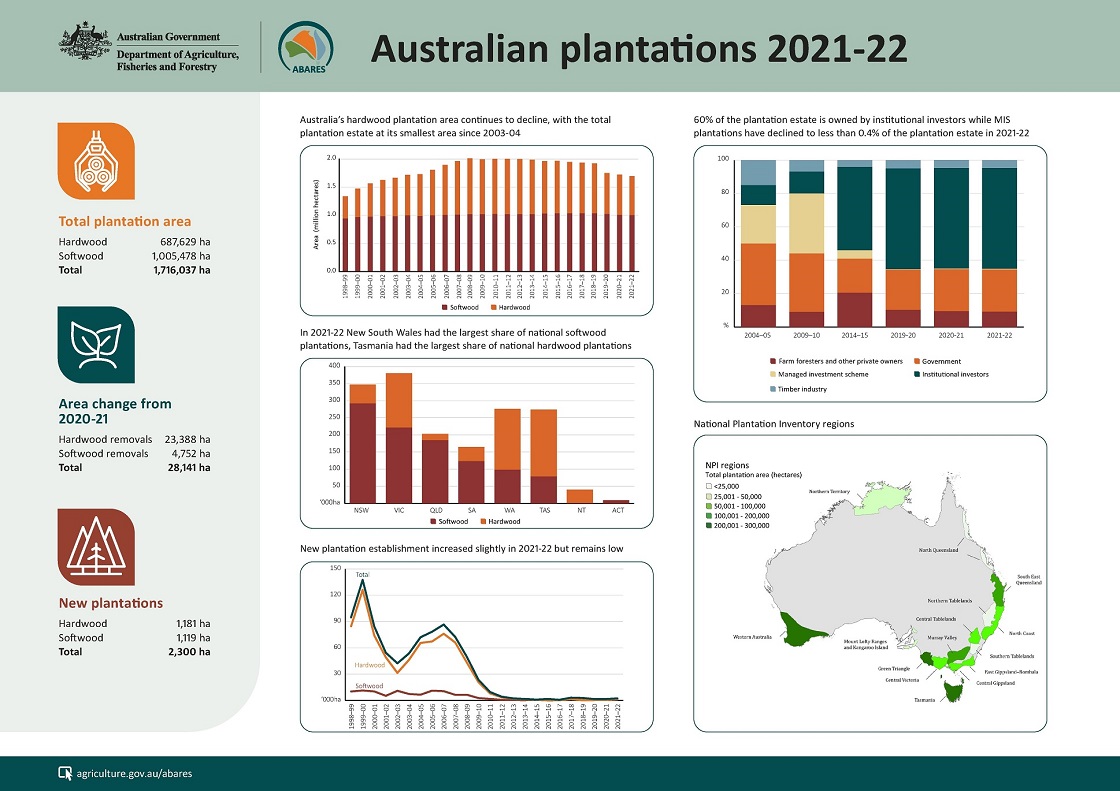
Download the Australian Plantation Statistics update 2023 infographic (PDF 692 KB)
If you have difficulty accessing these files, contact ABARES.
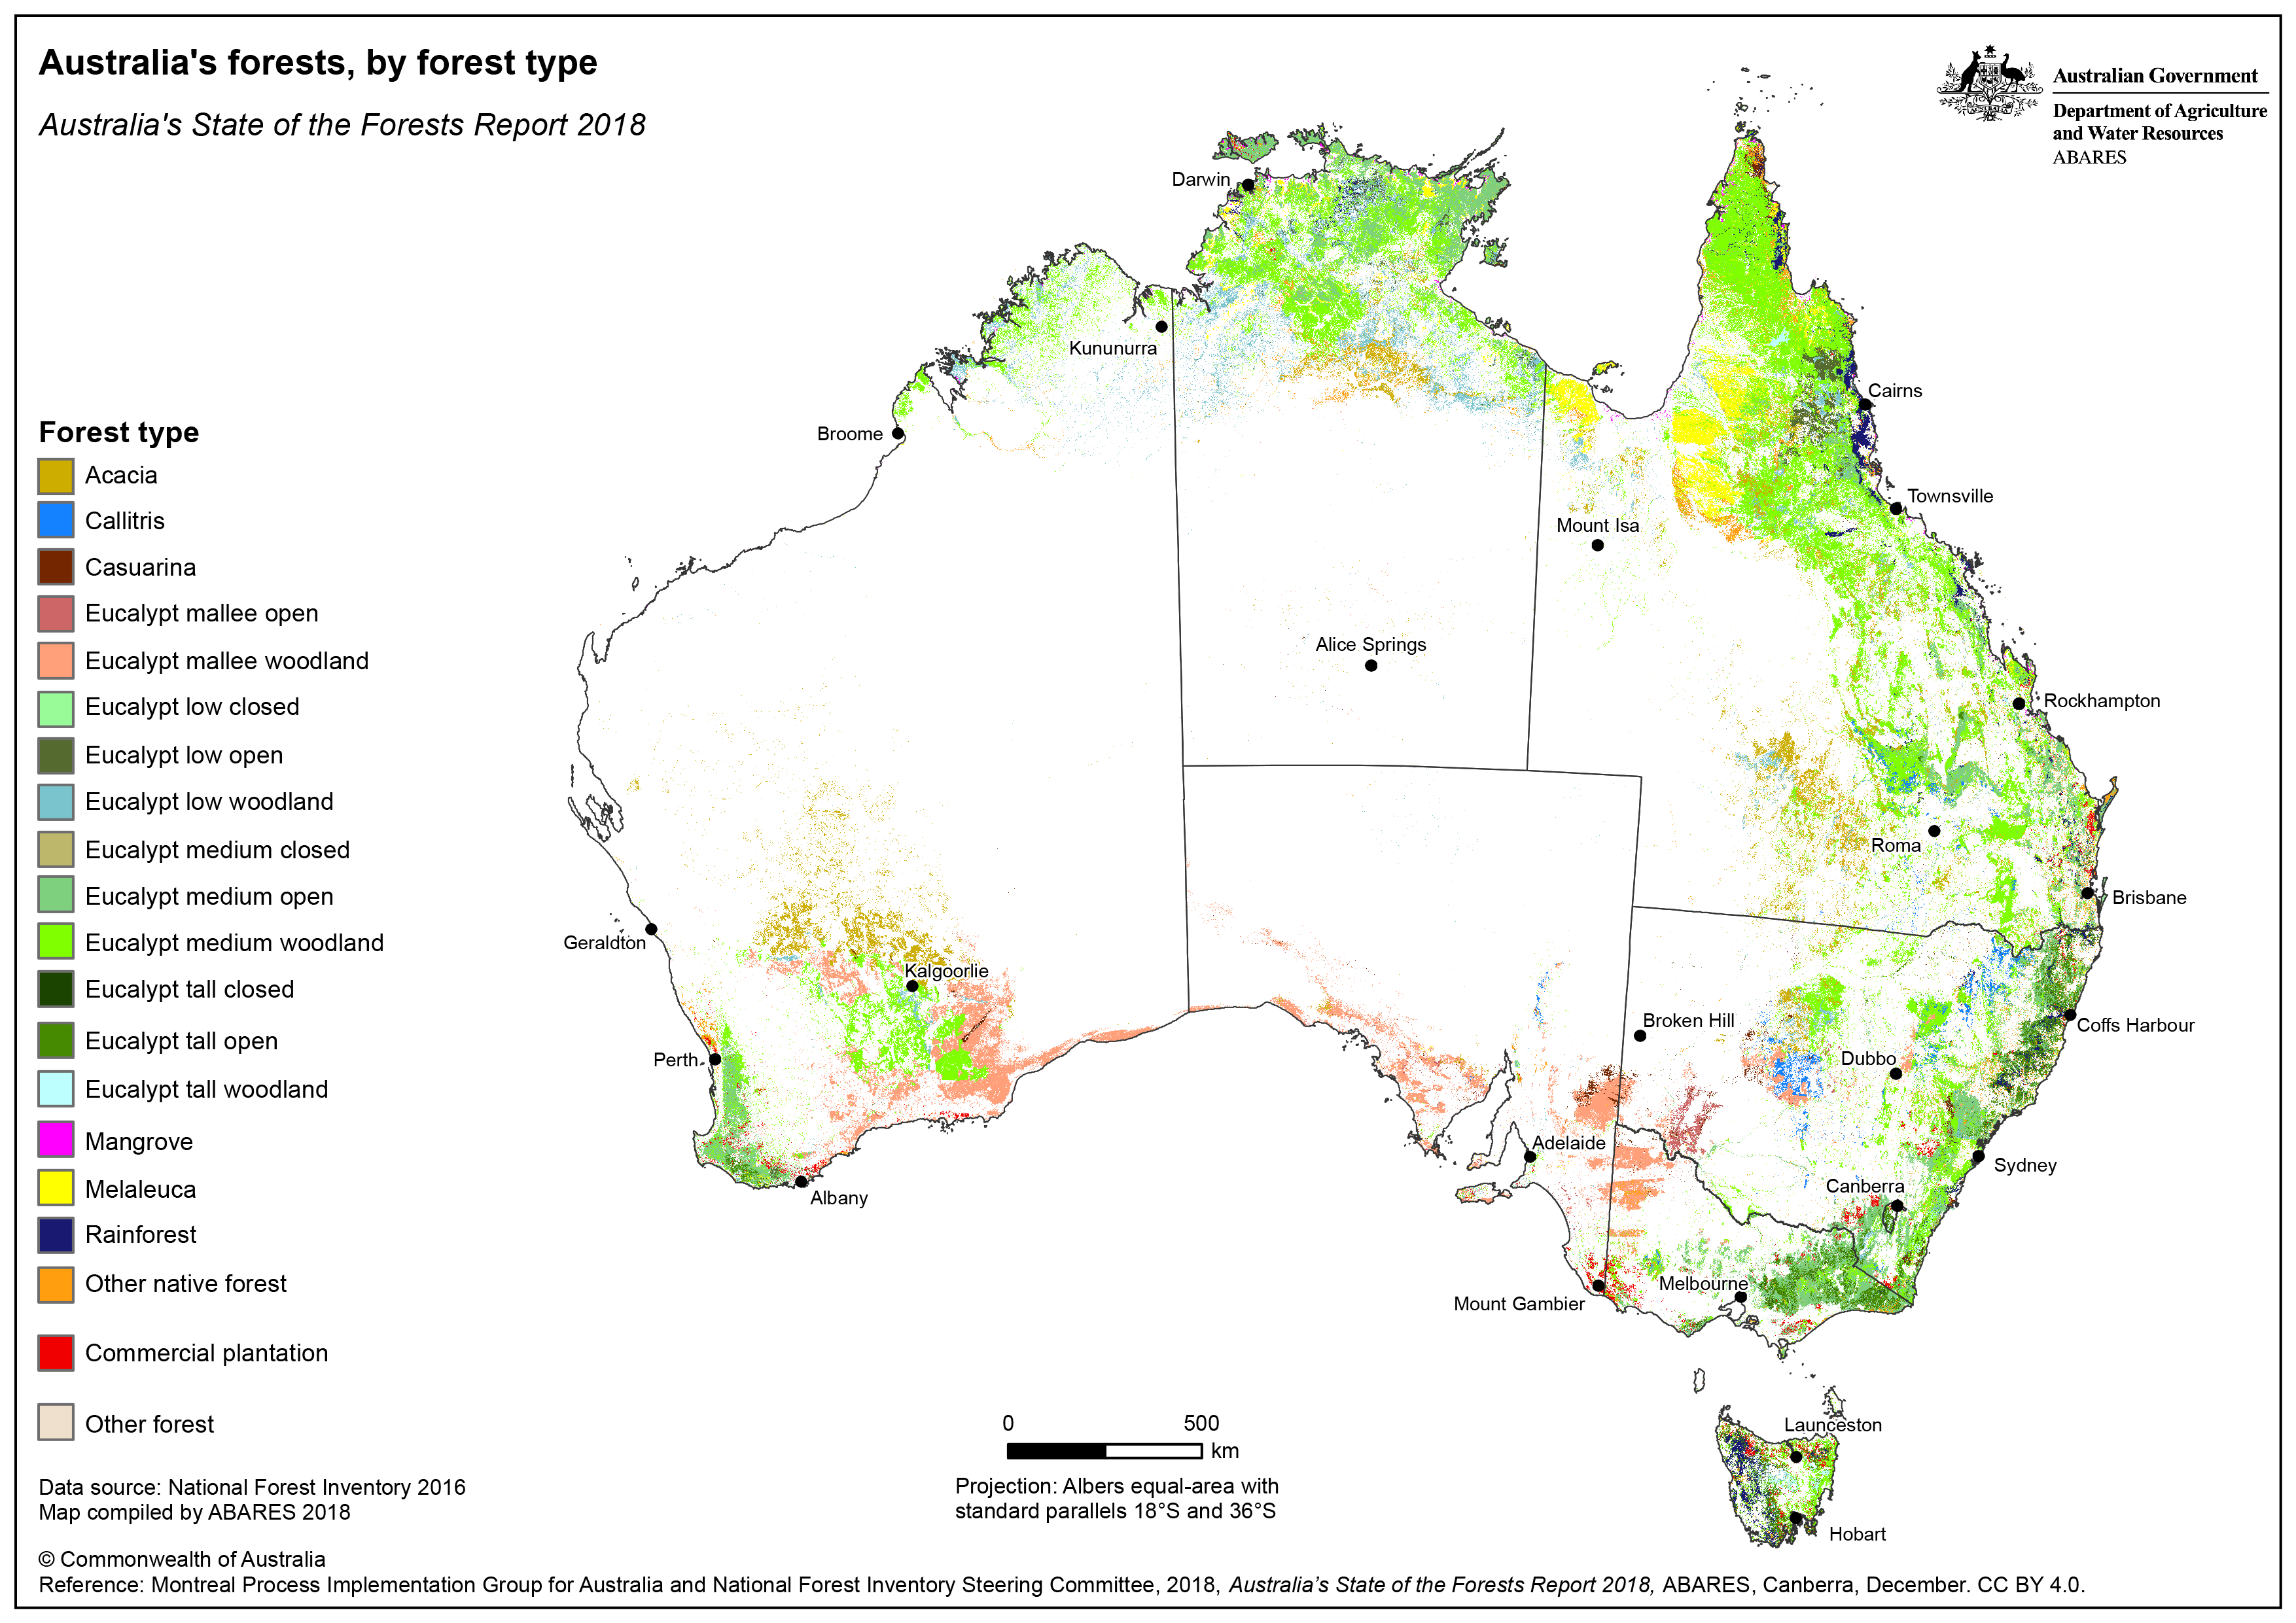
Australia’s forests, by forest type – high-resolution version
This map is part of Australia’s State of the Forests Report 2018.
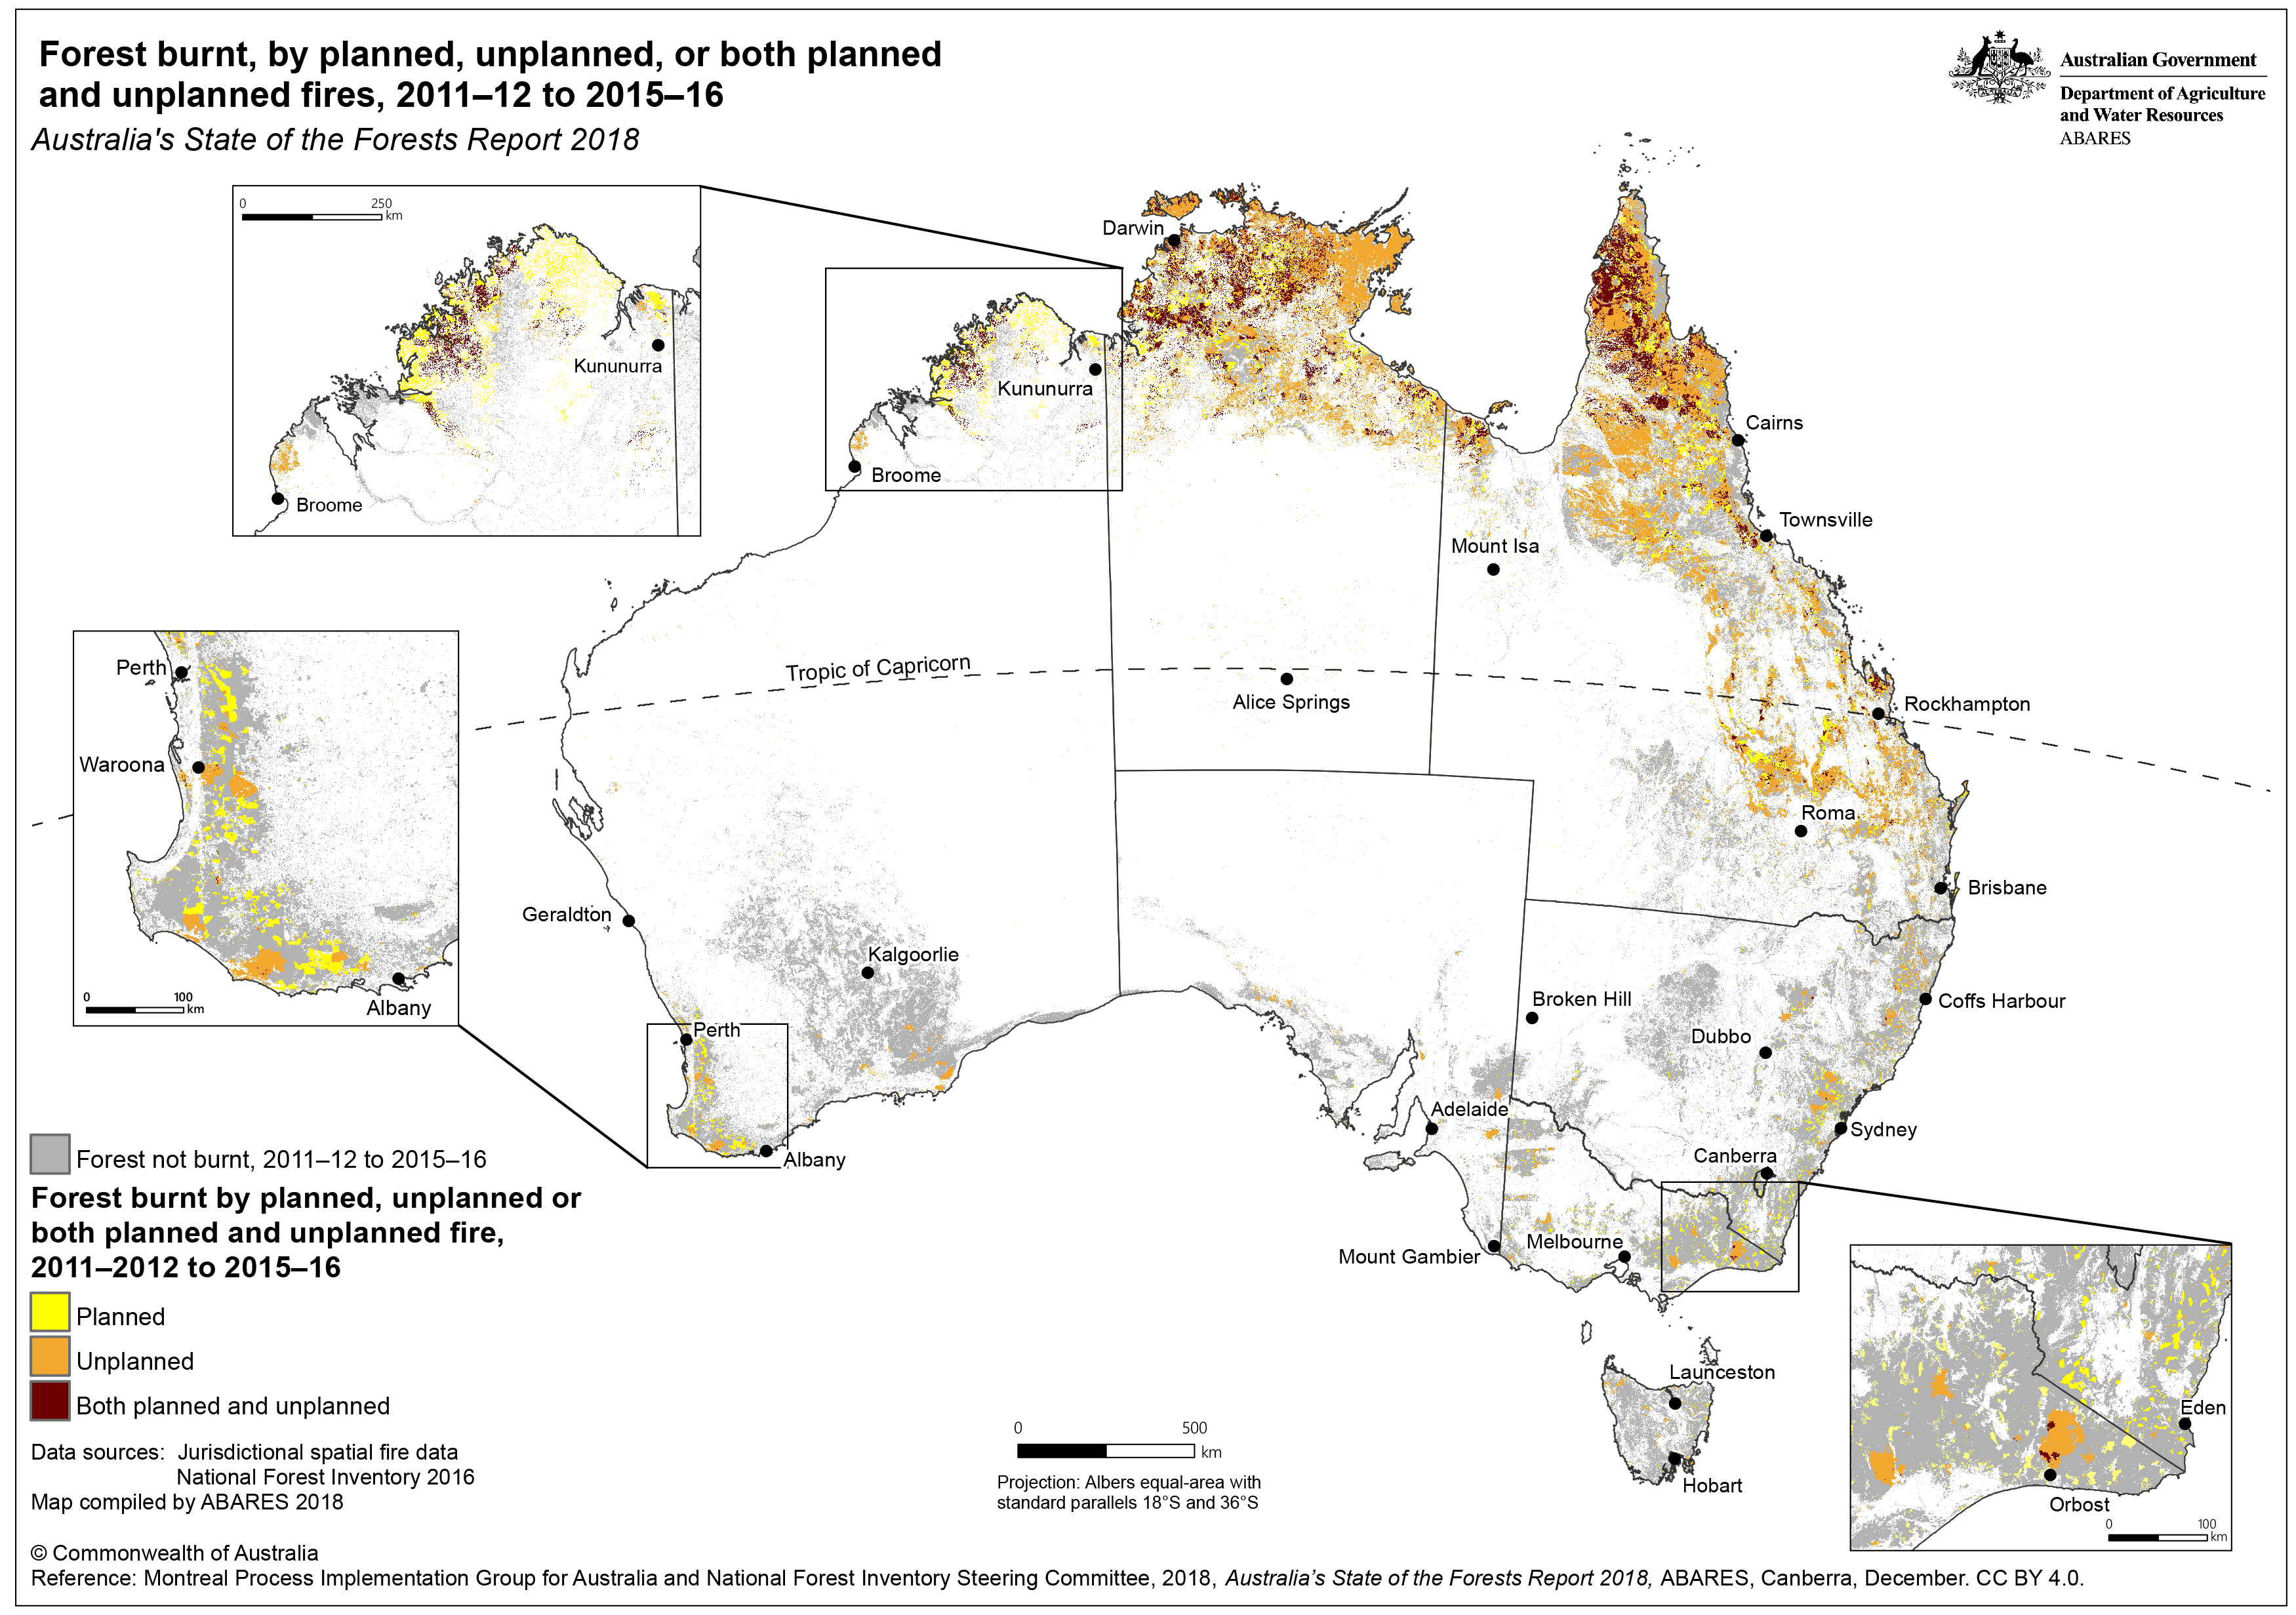
This map is part of Australia’s State of the Forests Report 2018.
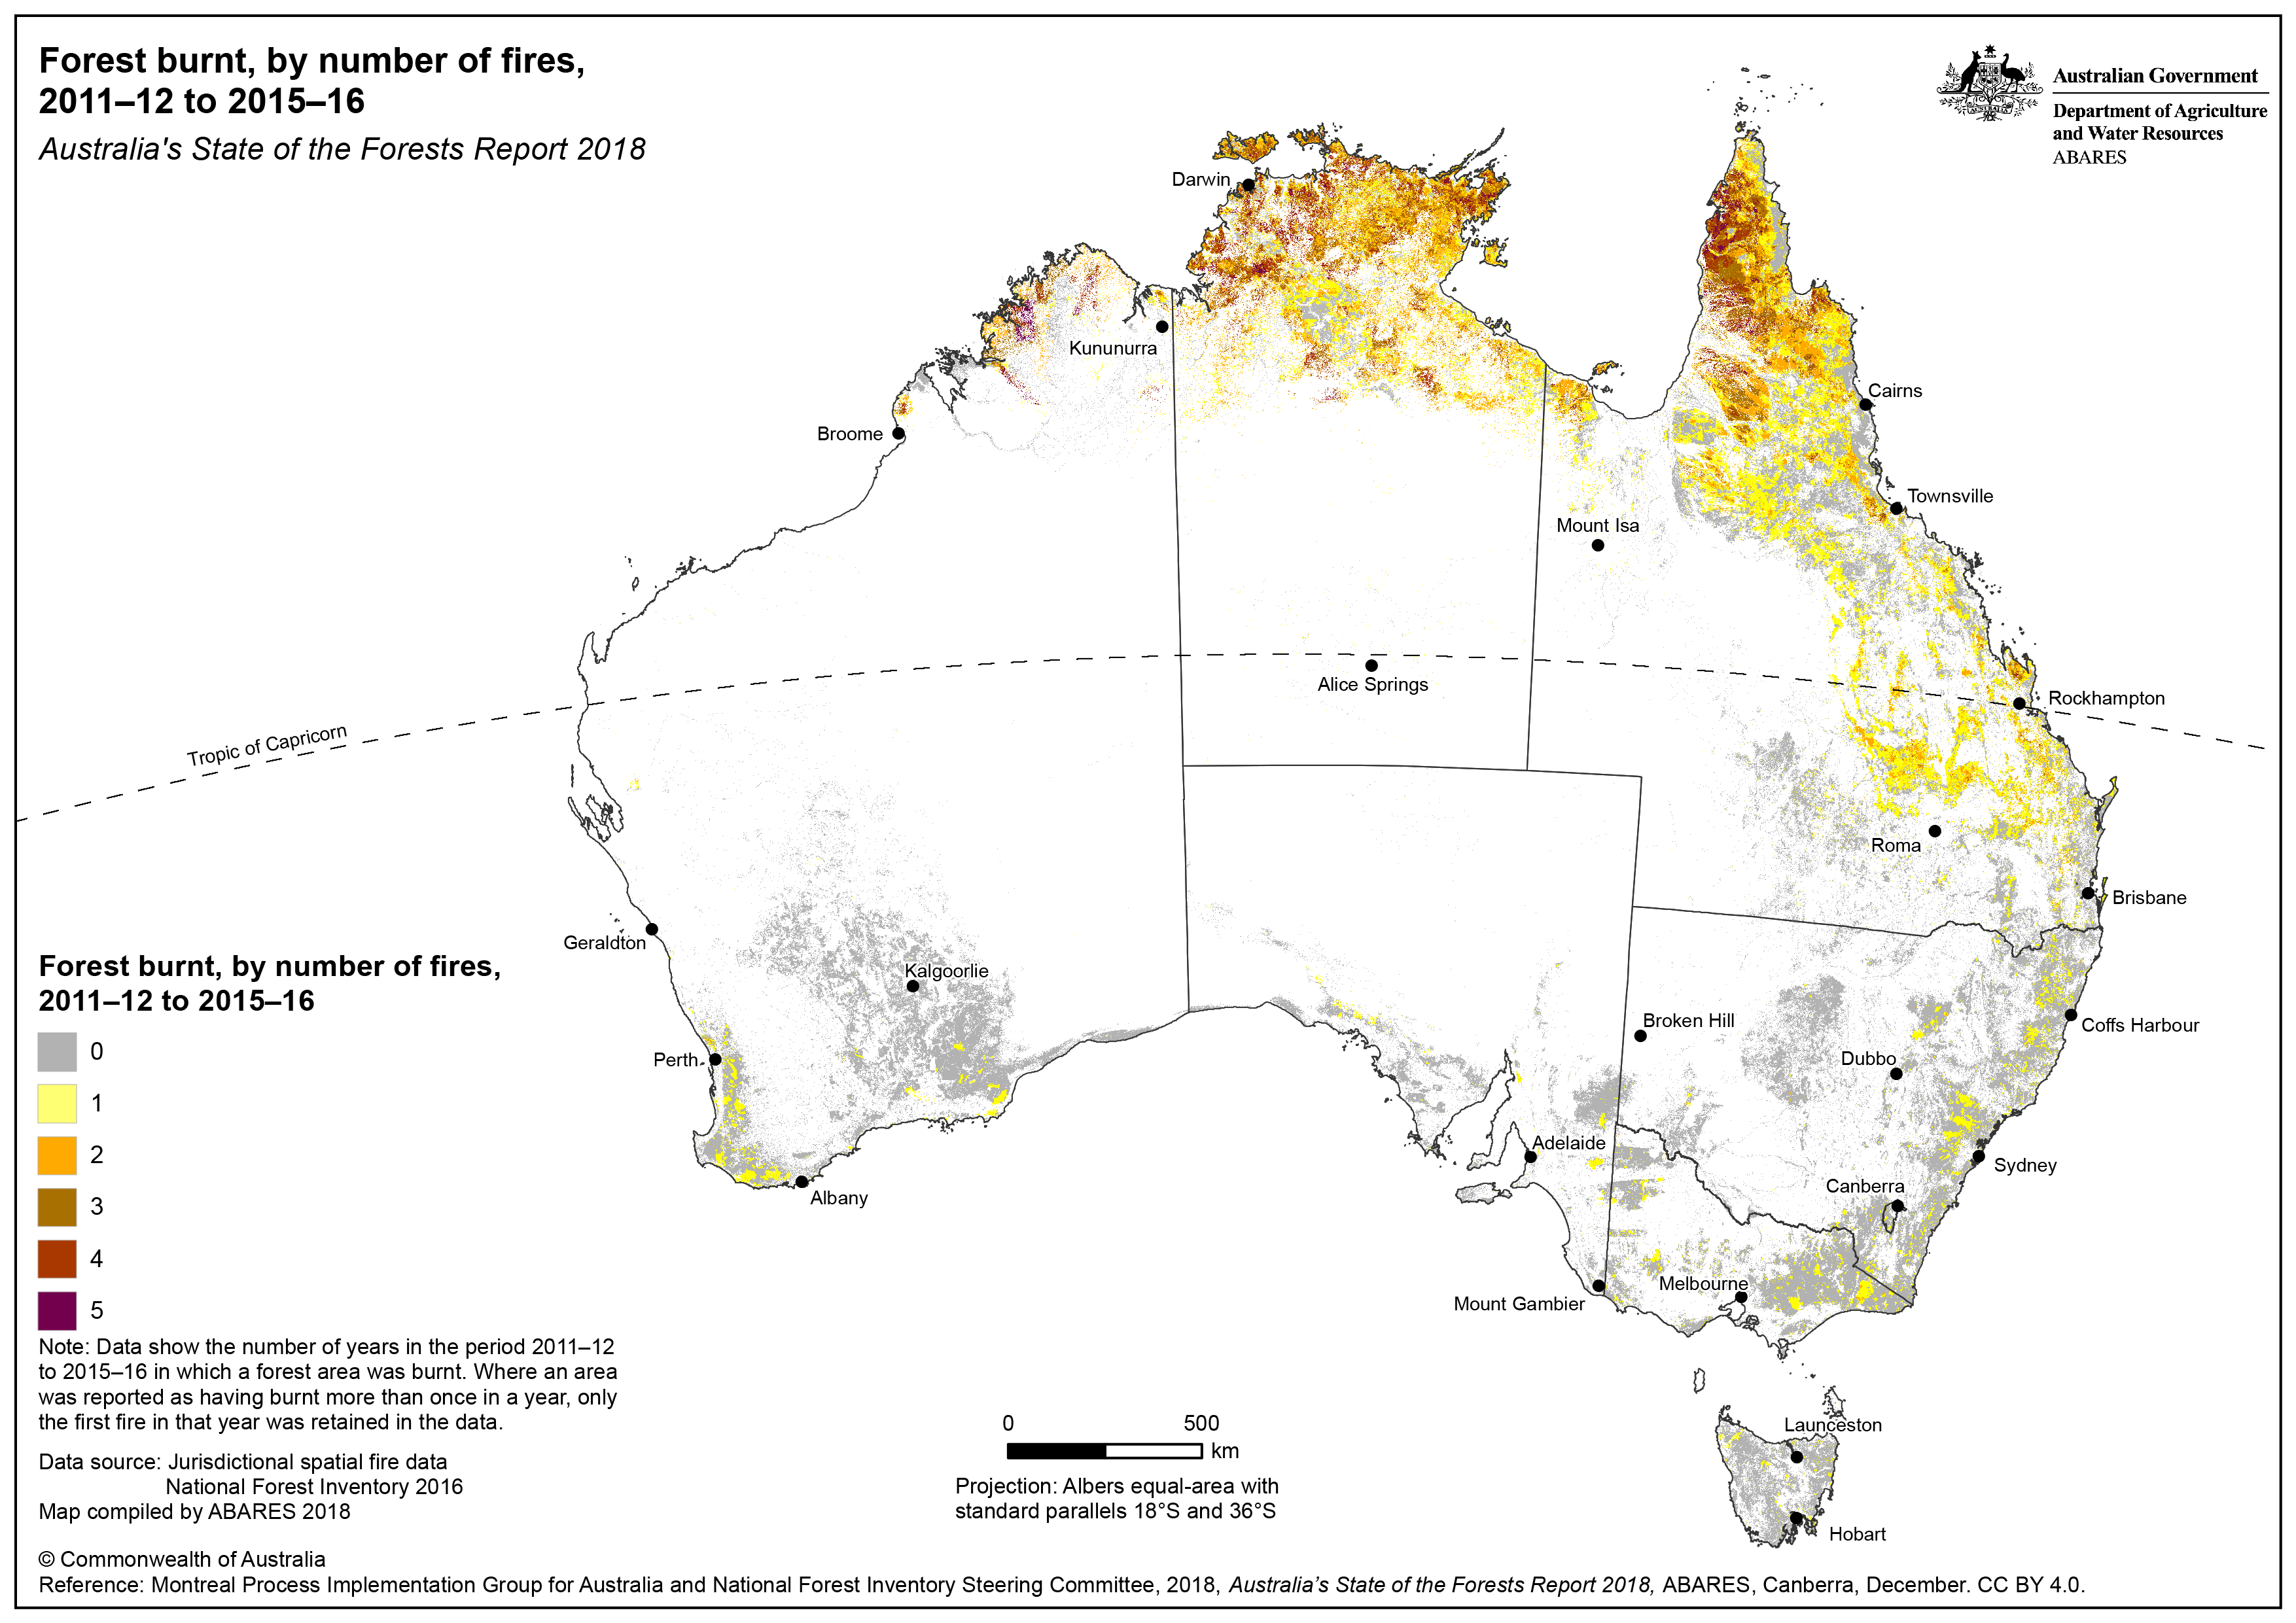
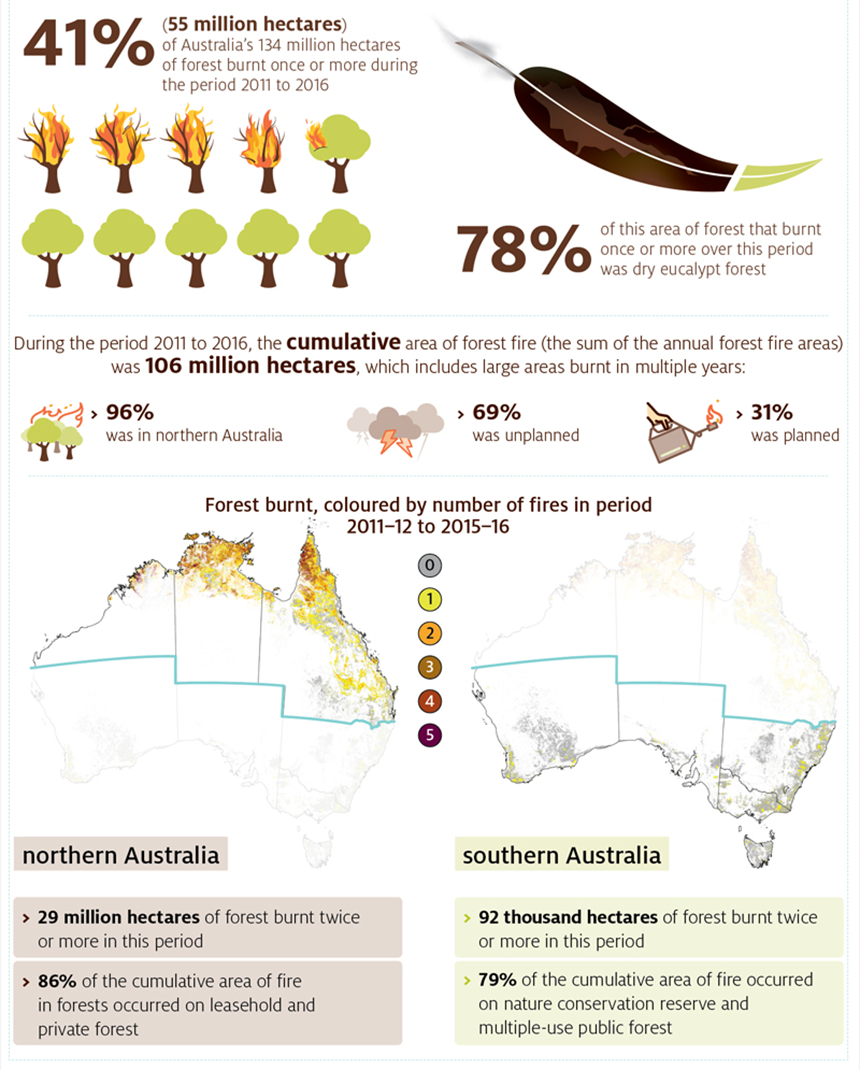
Forest burnt, by number of fires, 2011-12 to 2014-16 – high-resolution version
This map is part of Australia’s State of the Forests Report 2018.
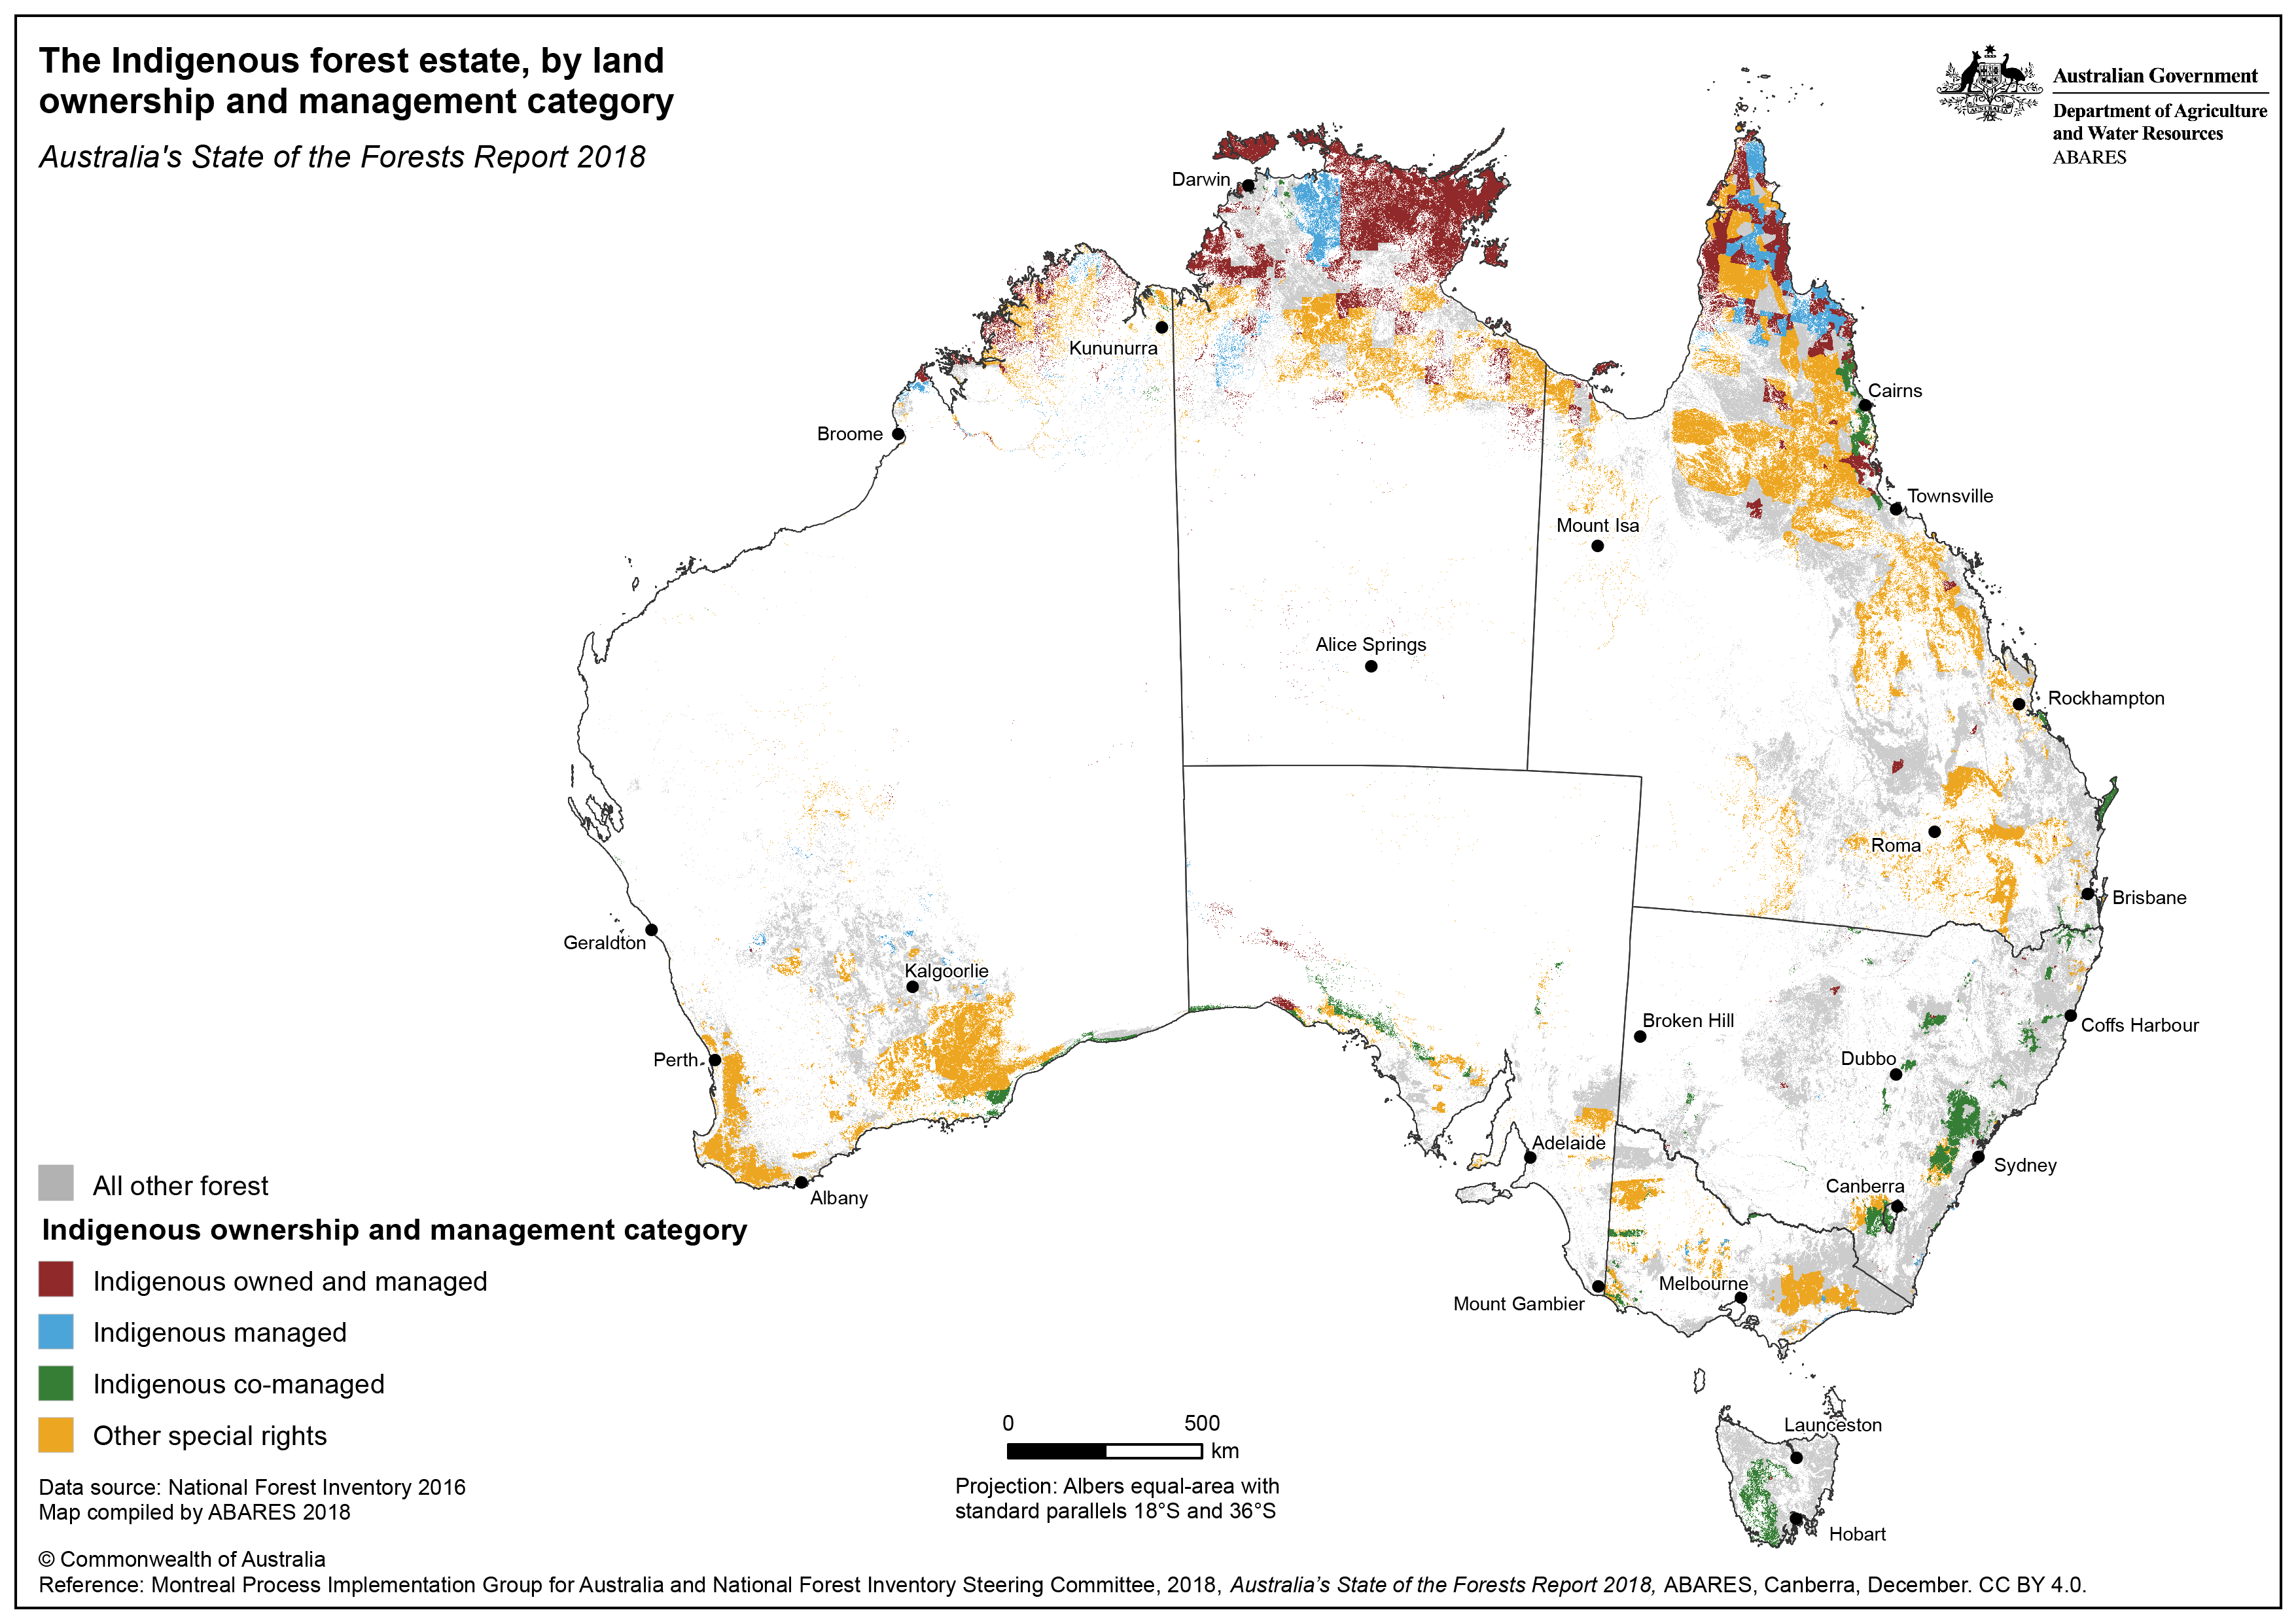
The Indigenous forest estate, by land ownership and management category
This map is part of Australia’s State of the Forests Report 2018.
One off publications
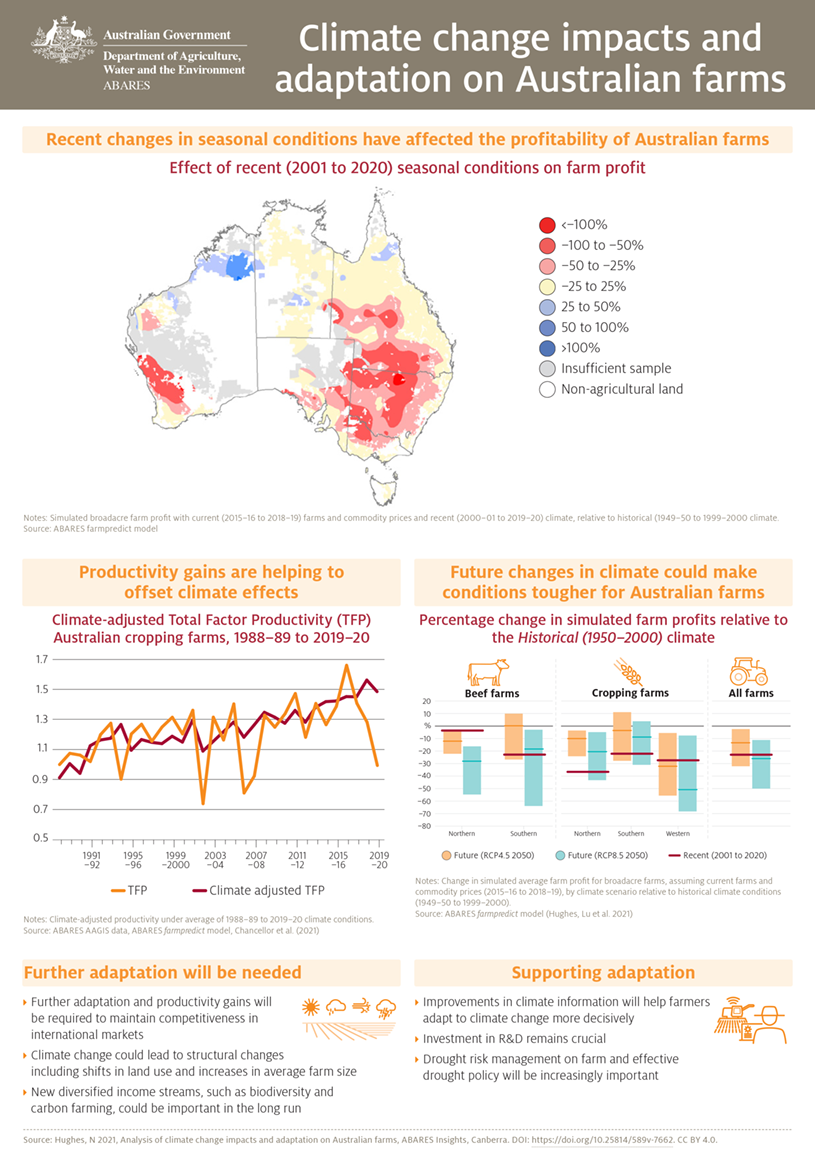
Climate change impacts and adaptation on Australian farms – high resolution version
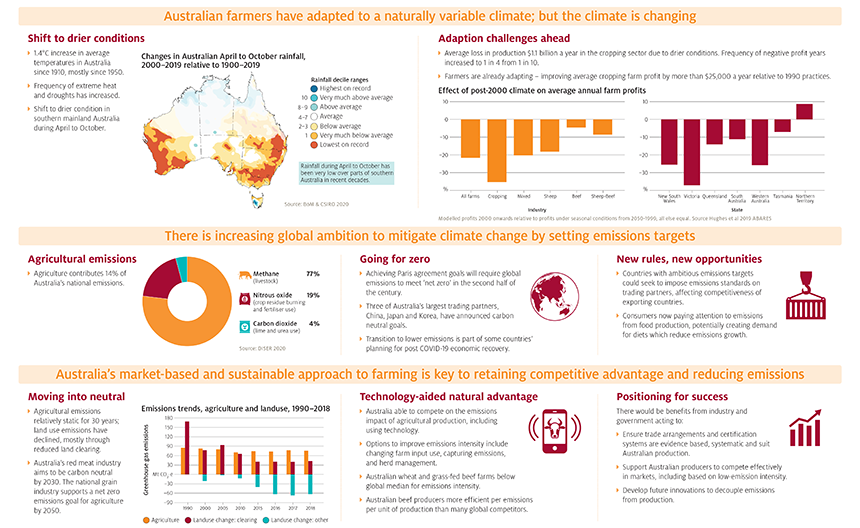
Global responses to climate change: opportunities for Australian agricultural producers
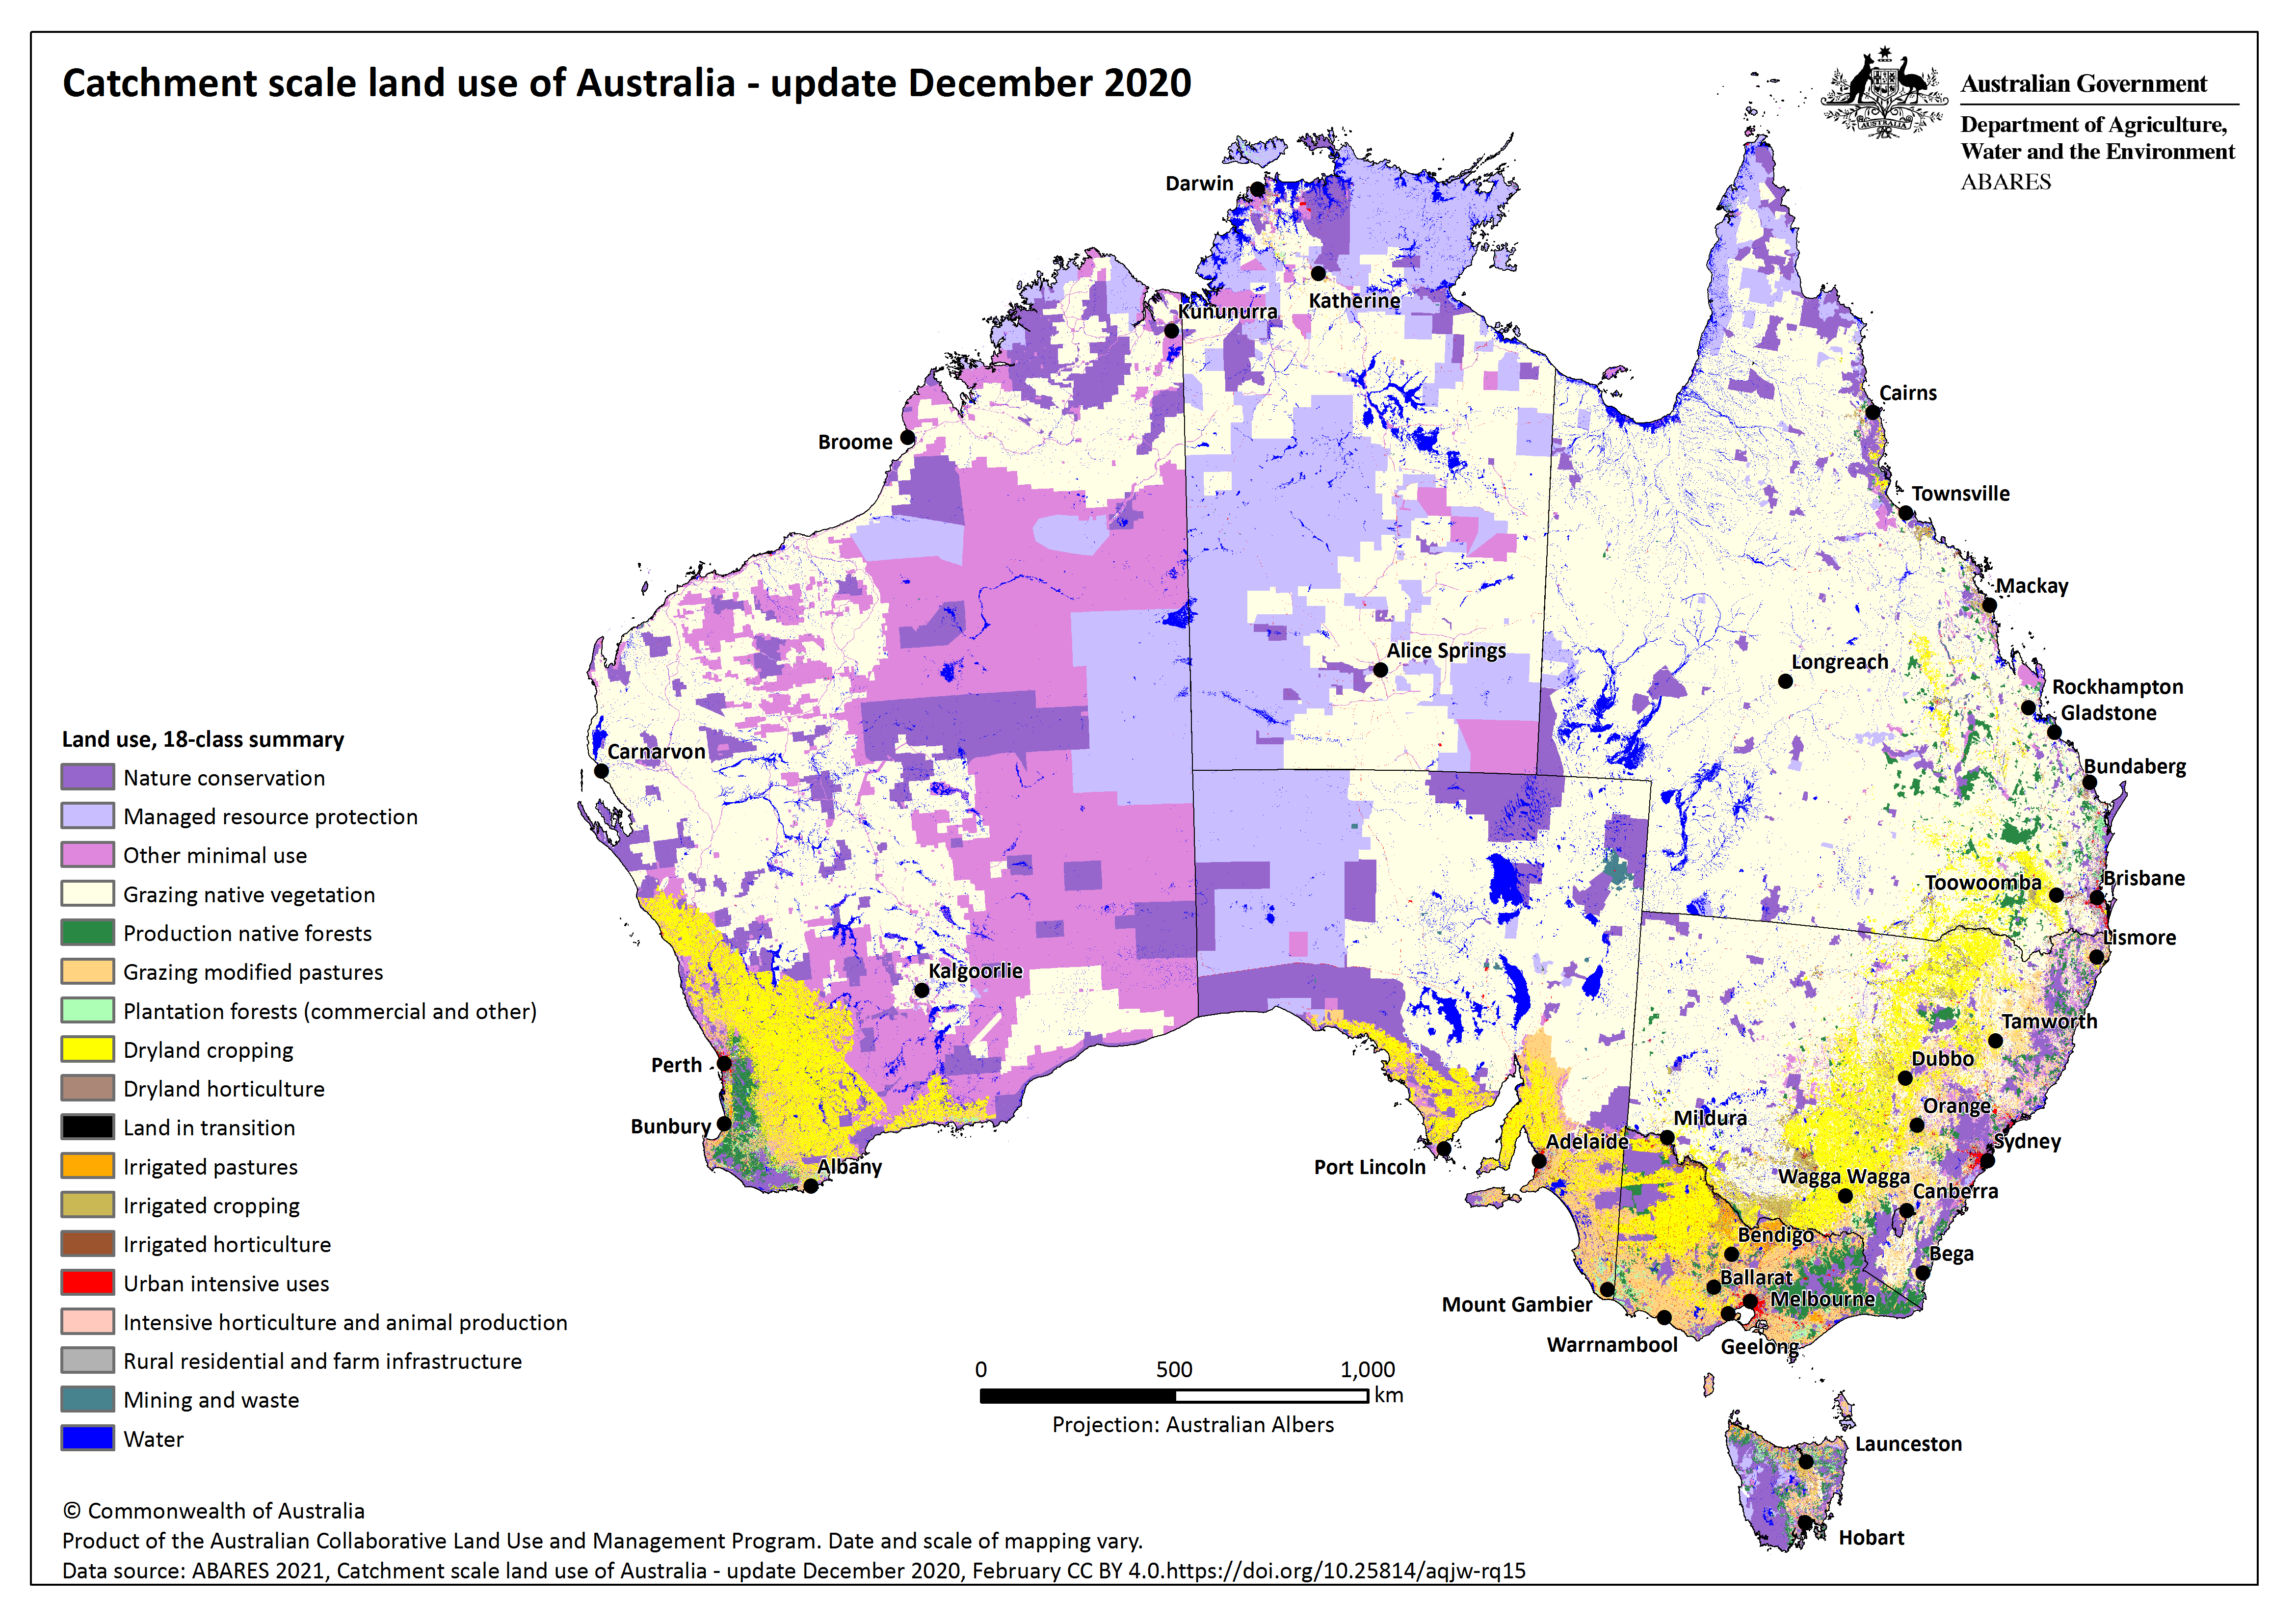
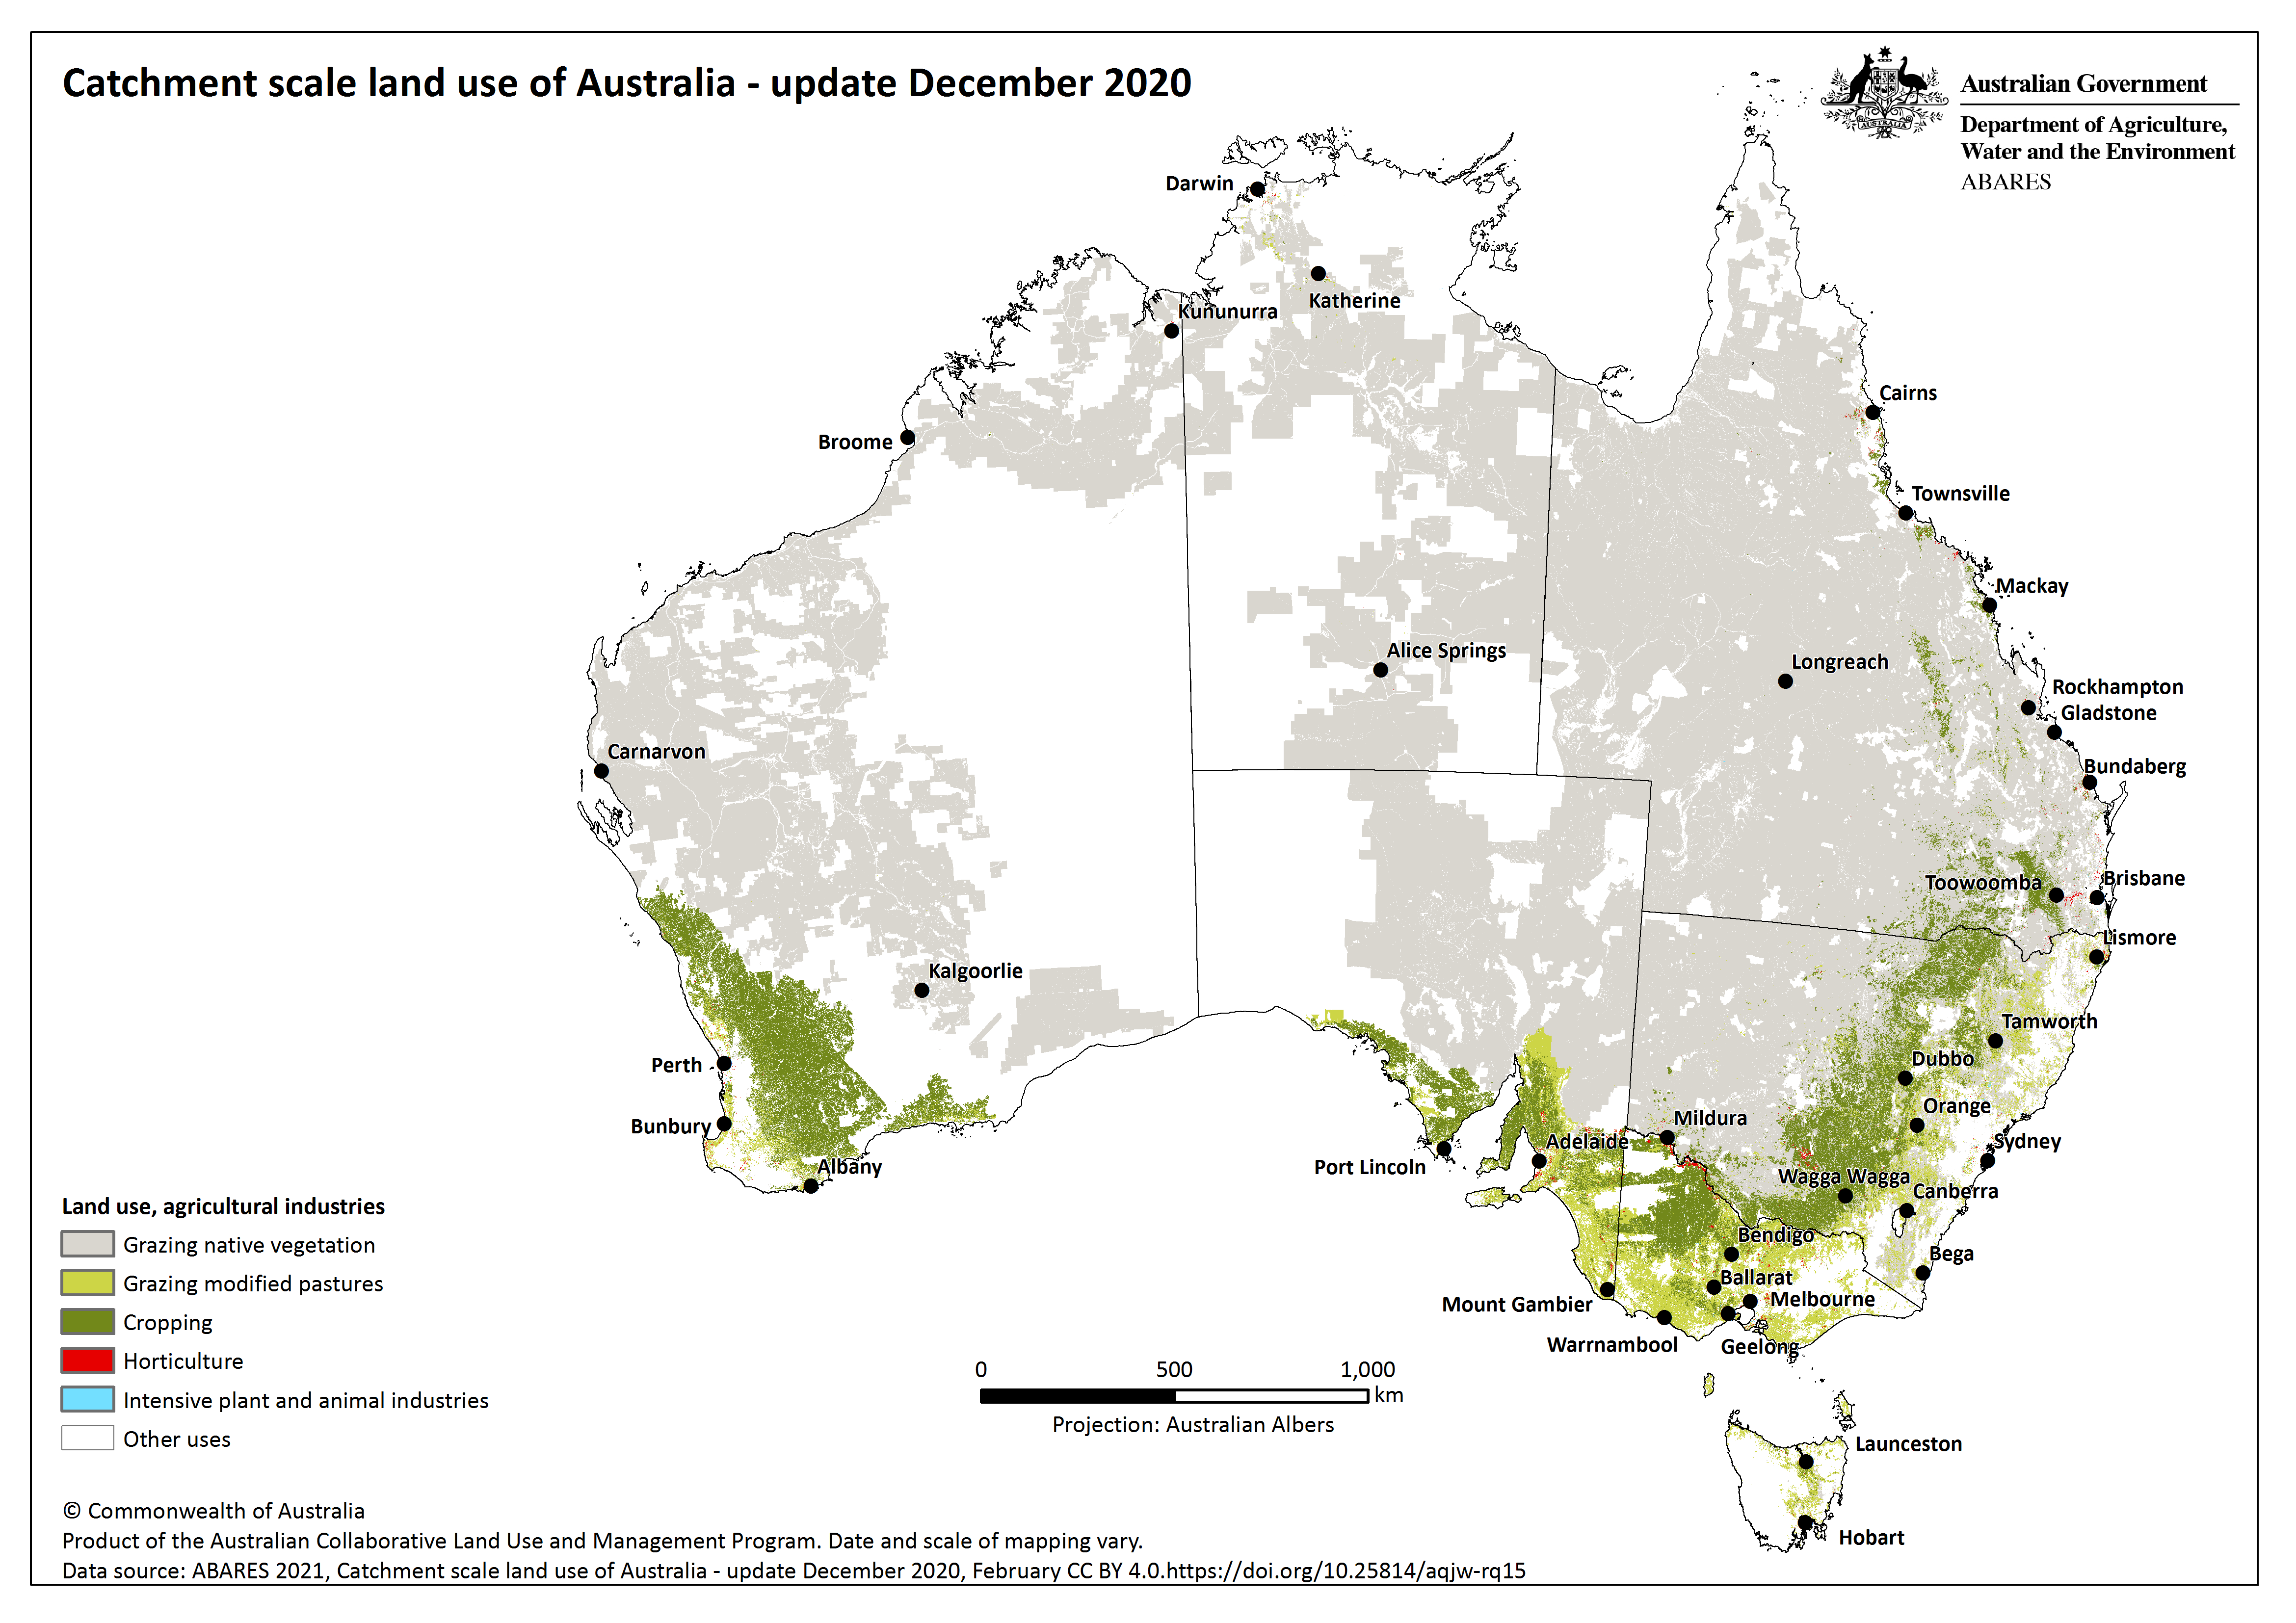
Australia's Agricultural Industries 2020 map provides a summary on a page of agriculture's status and trend. It shows where Australia's broad agricultural land uses are located and statistics on their area and land tenure. The map reports on the top 5 livestock, crop and horticulture commodities based on gross value of production. Trends in agricultural production, employment and exports are also given including for Australia's top 5 agricultural export commodities and destinations.
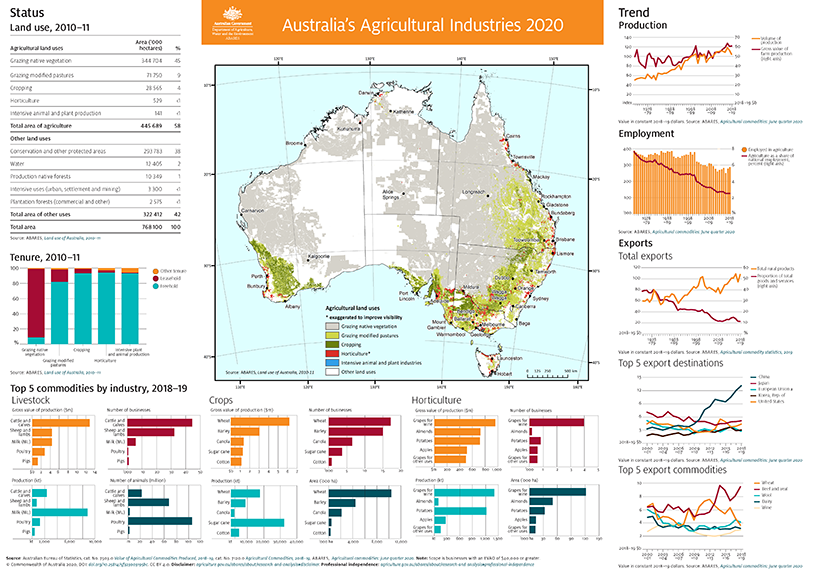
Australia’s Agricultural Industries Map 2020 – high-resolution version
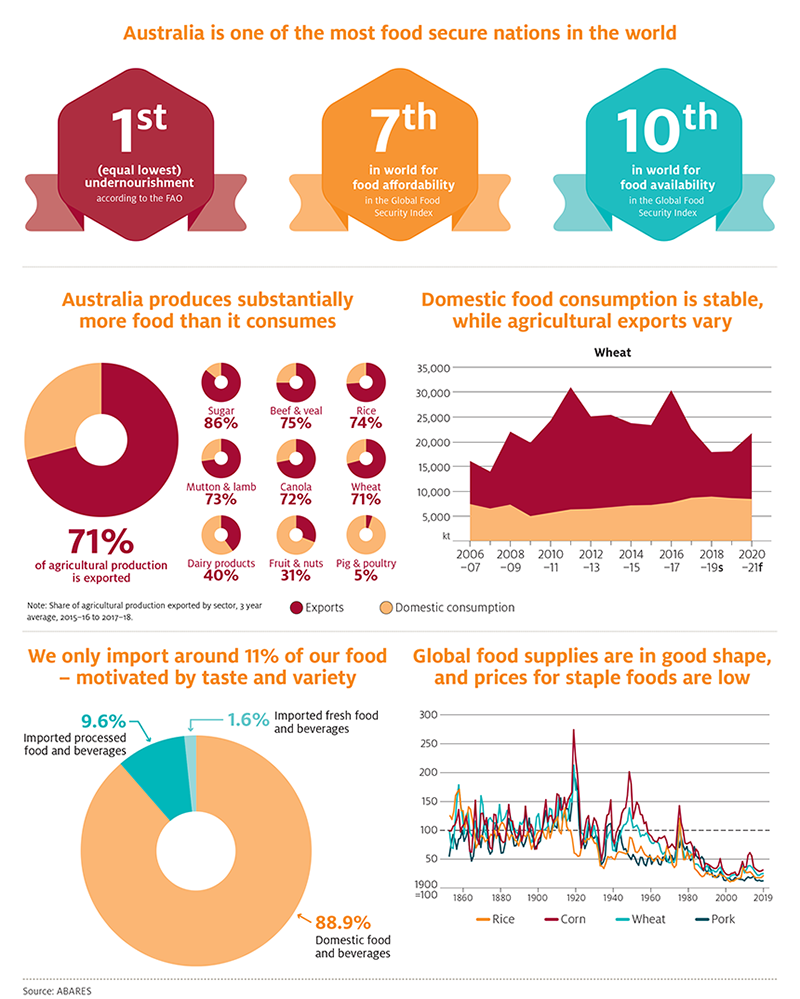
Australia does not have a food security problem – PDF version
This infographic is based on ABARES Insights: Analysis of Australian food security and the COVID-19 pandemic, which provides sources and technical notes for each figure in the References section.