
This indicator describes the loss of forest cover and the spatial configuration of that loss. Fragmentation can impact on forest dwelling species and gene pools through changes in the connectivity of populations and the loss of species genetic variability.
This is the Key information for Indicator 1.1d, published December 2025.
- Most of Australia’s native forest cover is continuous, not fragmented
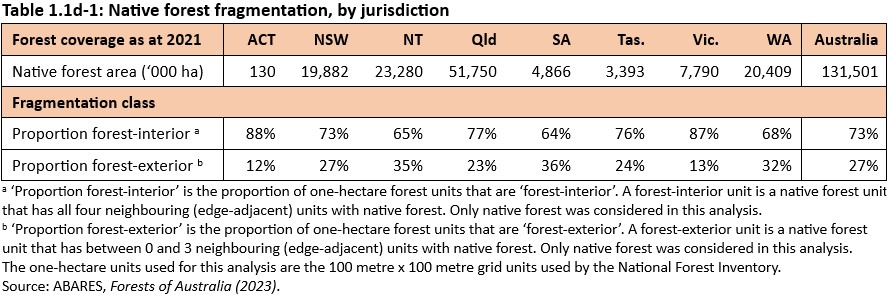
- 73% of Australia’s native forest is comprised of one-hectare forest units that are completely bounded by native forest
- Native forest that is not fragmented is found in areas of higher rainfall, and regions that have experienced the least clearing for agricultural land use and infrastructure.
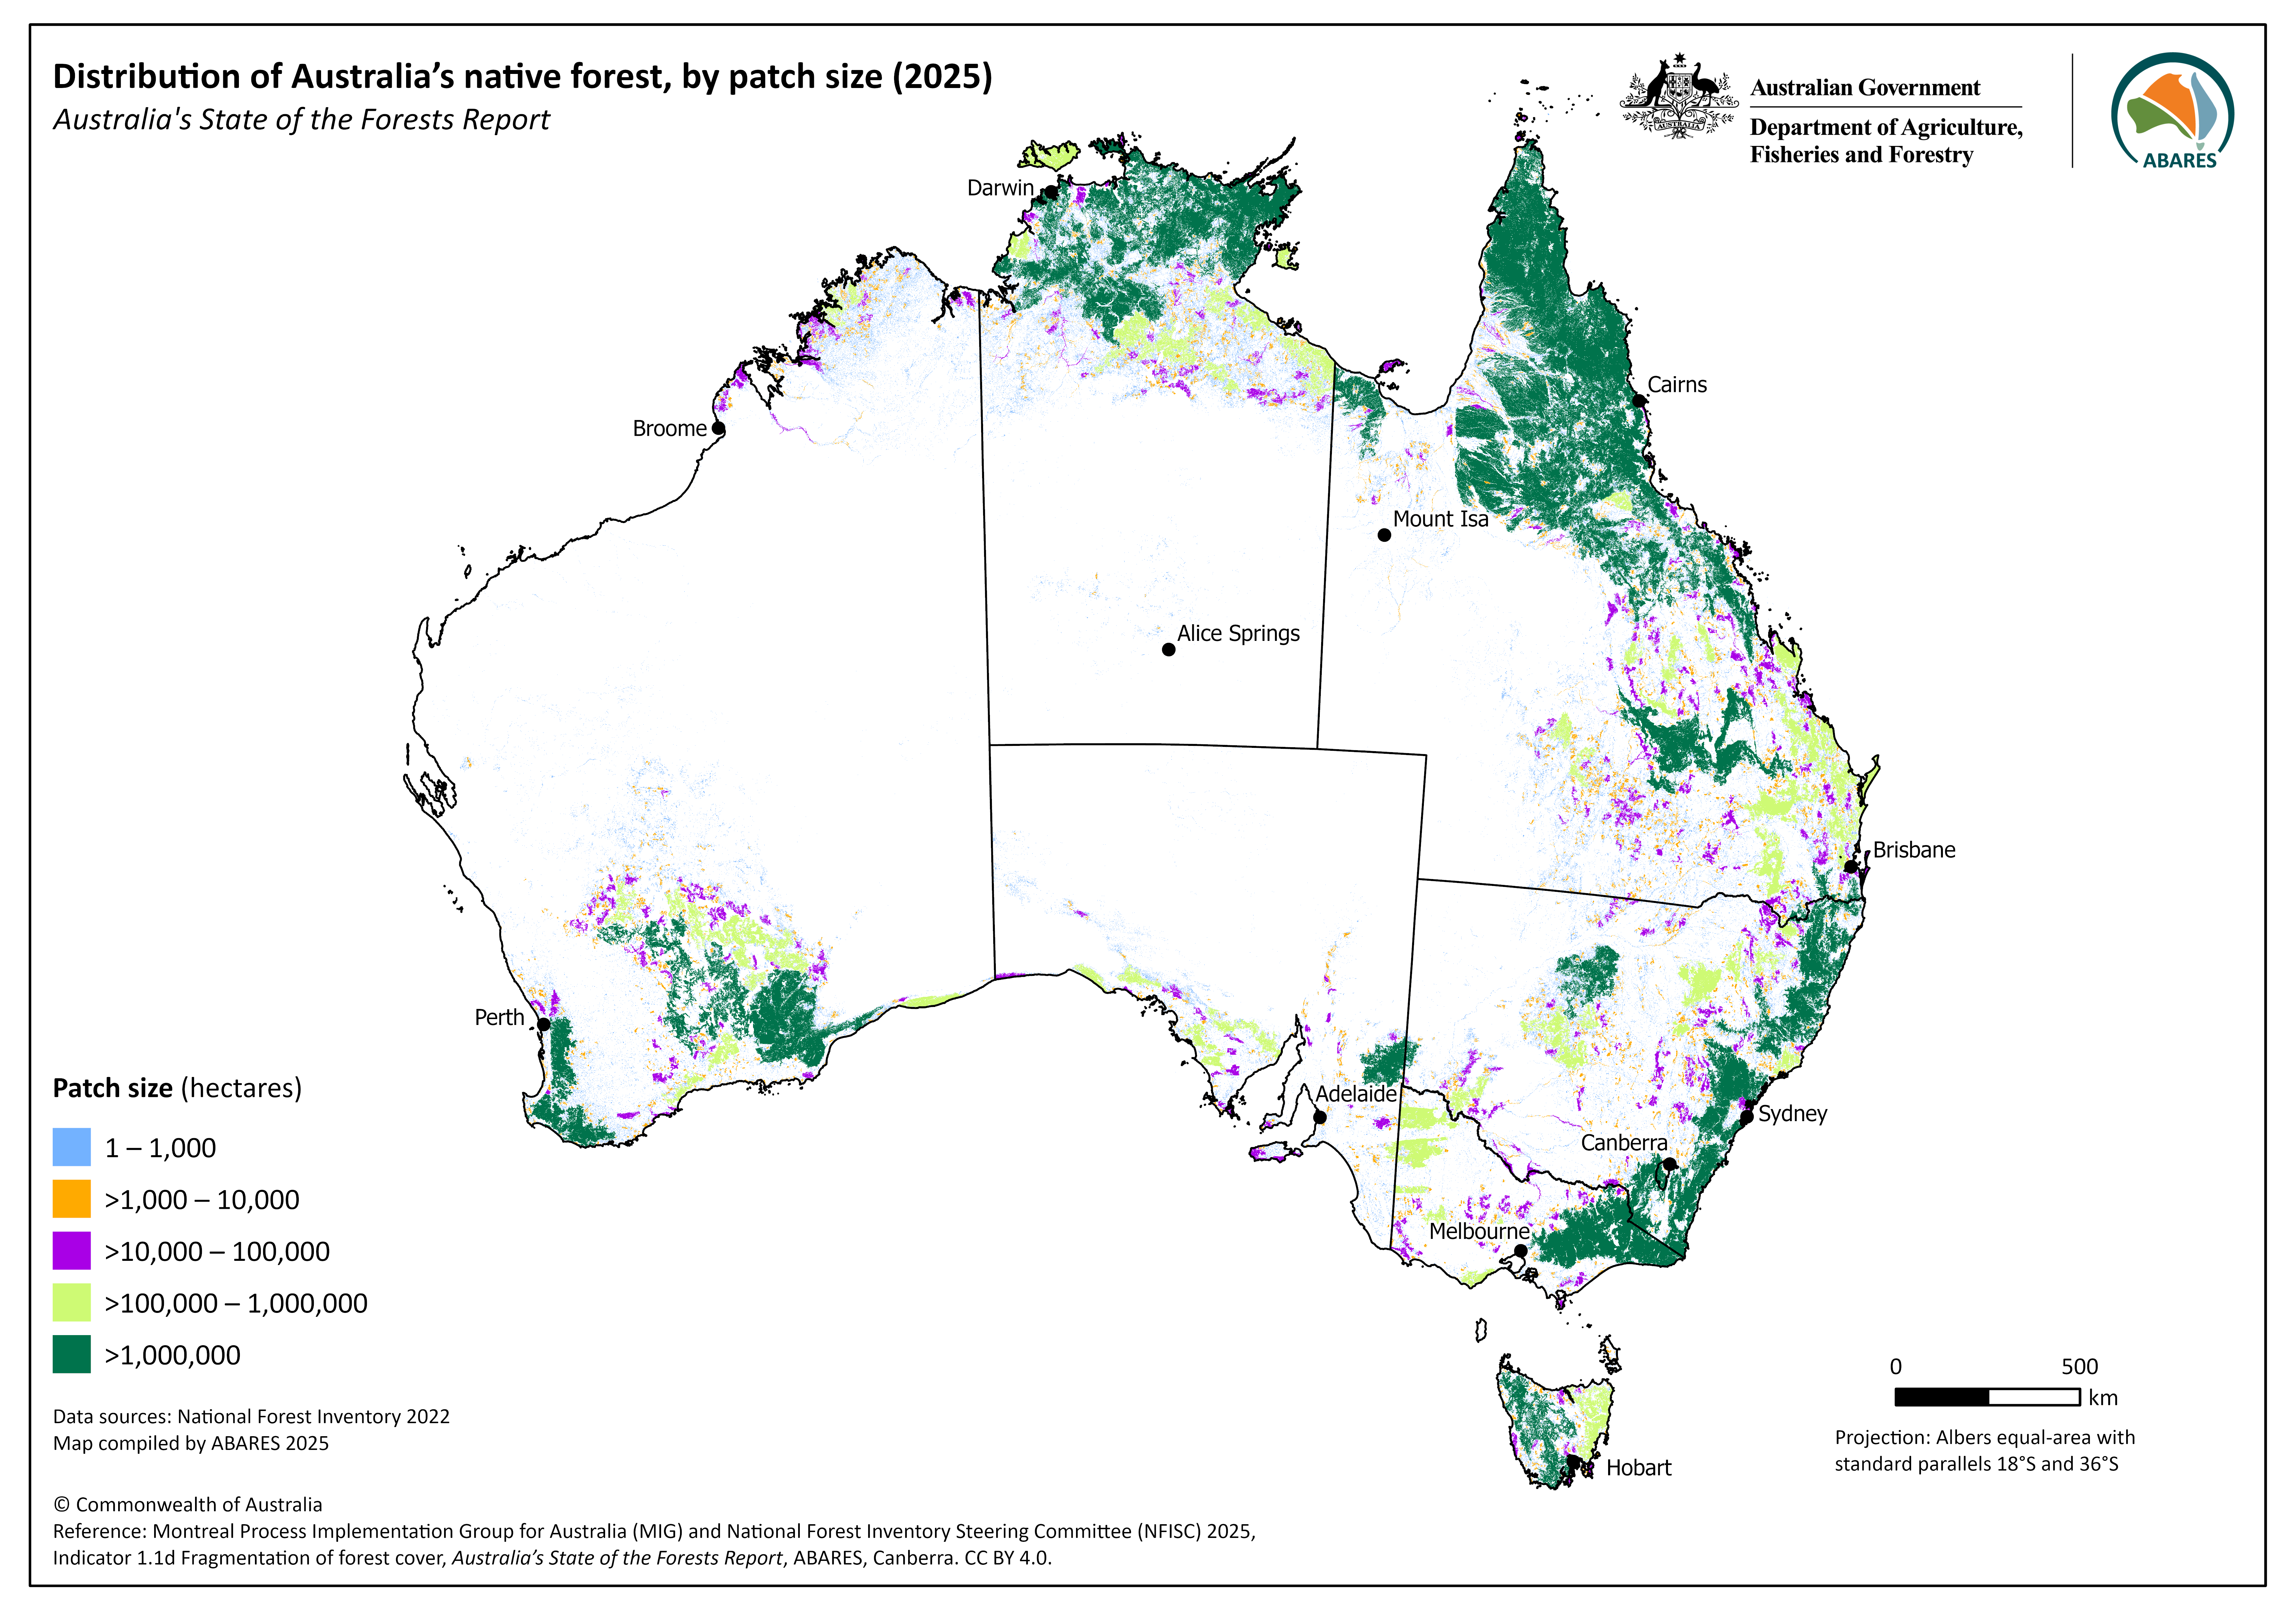
- 53% of Australia’s native forest is in patch sizes of over 1 million hectares
- The largest areas of continuous forest occur in Queensland and the Northern Territory.
- Woodland forest cover is the main component of fragmented forest, likely from the natural interspersion of woodland forest with areas of non-forest vegetation, as occurs in drier ecoregions of Australia, and historic clearing for agriculture
- 31% of Woodland forest class are forest-exterior units (forest edge), compared to 16% of Open forest and 14% of Closed forest.
A total of 73% of Australia’s native forest area (95.6 million hectares) is continuous, indicating low fragmentation. The remaining 27% of native forest (35.9 million hectares) is fragmented.
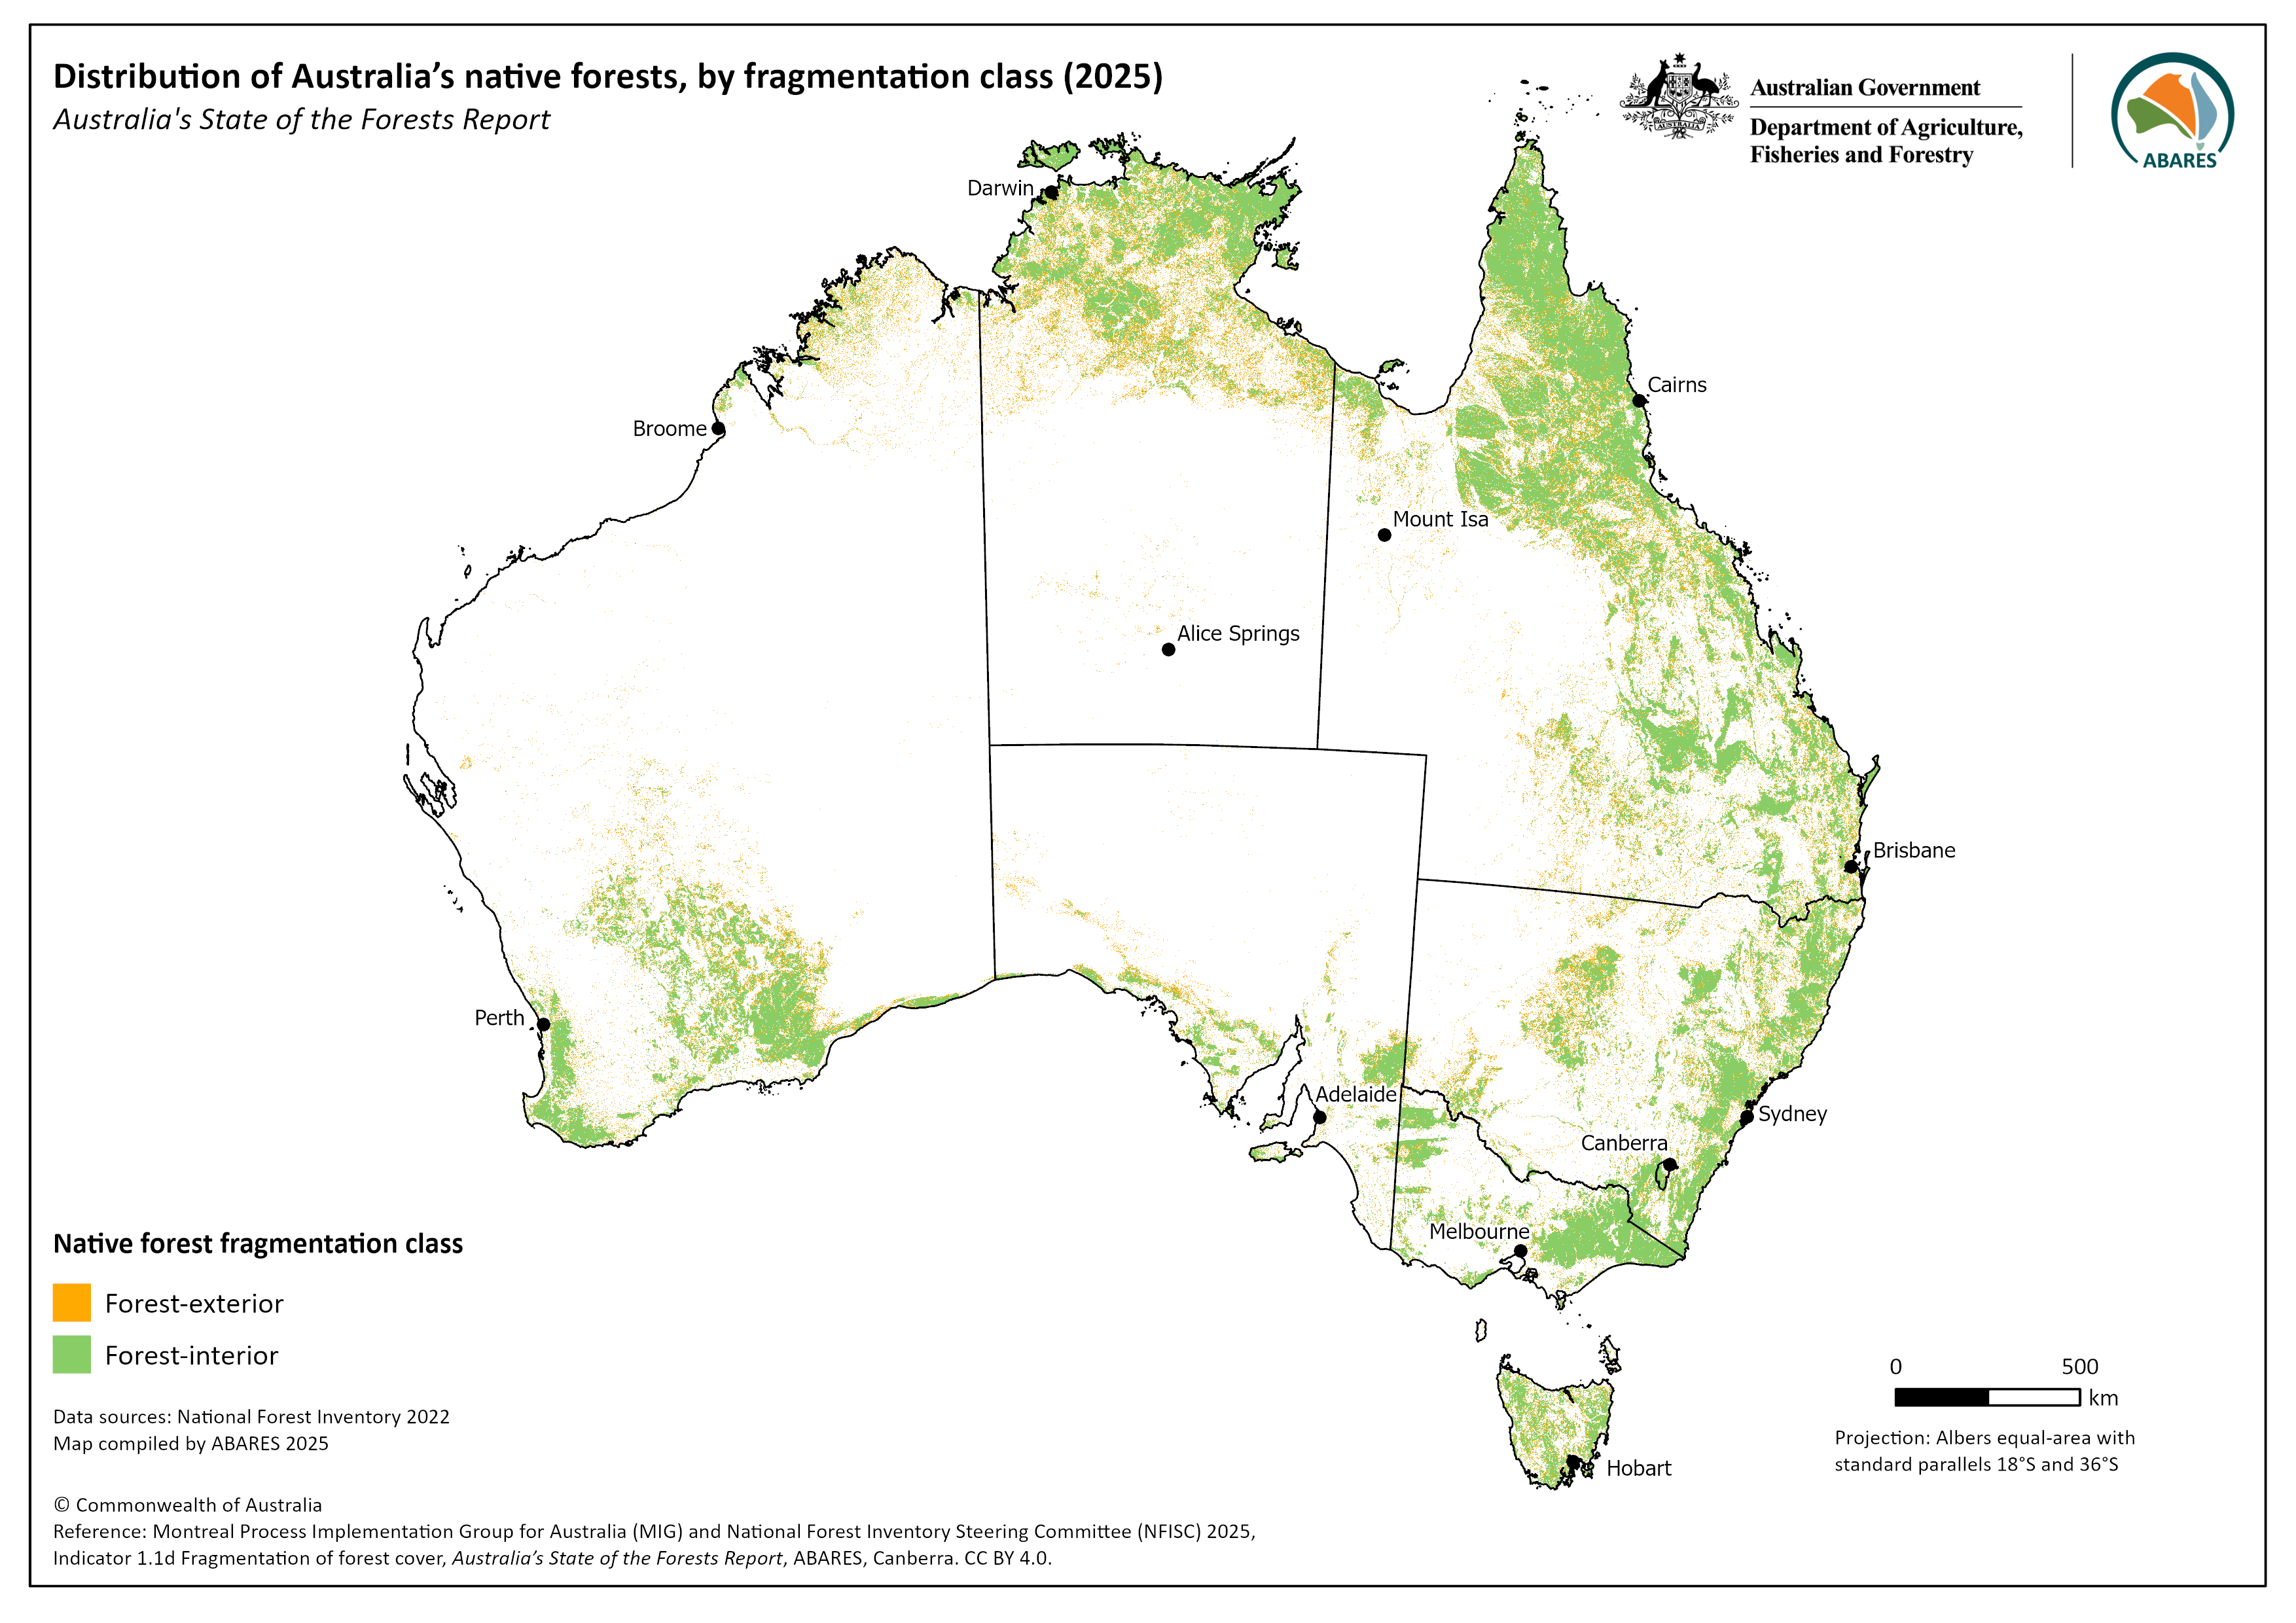
Nationally, native forest with the lowest fragmentation occurs in regions of higher rainfall and in regions that have experienced lower rates of land clearing. The states and territories with the highest proportion of continuous native forest (forest-interior) are the Australian Capital Territory (88% of native forest) and Victoria (87%), whereas the lowest proportion of continuous forest (forest-interior) are in South Australia (64%), Northern Territory (65%) and Western Australia (68%). The distribution of native forest by fragmentation class (forest-interior and forest-exterior) across Australia is shown in Figure 1.1d-1.
The continuous cover or ‘forest-interior’ areas are comprised of one-hectare native forest units bounded by other native forest units. Fragmented forest areas have native forest units with at least one edge having an adjoining unit that is not native forest. These native forest units are known as ‘forest-exterior’ and are an indicator of fragmentation. See Supporting information for Indicator 1.1d for the full method and data sources used for calculating national forest fragmentation statistics.
Click here for a Microsoft Excel workbook of the data for Table 1.1d-1.
Click here for high-definition copy of Figure1.1d-1.
Drivers of forest fragmentation include natural processes and landscape features, and human influences. These factors are not separated in the reporting for this indicator.
Natural drivers of forest fragmentation include geology and soil variability, topography, and rainfall gradients, all of which influence the distribution of vegetation communities and vegetation structure, and result in a natural mosaic of habitats and related species.
Human-induced drivers of forest fragmentation arise from land use change where forest has been cleared for agriculture, urban development, and infrastructure such as roads and high voltage power transmission lines. This typically results in a distinct boundary between forest and non-forest, and creates edge effects in forests that otherwise would be areas of continuous (interior) forest. Edge effects can include a change in the composition of forest fauna and flora species (for example, species that occupy forest-edge habitats) or reducing the ecosystem function of forest and habitat values (for example, through the invasion of weeds and an increased exposure to wind). Impacts from forest fragmentation can lead to reduced habitat quality and quantity for forest-dwelling species that rely on continuous areas of forest.
The main cause of increasing forest fragmentation over the past 200 years has been forest clearing associated with land use change, mainly for agriculture, mining and urban development, but also for infrastructure such as roads, railways, pipelines and power lines. As much as one-third of Australia’s native woody vegetation in intensively used areas (mainly the agricultural and urban zones) has been cleared or substantially modified over that time1.
1 Derived from information published in 2021 Australia State of the Environment report Land chapter.
Australia’s forests are classified into three structural classes: woodland forest (crown cover of 20–50%), open forest (crown cover of >50–80%) and closed forest (crown cover of >80%). Woodland forest is more fragmented (31% of total woodland forest area) compared to open forest (16%) and closed forest (14%). (Table 1.1d-2).
Woodland forest is naturally more fragmented than open and closed forests as it often transitions into sparse woodland and other non-forest vegetation, usually reflecting changes in rainfall and soil types. Fragmentation in woodland forest also reflects historic land management practices across southern Australia when it was extensively cleared, mainly for agricultural land uses (see Bradshaw 2012). Woodland forest in drier areas of Australia and northern Australia has not been as extensively cleared, contributing to the 69% of woodland forest class that is classified as continuous (forest-interior).
Woodland forest also accounts for the largest area of forest by cover type (71% of Australia’s total forest area, see Indicator 1.1a.i), and is widespread across Australia. See Supporting information for Indicator 1.1a-i for an explanation of forest cover types.

Click here for a Microsoft Excel workbook of the data for Table 1.1d-2.
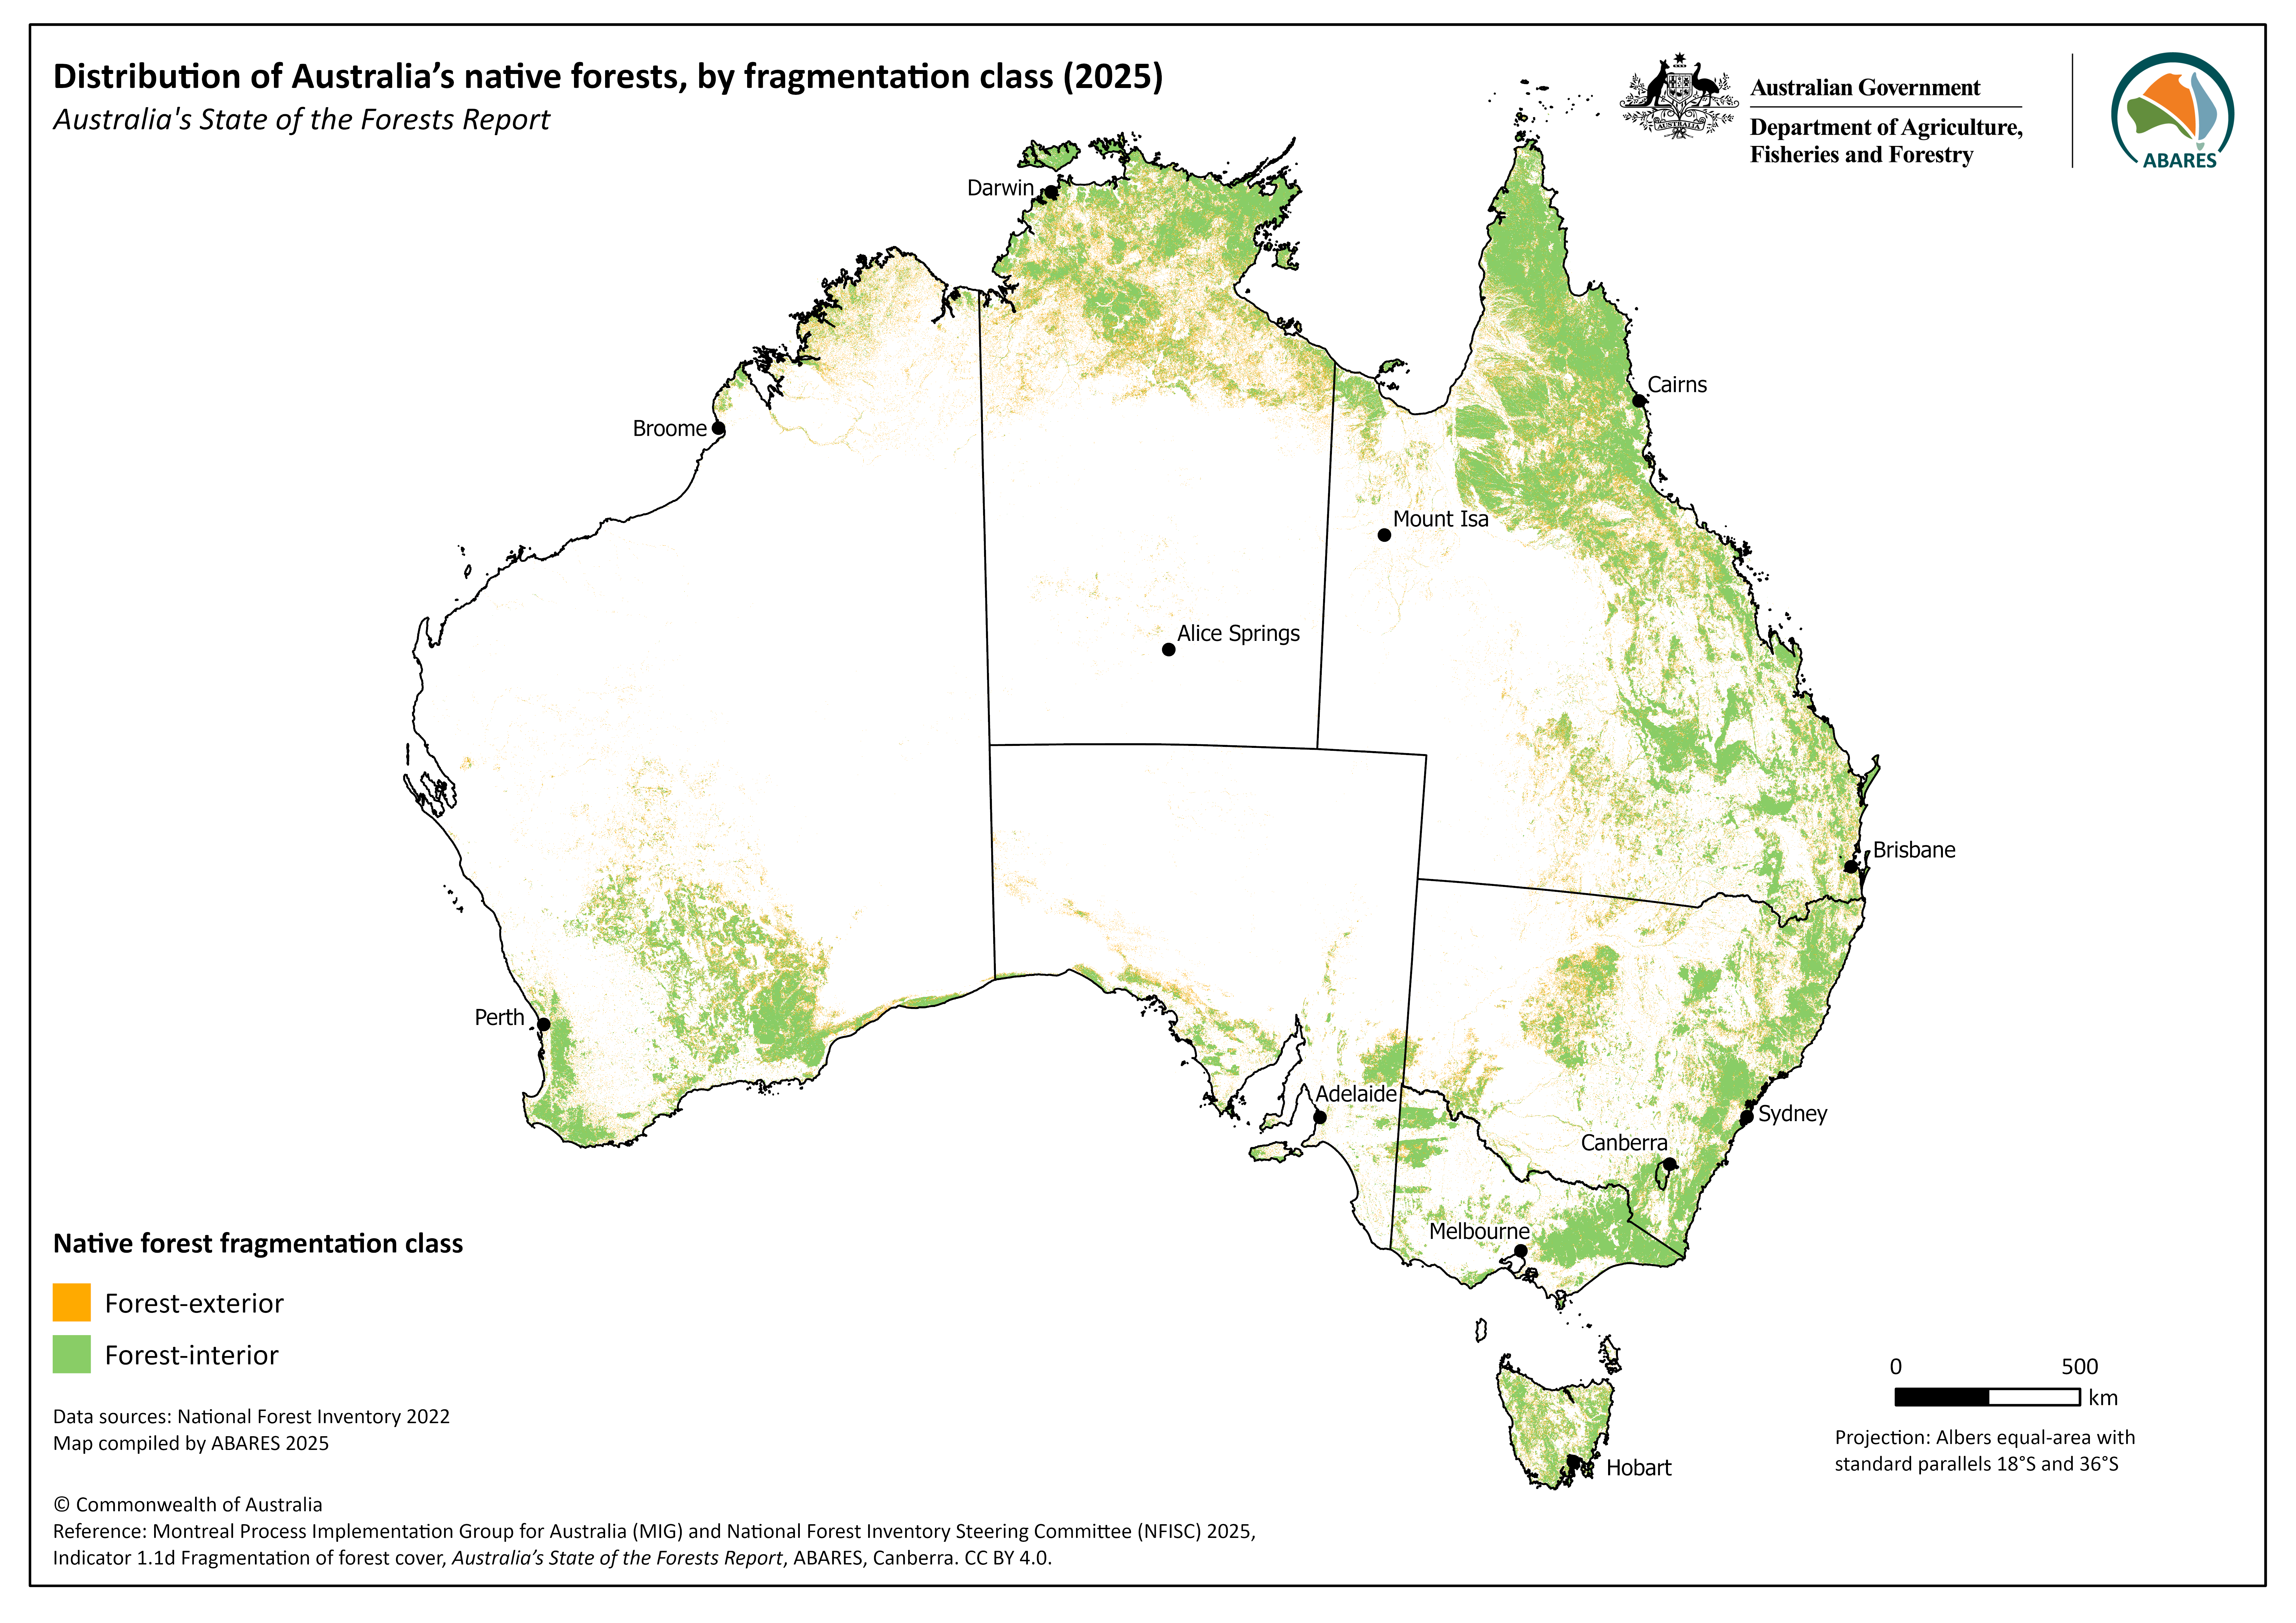
Just over half (53%) of Australia’s native forest is in patch sizes of over 1 million hectares, while 10% occurs in patch sizes of 100 hectares or smaller (Table 1.1d-3). The distribution of native forest by patch size across Australia is shown in Figure 1.1d-2.
Patch size reflects the extent to which forest is fragmented: large patches are considered unfragmented, whereas smaller patches are considered more fragmented. Patches sizes are calculated from the number of edge-adjoining one-hectare units, as explained in Supporting information for Indicator 1.1d. At the scale of the forest mapping undertaken for the National Forest Inventory, narrow breaks in forest cover (for example, a minor road), may not sufficiently interrupt the derived forest cover to influence fragmentation analysis. Forest fragmentation is also relative to the species or process, and can occur at multiple scales.
At the national scale there are 11 patches greater than 1 million hectares (Table 1.1d-4). The largest patches of continuous forest are in Queensland (28.2 million hectares) and in the Northern Territory (12.8 million hectares). Elsewhere, large patches occur in Western Australia (6.4 million hectares), Victoria (4.0 million hectares), New South Wales (4.0 million hectares) and Tasmania (1.8 million hectares). These patches are generally found in sparsely populated regions where extensive areas are managed for protection and/or have been subject to relatively low rates of historical land clearing.
South Australia has the highest proportion of native forest in small patch sizes, with 29% of native forest in patches of 1,000 hectares or less (Table 1.1d-3). The average patch size of these patches is 4.6 hectares. This is in part because forest in South Australia is predominantly woodland forest, which is naturally more fragmented, especially as mean annual rainfall decreases.

Click here for a Microsoft Excel workbook of the data for Table 1.1d-3.

Click here for a Microsoft Excel workbook of the data for Table 1.1d-4.
Forest fragmentation is widely recognised as a threat for forest-dwelling species in Australia (see Bradshaw 2012), as it can reduce the habitat available for fauna and flora species requiring large areas of continuous forest.
However, fragmentation can also have indirect effects on forests, making it complex to quantify. With increasing fragmentation of forest, the amount of forest-exterior increases, exposing more forest to influences from the non-forest landscape. For example, this edge-effect can increase the impact of wind and incursion of weeds and introduced animals into forest-interior areas, which can lead to a reduction of forest condition and increase pressures on native fauna and flora species. The impact of fragmentation generally increases when forests are divided into smaller patches.
No simple fragmentation metric can be used as a surrogate for habitat quality for forest-dwelling species, as species respond to more complex habitat features and landscape patterns (Lindenmayer et al. 2003). Thus, it is not possible to use the analysis undertaken for this indicator to assess the impact of fragmentation on threatened forest-dwelling species.
Data on threatened forest-dwelling species and threatened forest ecological communities, and threats to them, are explored in Indicator 1.2b.
ABARES (2023). Forests of Australia (2023), Australian Bureau of Agricultural and Resource Economics and Sciences, Canberra, December. CC BY 4.0. doi.org/10.25814/6cay-a361.
Bradshaw CJA (2012). Little left to lose: deforestation and forest degradation in Australia since European colonization. Journal of Plant Ecology 5:1, 109–120. doi.org/10.1093/jpe/rtr038.
Lindenmayer D, Lesslie R, McAlpine C, Phinn S, Eyre T, Norman P (1999). The development and implementation of landscape metrics for reporting forest fragmentation at field and landscape levels. Project Summary of Outcomes for Forest and Wood Products Research and Development Corporation, Melbourne.
Montreal Process Implementation Group for Australia and National Forest Inventory Steering Committee (2013). Australia’s State of the Forests Report 2013, ABARES, Canberra, December.
Montreal Process Implementation Group for Australia and National Forest Inventory Steering Committee (2018). Australia’s State of the Forests Report 2018, ABARES, Canberra, December. CC BY 4.0.
Montreal Process Implementation Group for Australia (MIG) and National Forest Inventory Steering Committee (NFISC) (2023). Indicator 1.1a.i Forest area by forest type, Australia’s State of the Forests Report. Australian Bureau of Agricultural and Resource Economics and Sciences, Canberra, December. CC BY 4.0.
Montreal Process Implementation Group for Australia (MIG) and National Forest Inventory Steering Committee (NFISC) (2024). Indicator 1.2b: The status of forest dwelling species at risk of not maintaining viable breeding populations, as determined by legislation or scientific assessment, Australia’s State of the Forests Report, Australian Bureau of Agricultural and Resource Economics and Sciences, Canberra, October. CC BY 4.0.
Tickle P, Hafner S, Lesslie R, Lindenmayer D, McAlpine C, Mackey B, Norman P, Phinn S (1998). Scoping Study: Montreal Indicator 1.1.e Fragmentation of Forest Types – Identification of Research Priorities. Forest and Wood Products Research and Development Corporation and the Bureau of Resource Sciences, Canberra.
Further information
Click here for Supporting information on Indicator 1.1d: Fragmentation of forest cover (2025), including:
- Method for national forest fragmentation statistics