Below are the key maps from the latest updates to Australia’s State of the Forests Report.
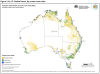
Australia's forest, by forest category
This map shows the extent and distribution of Australia's forests by forest category. PNG [1.4 MB]
![PNG [1.4 MB]](/sites/default/files/documents/Forests_of_Australia_2023_by_category_600dpi.png)
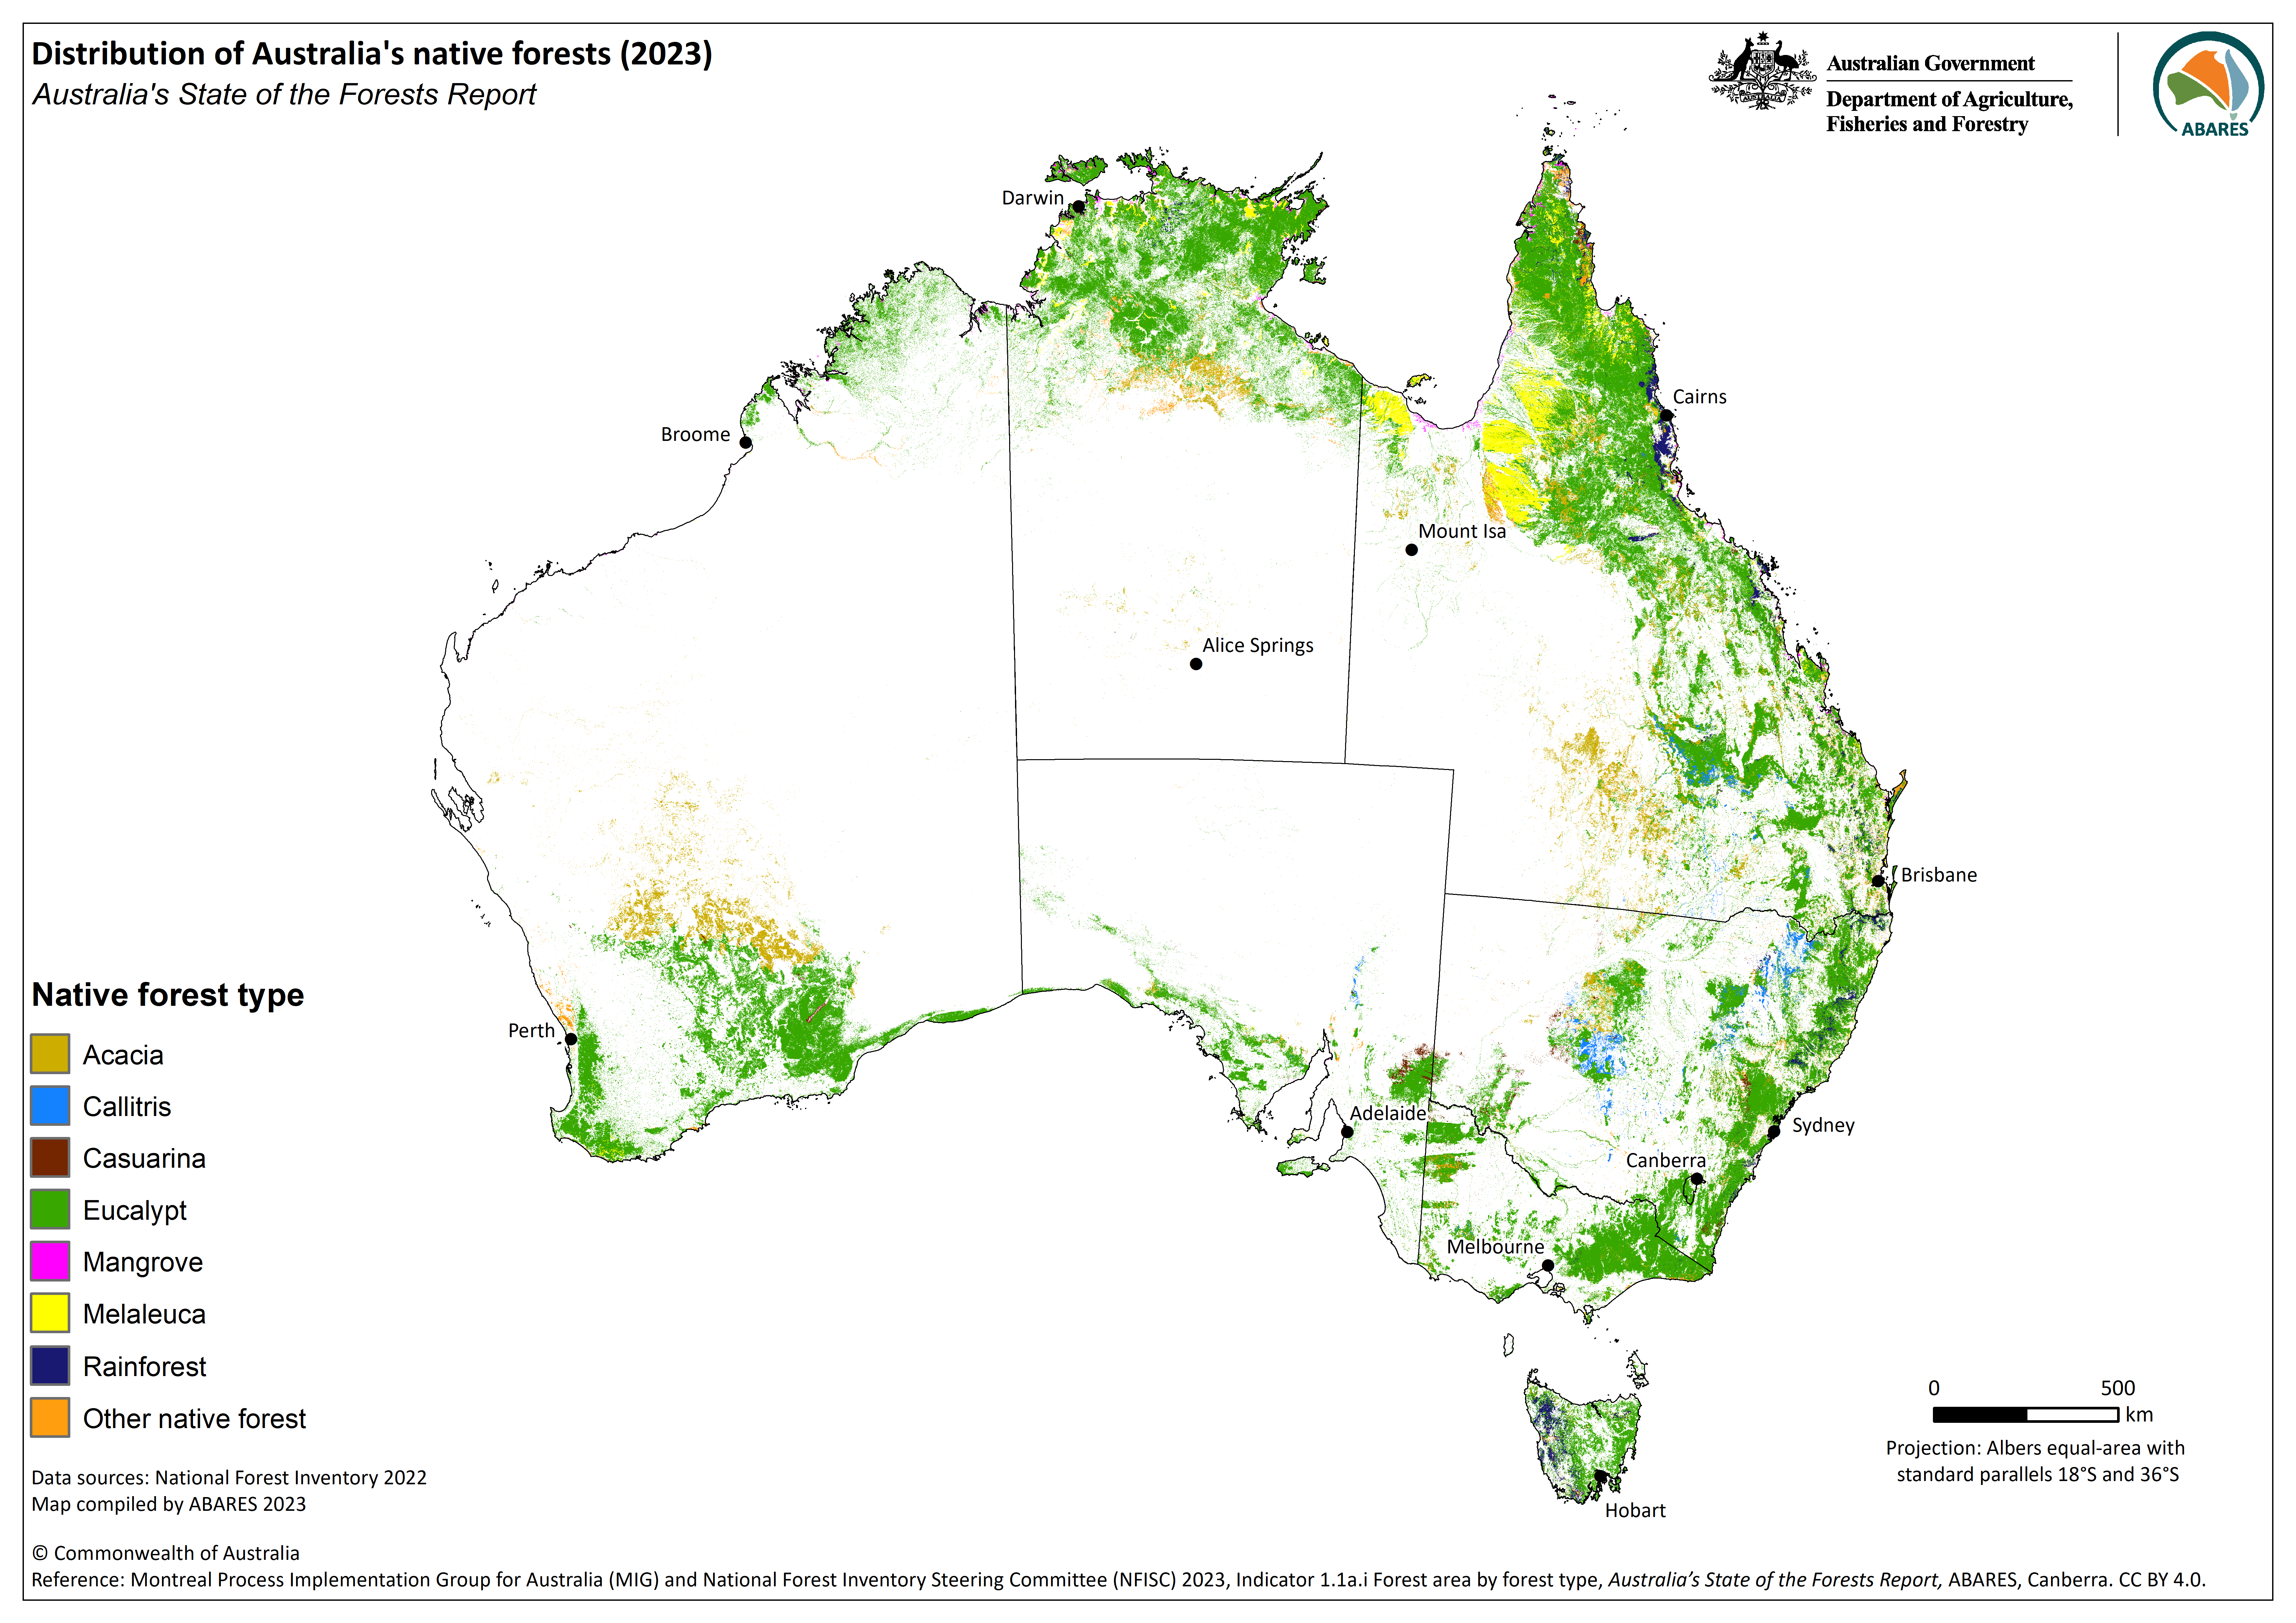
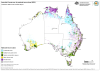
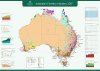
Australia's native forest, by forest type
This map shows the extent and distribution of Australia's native forests by forest type. PNG [1.8 MB}
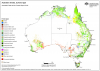
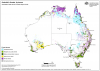
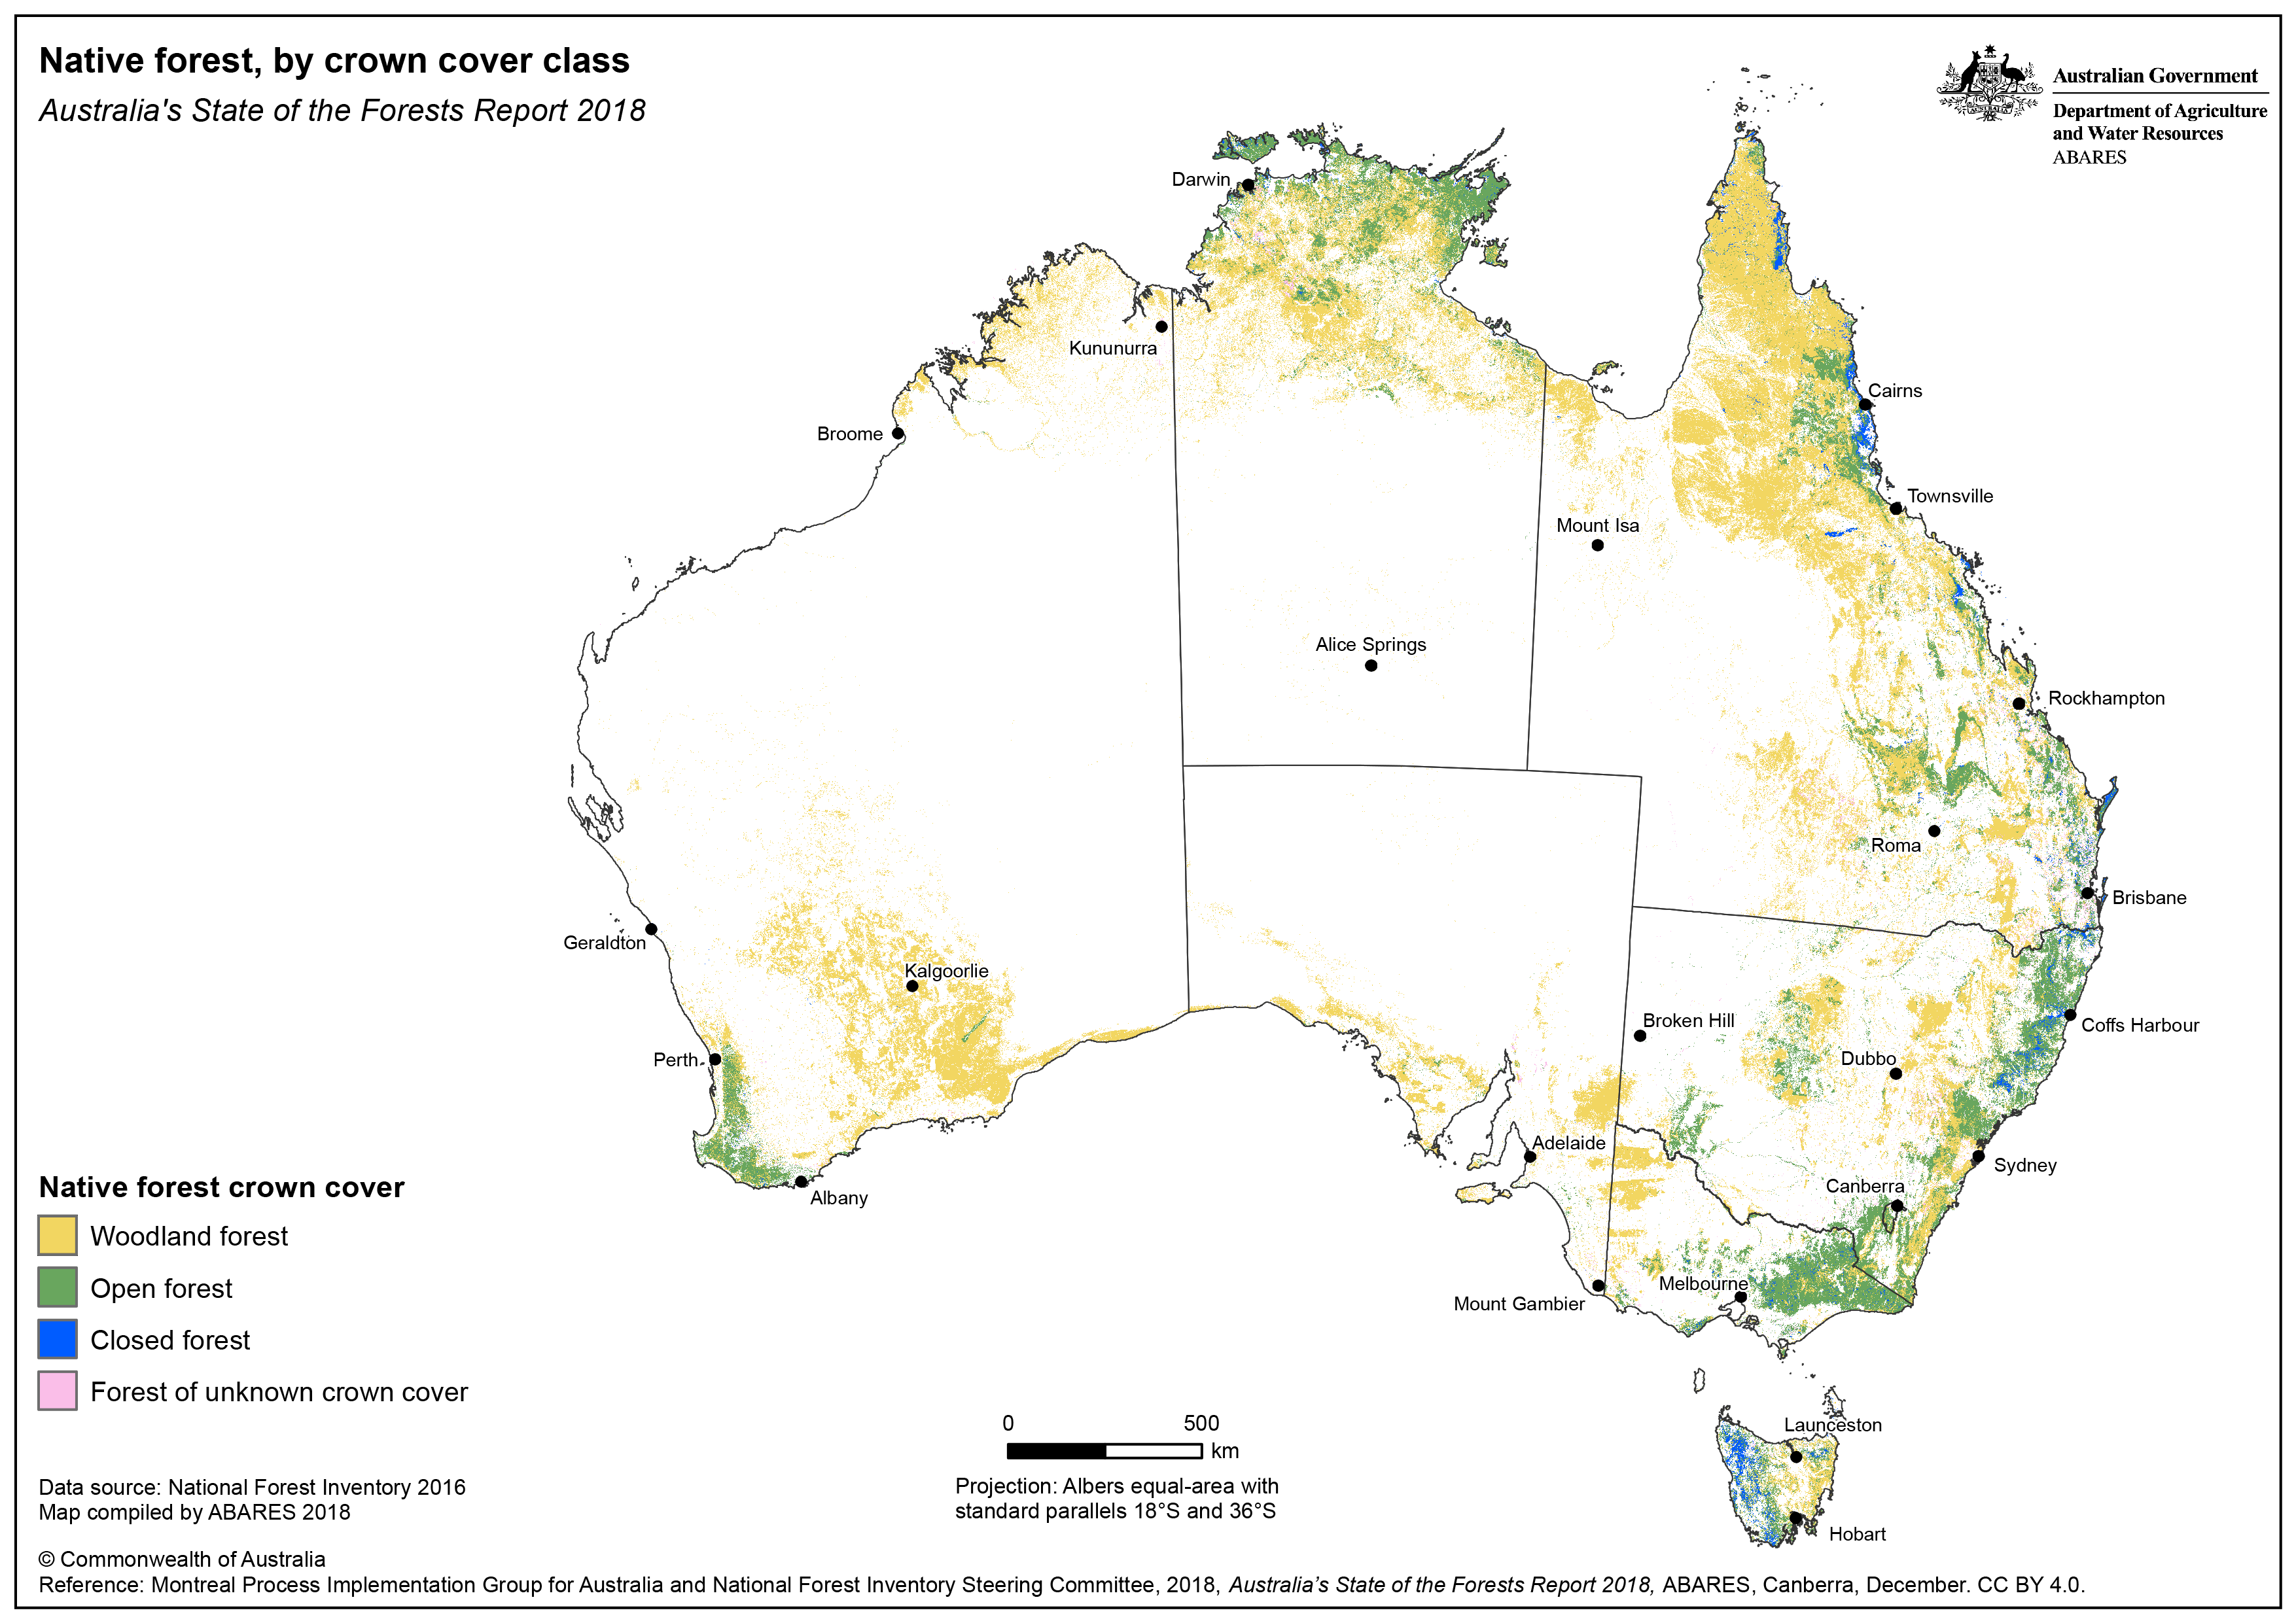
Australia's native forest, by crown cover class
This map shows the extent and distribution of Australia's native forests by crown cover class. PNG [1.8 MB]
![PNG [1.8 MB]](/sites/default/files/documents/Native_forest_by_crown_cover_2023_600dpi.png)
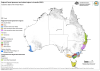
Australia's forest, by national tenure class
This map shows the extent and distribution of Australia's forests by national tenure class. PNG [1.7 MB]
![PNG [1.7 MB]](/sites/default/files/documents/tenure_Australias_forests_2023_600dpi.png)
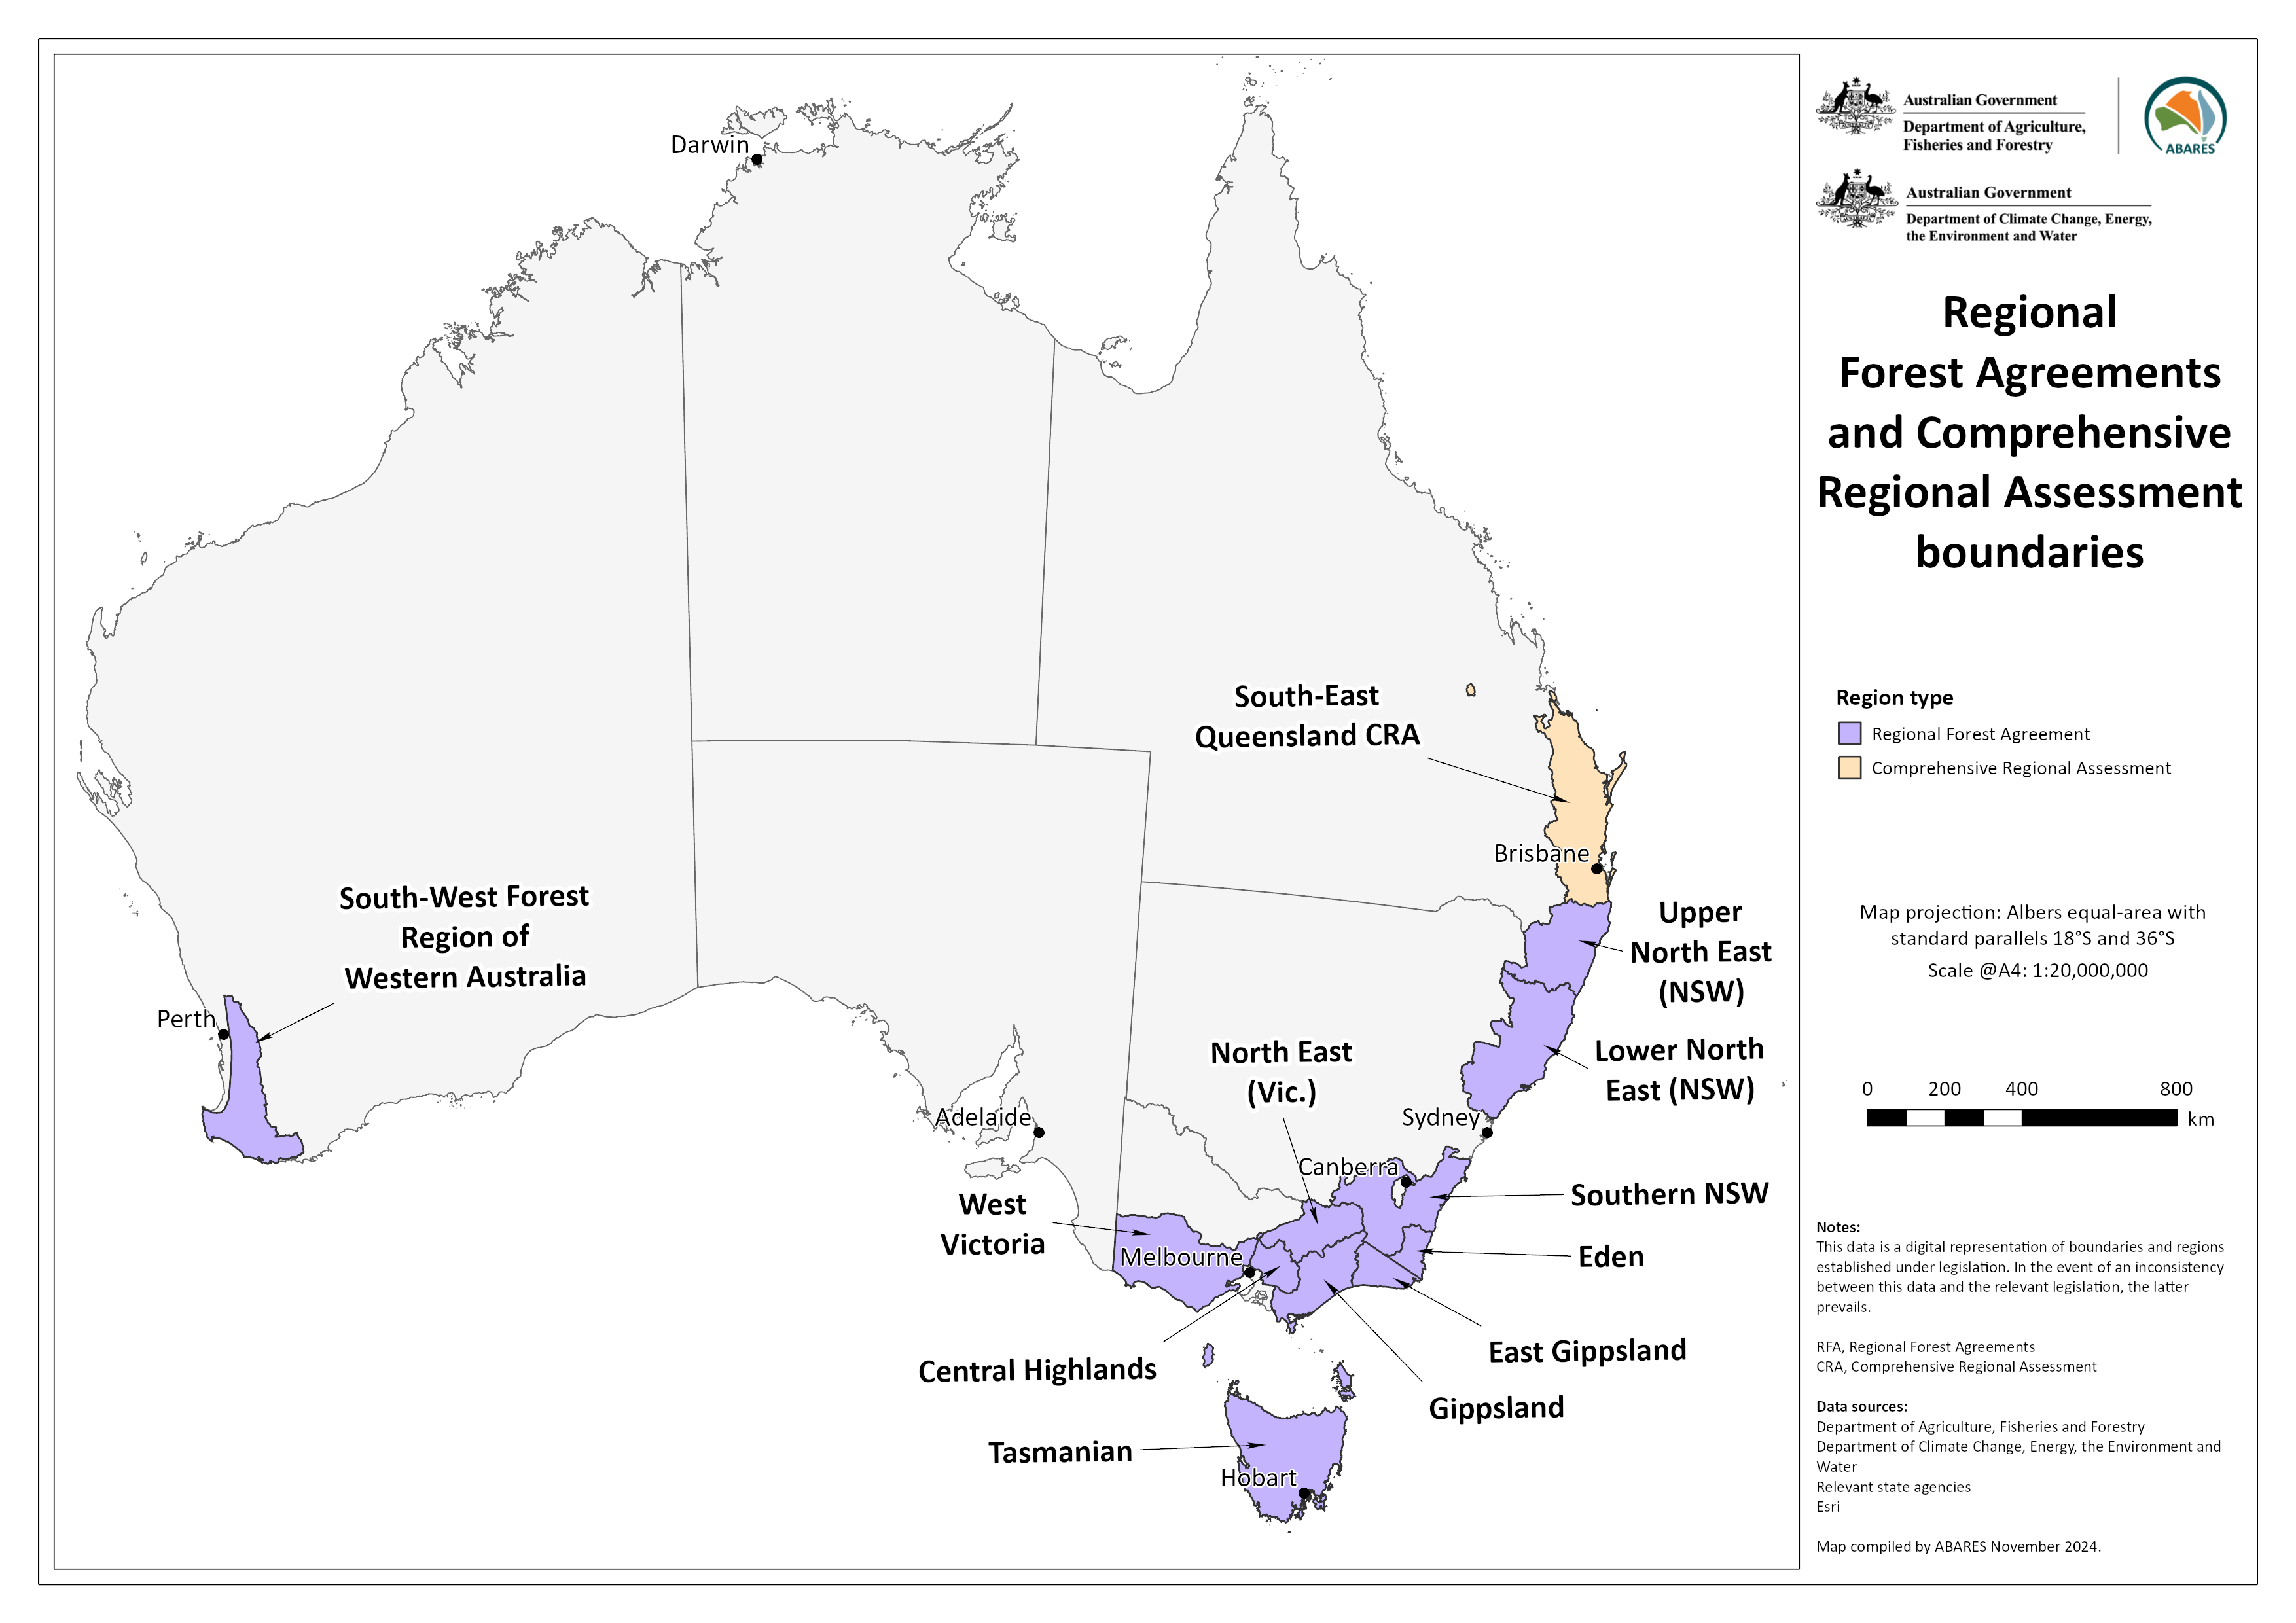
Australia's Regional Forest Agreement and related regions
This map shows the location of regions where forests are managed under a Regional Forest Agreement PNG [1.5 MB]
![PNG [1.5 MB]](/sites/default/files/documents/map_RFA_regions_2023_600dpi.png)
Below are the key maps from Australia’s State of the Forests Report 2018.
Click here to access all of the maps from Australia's State of the Forests Report 2018.
Australia's forest extent and forest type
This map shows the extent and distribution of Australia's forests by forest type: PNG [1.1 MB], PDF [3.6 MB]. View an interactive version of this map in ArcGIS Online map viewer here.
Australia's forest extent and forest tenure
This map shows the extent and distribution of Australia's forests by tenure: PNG [0.9 MB], PDF [3.6 MB]. View an interactive version of this map in ArcGIS Online map viewer.

Australia's native forest crown cover
This map shows the distribution of Australia's native forests by crown cover class (i.e. woodland, open, closed, or unknown): PNG [0.9 MB], PDF [3.6 MB].
Australia's Regional Forest Agreement and related regions
This map shows the location of regions where forests are managed under a Regional Forest Agreement: PNG [0.8 MB], PDF [2.6 MB].

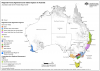
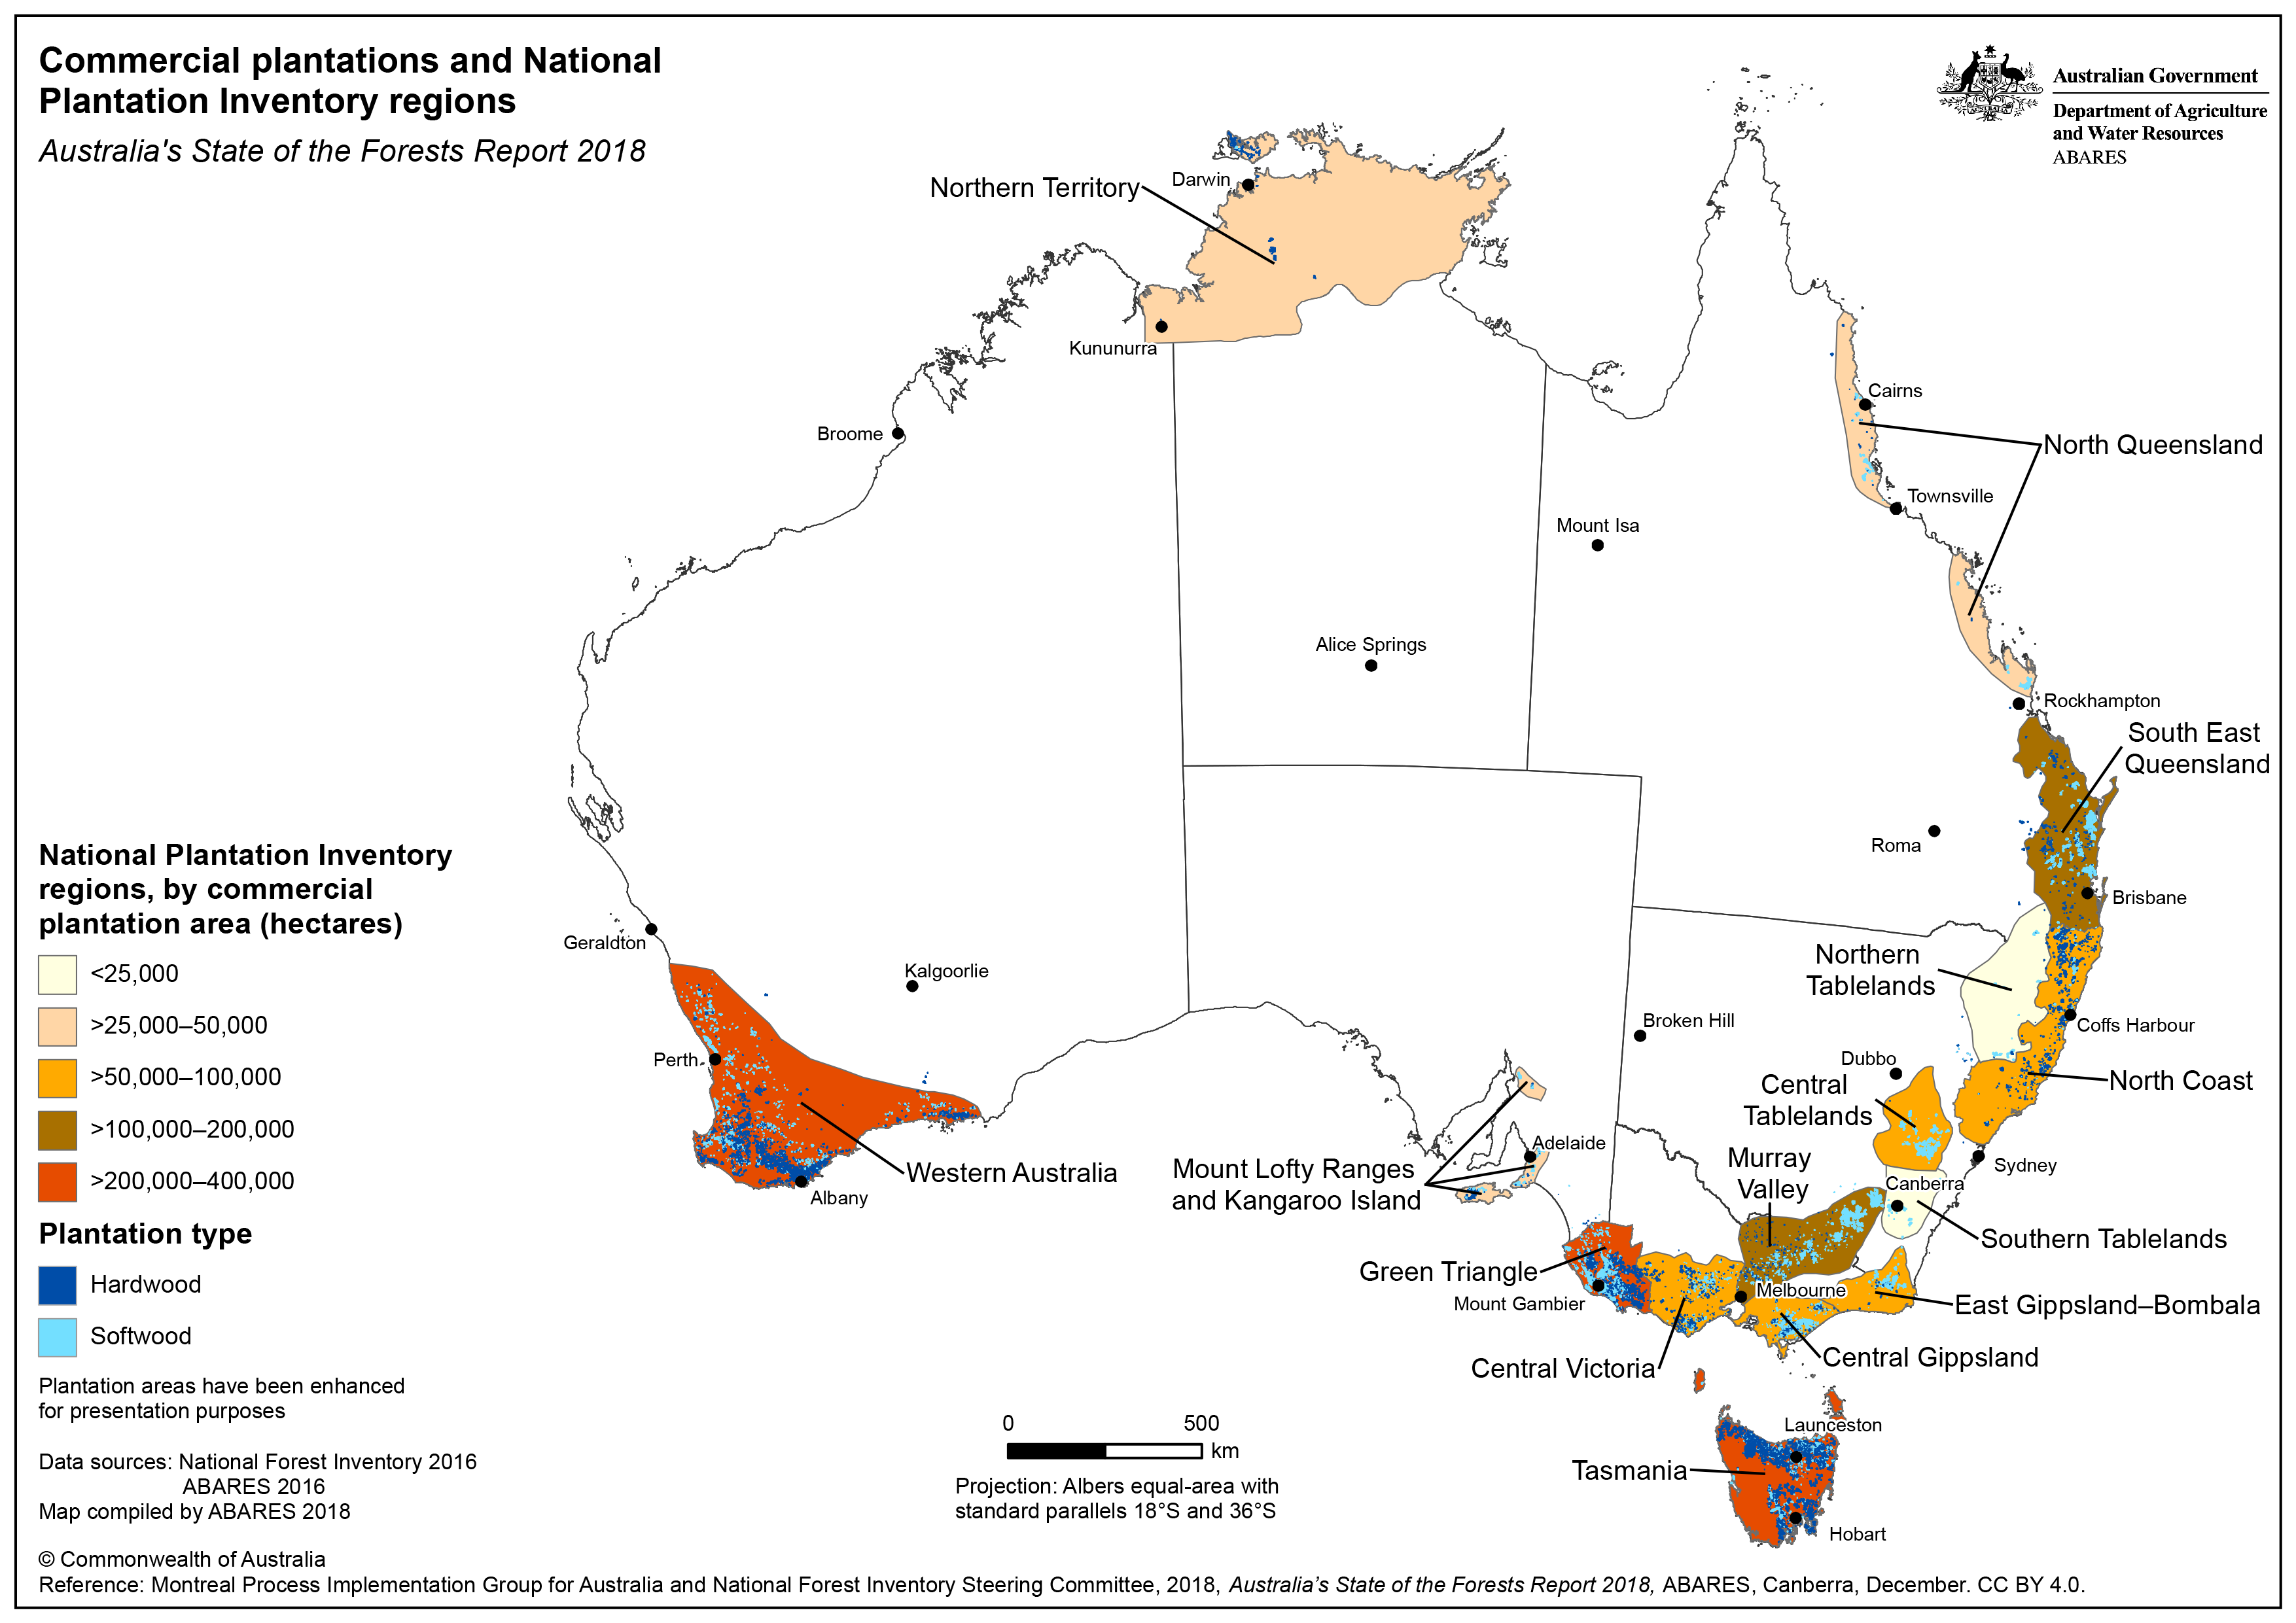
Australia's commercial plantations and National Plantation Inventory regions
This map shows the location of Australia's commercial hardwood and softwood plantations and the boundaries of National Plantation Inventory (NPI) regions: PNG [0.7 MB], PDF [1.4 MB].
Forest burnt in Australia, by number of fires, 2011–12 to 2015–16
This map shows the distribution of burnt forest in Australia by the number of times each hectare was burnt in the period 2011–12 to 2015–16: PNG [0.9 MB], PDF [2.1MB]. View an interactive version of this map in ArcGIS Online map viewer.
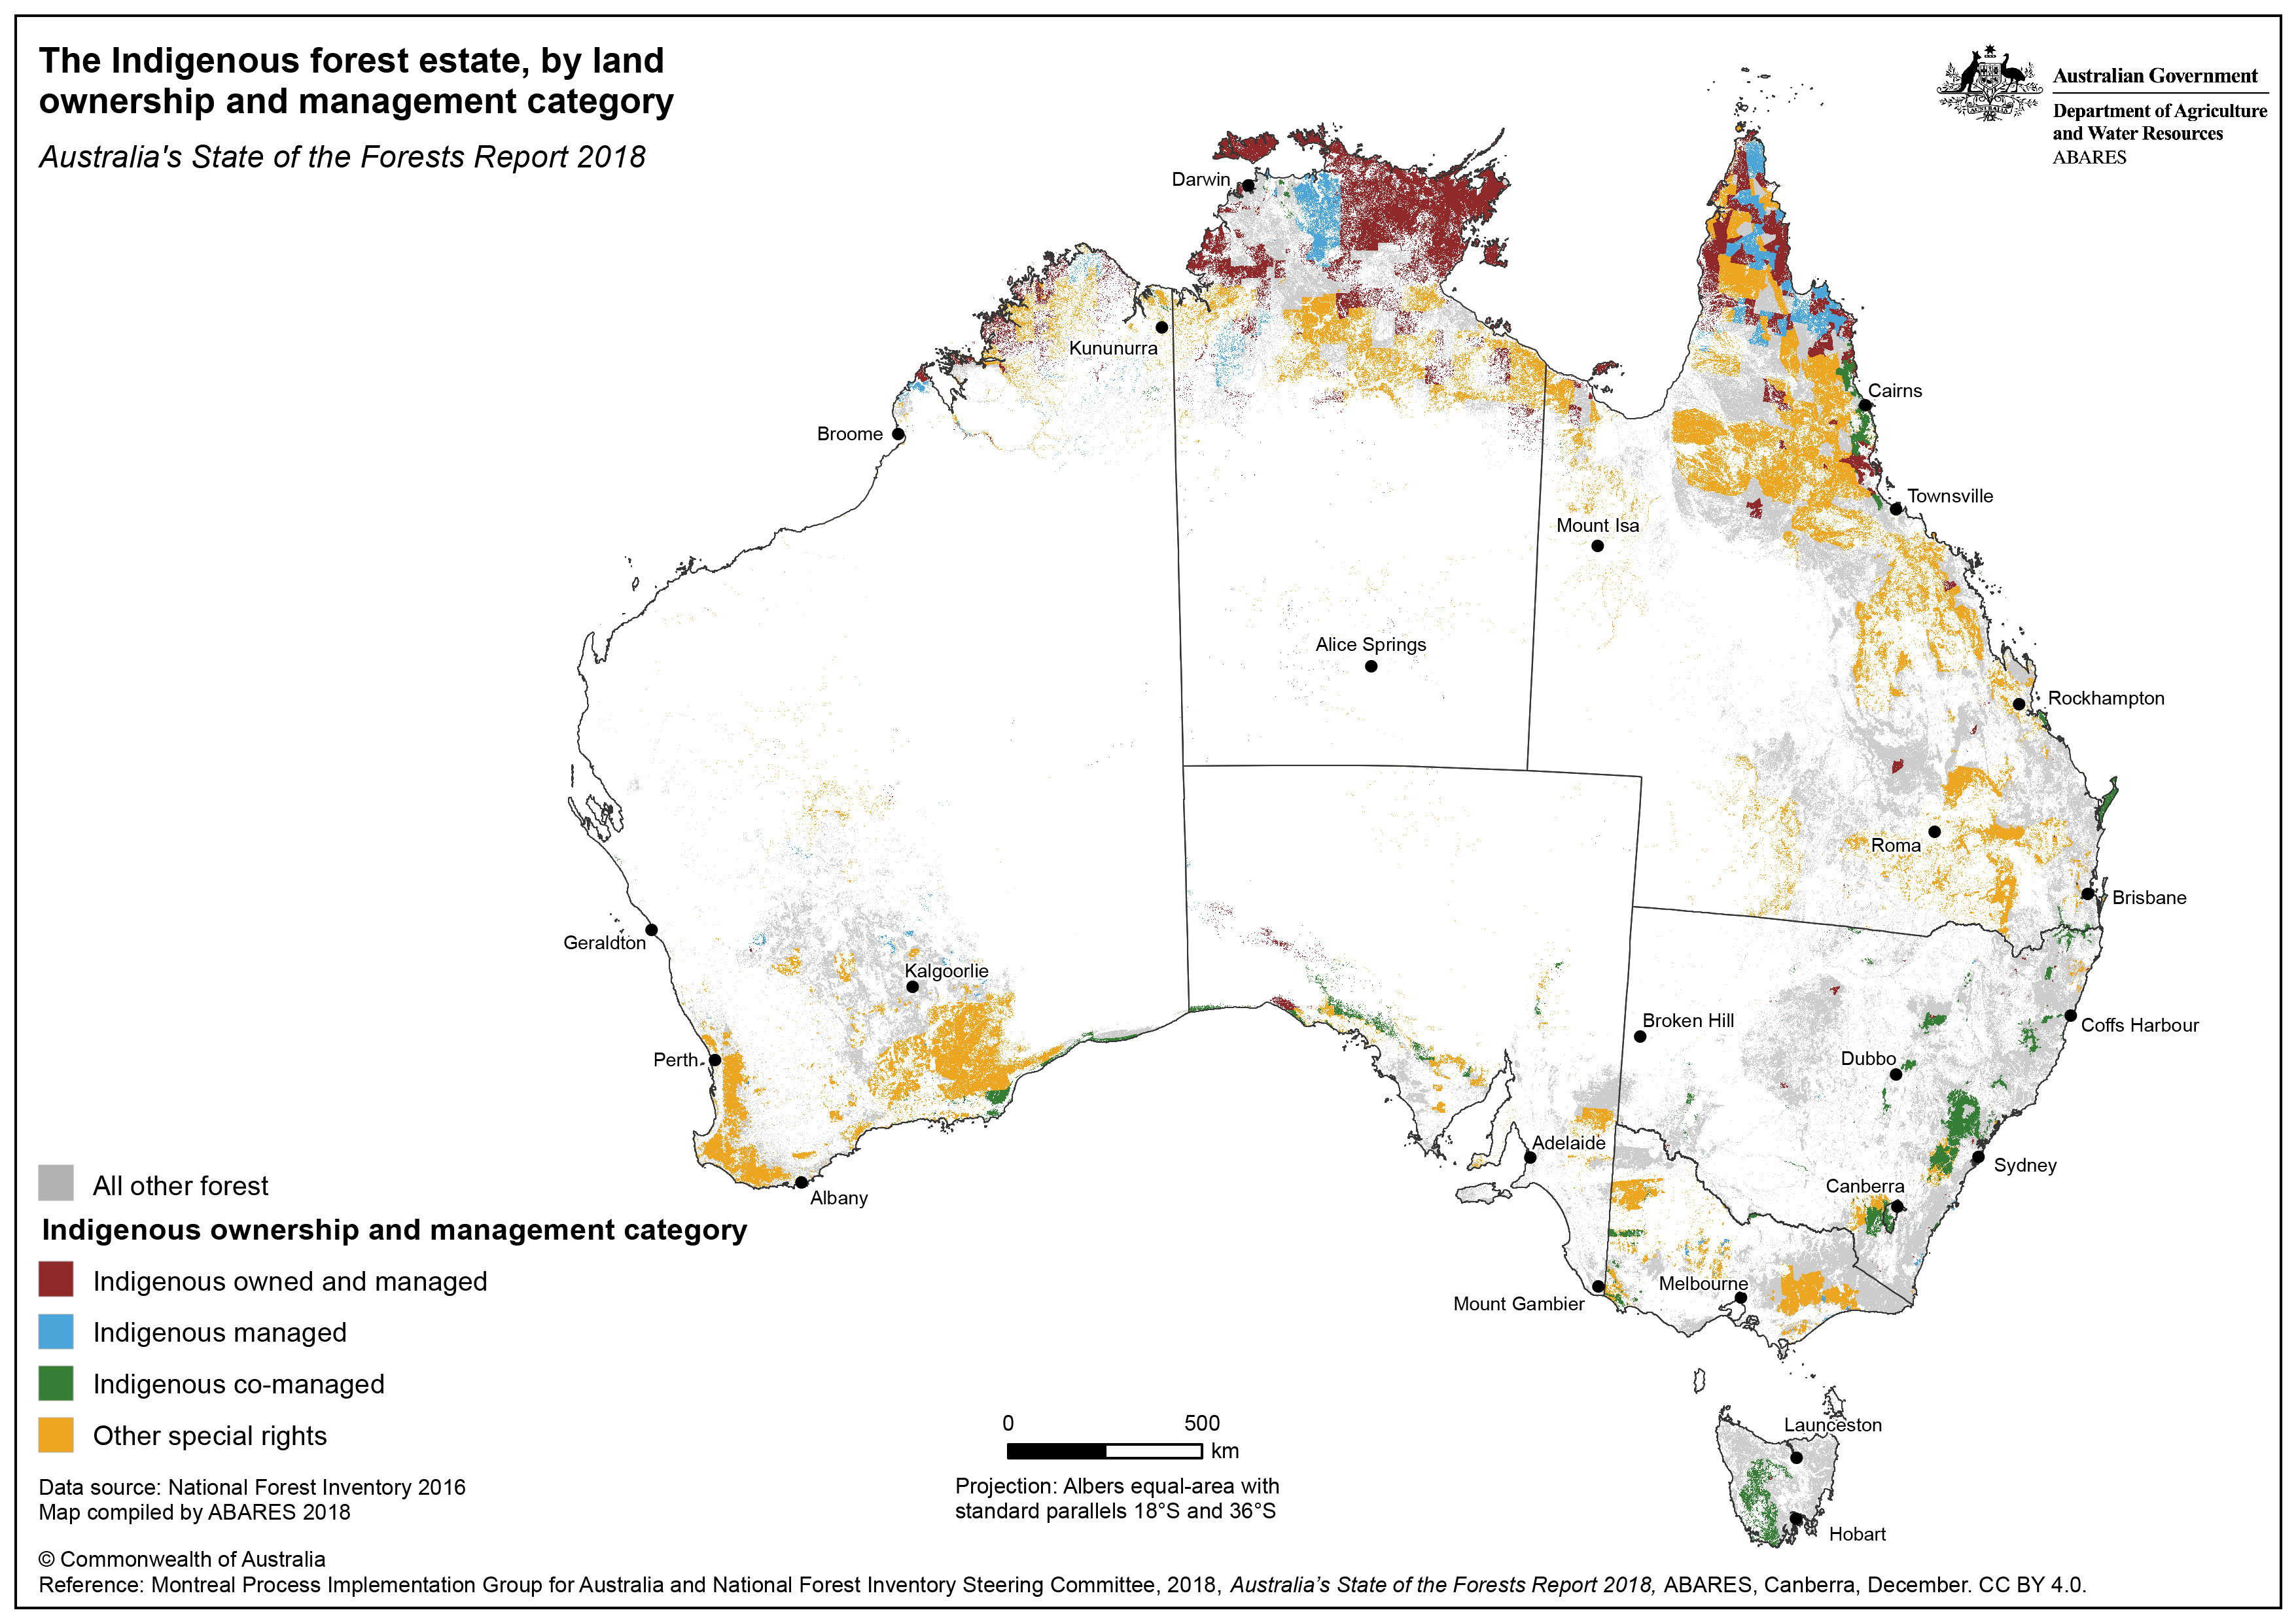
Australia's Indigenous forest estate, by land ownership and management categories
This map shows the location of Australia's Indigenous forest estate, by land ownership and management categories. The categories are: Indigenous owned and managed; Indigenous managed; Indigenous co-managed; having Other special rights (Note: Indigenous is used here to refer to Aboriginal and Torres Strait Islander people): PNG [0.8 MB], PDF [2.3 MB]. View an interactive version of this map in ArcGIS Online map viewer.

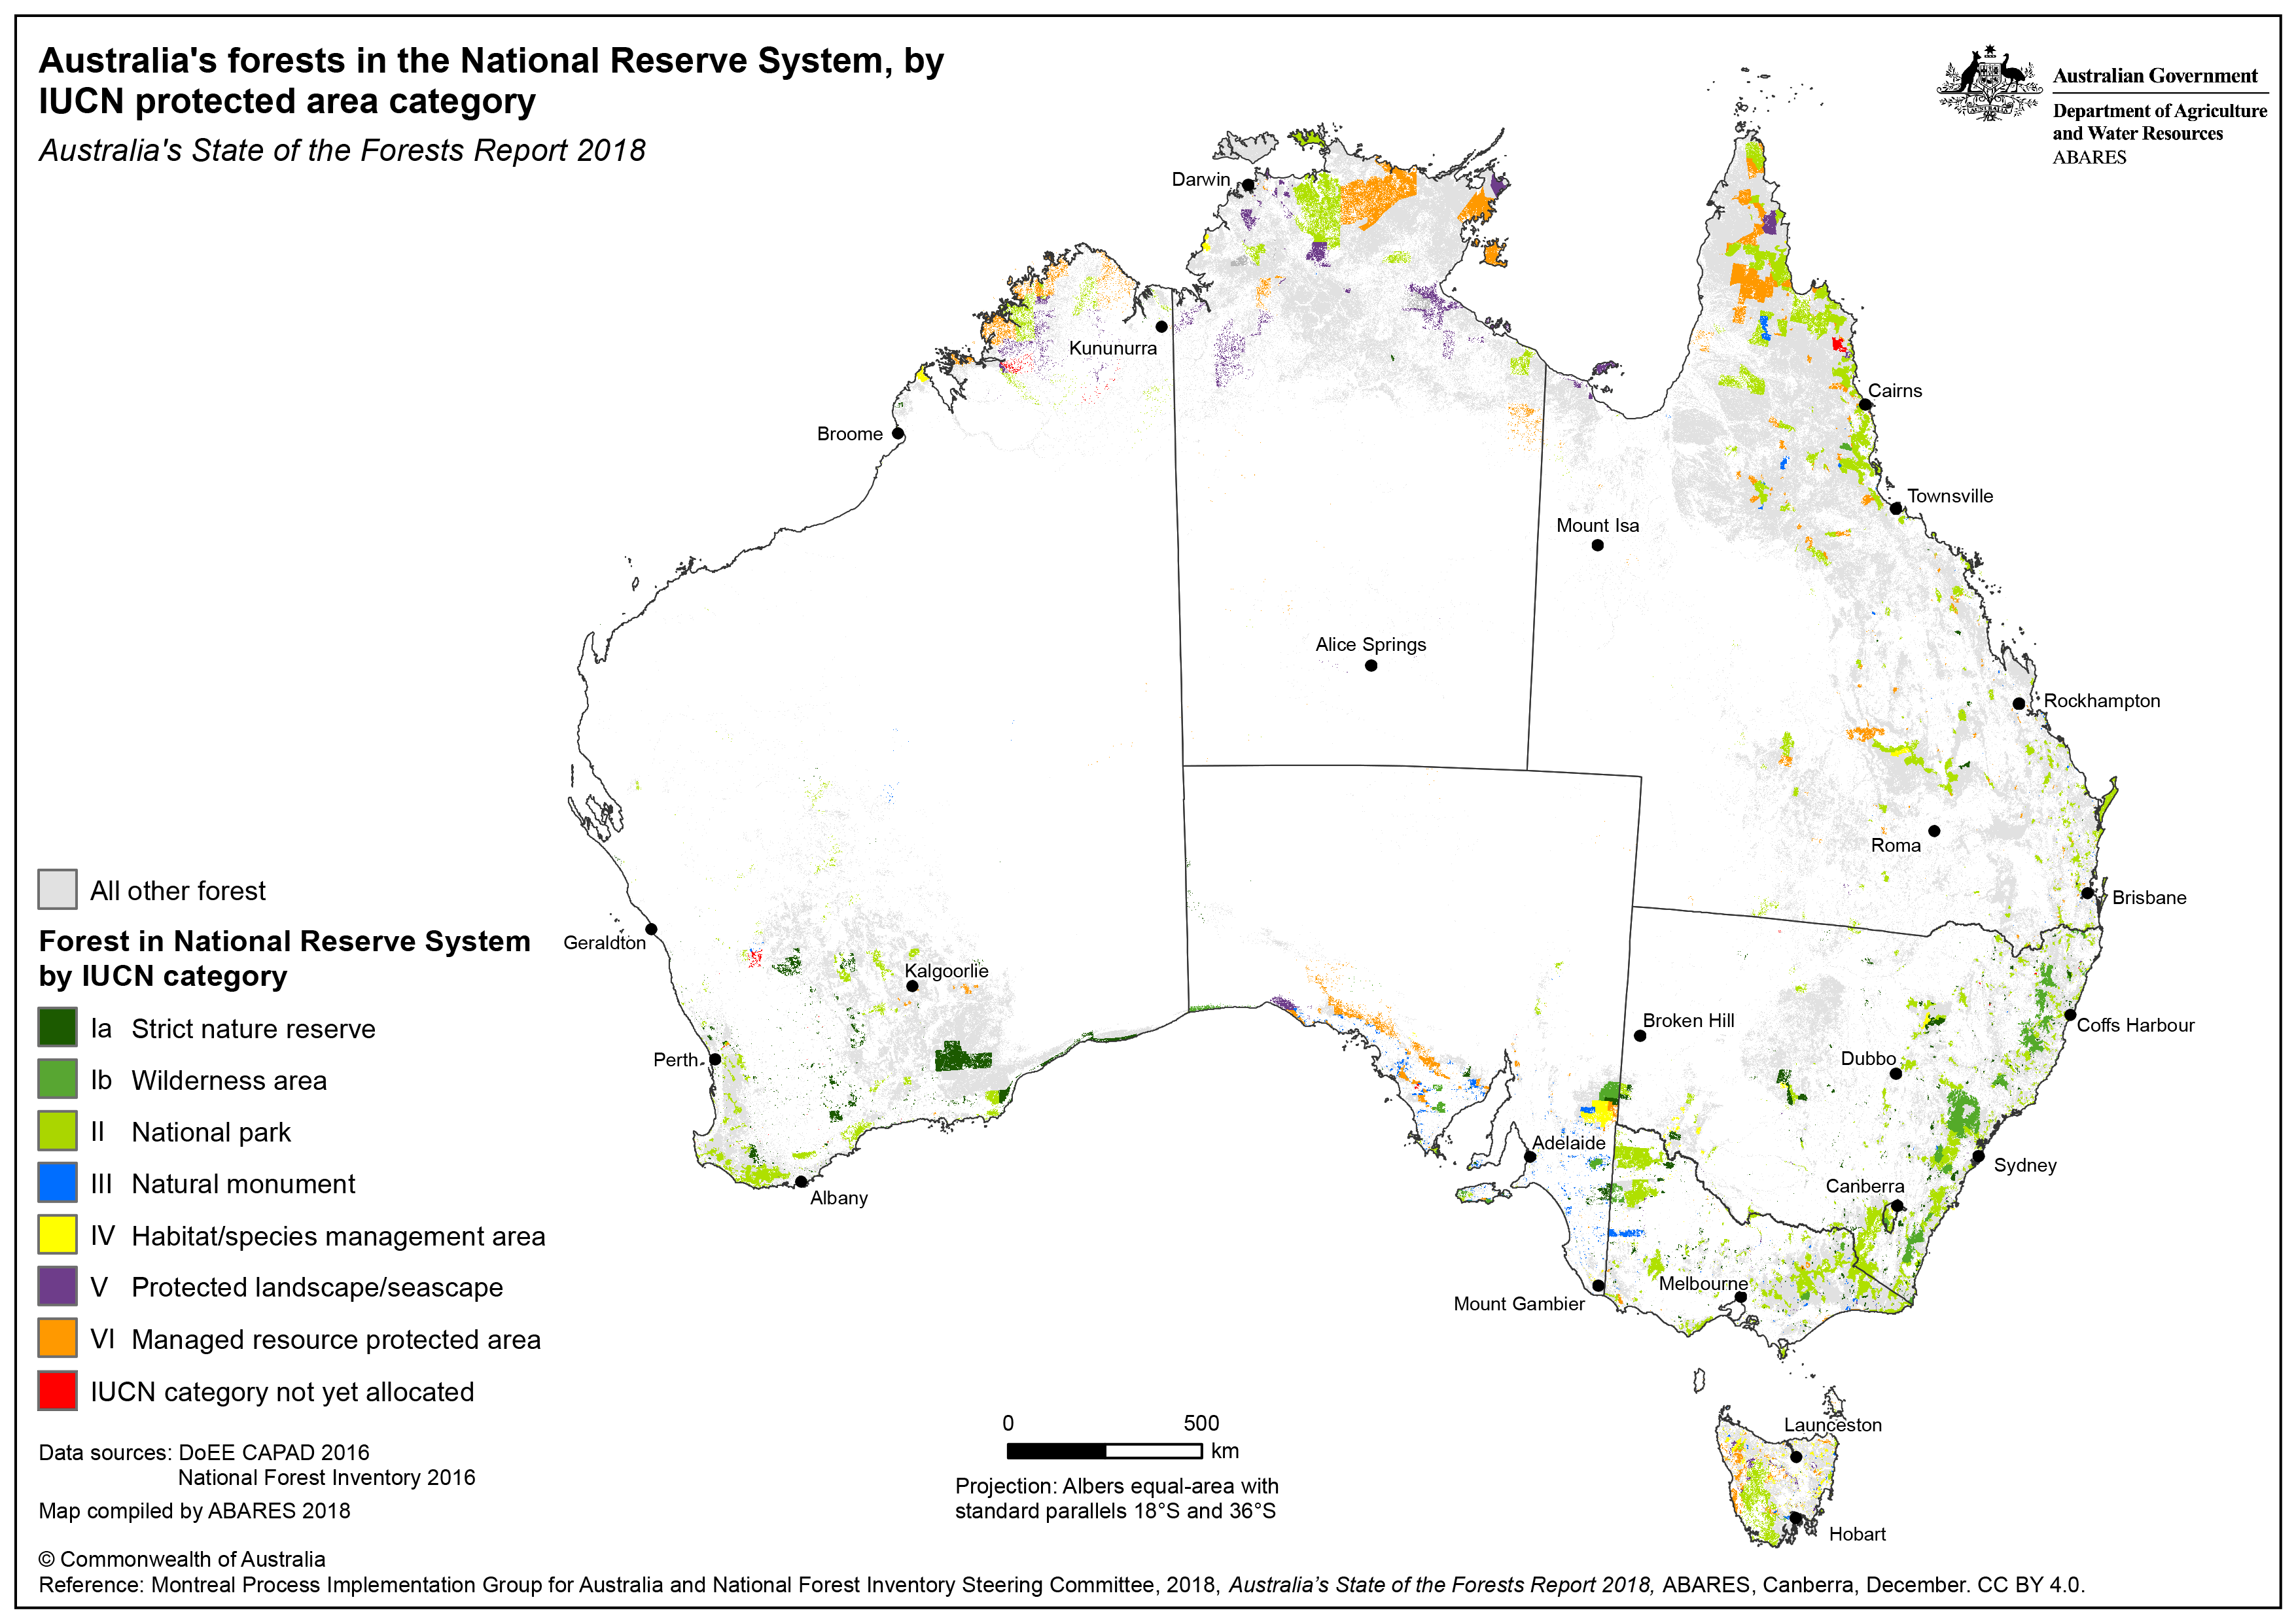
Australia's forests in the National Reserve System, by IUCN protected area category
This map shows Australia's forests in the National Reserve System, by International Union for Conservation of Nature (IUCN) protected area category: PNG [0.8 MB], PDF [2.5 MB].
The following selection of maps is from the Australian forest profiles 2019:

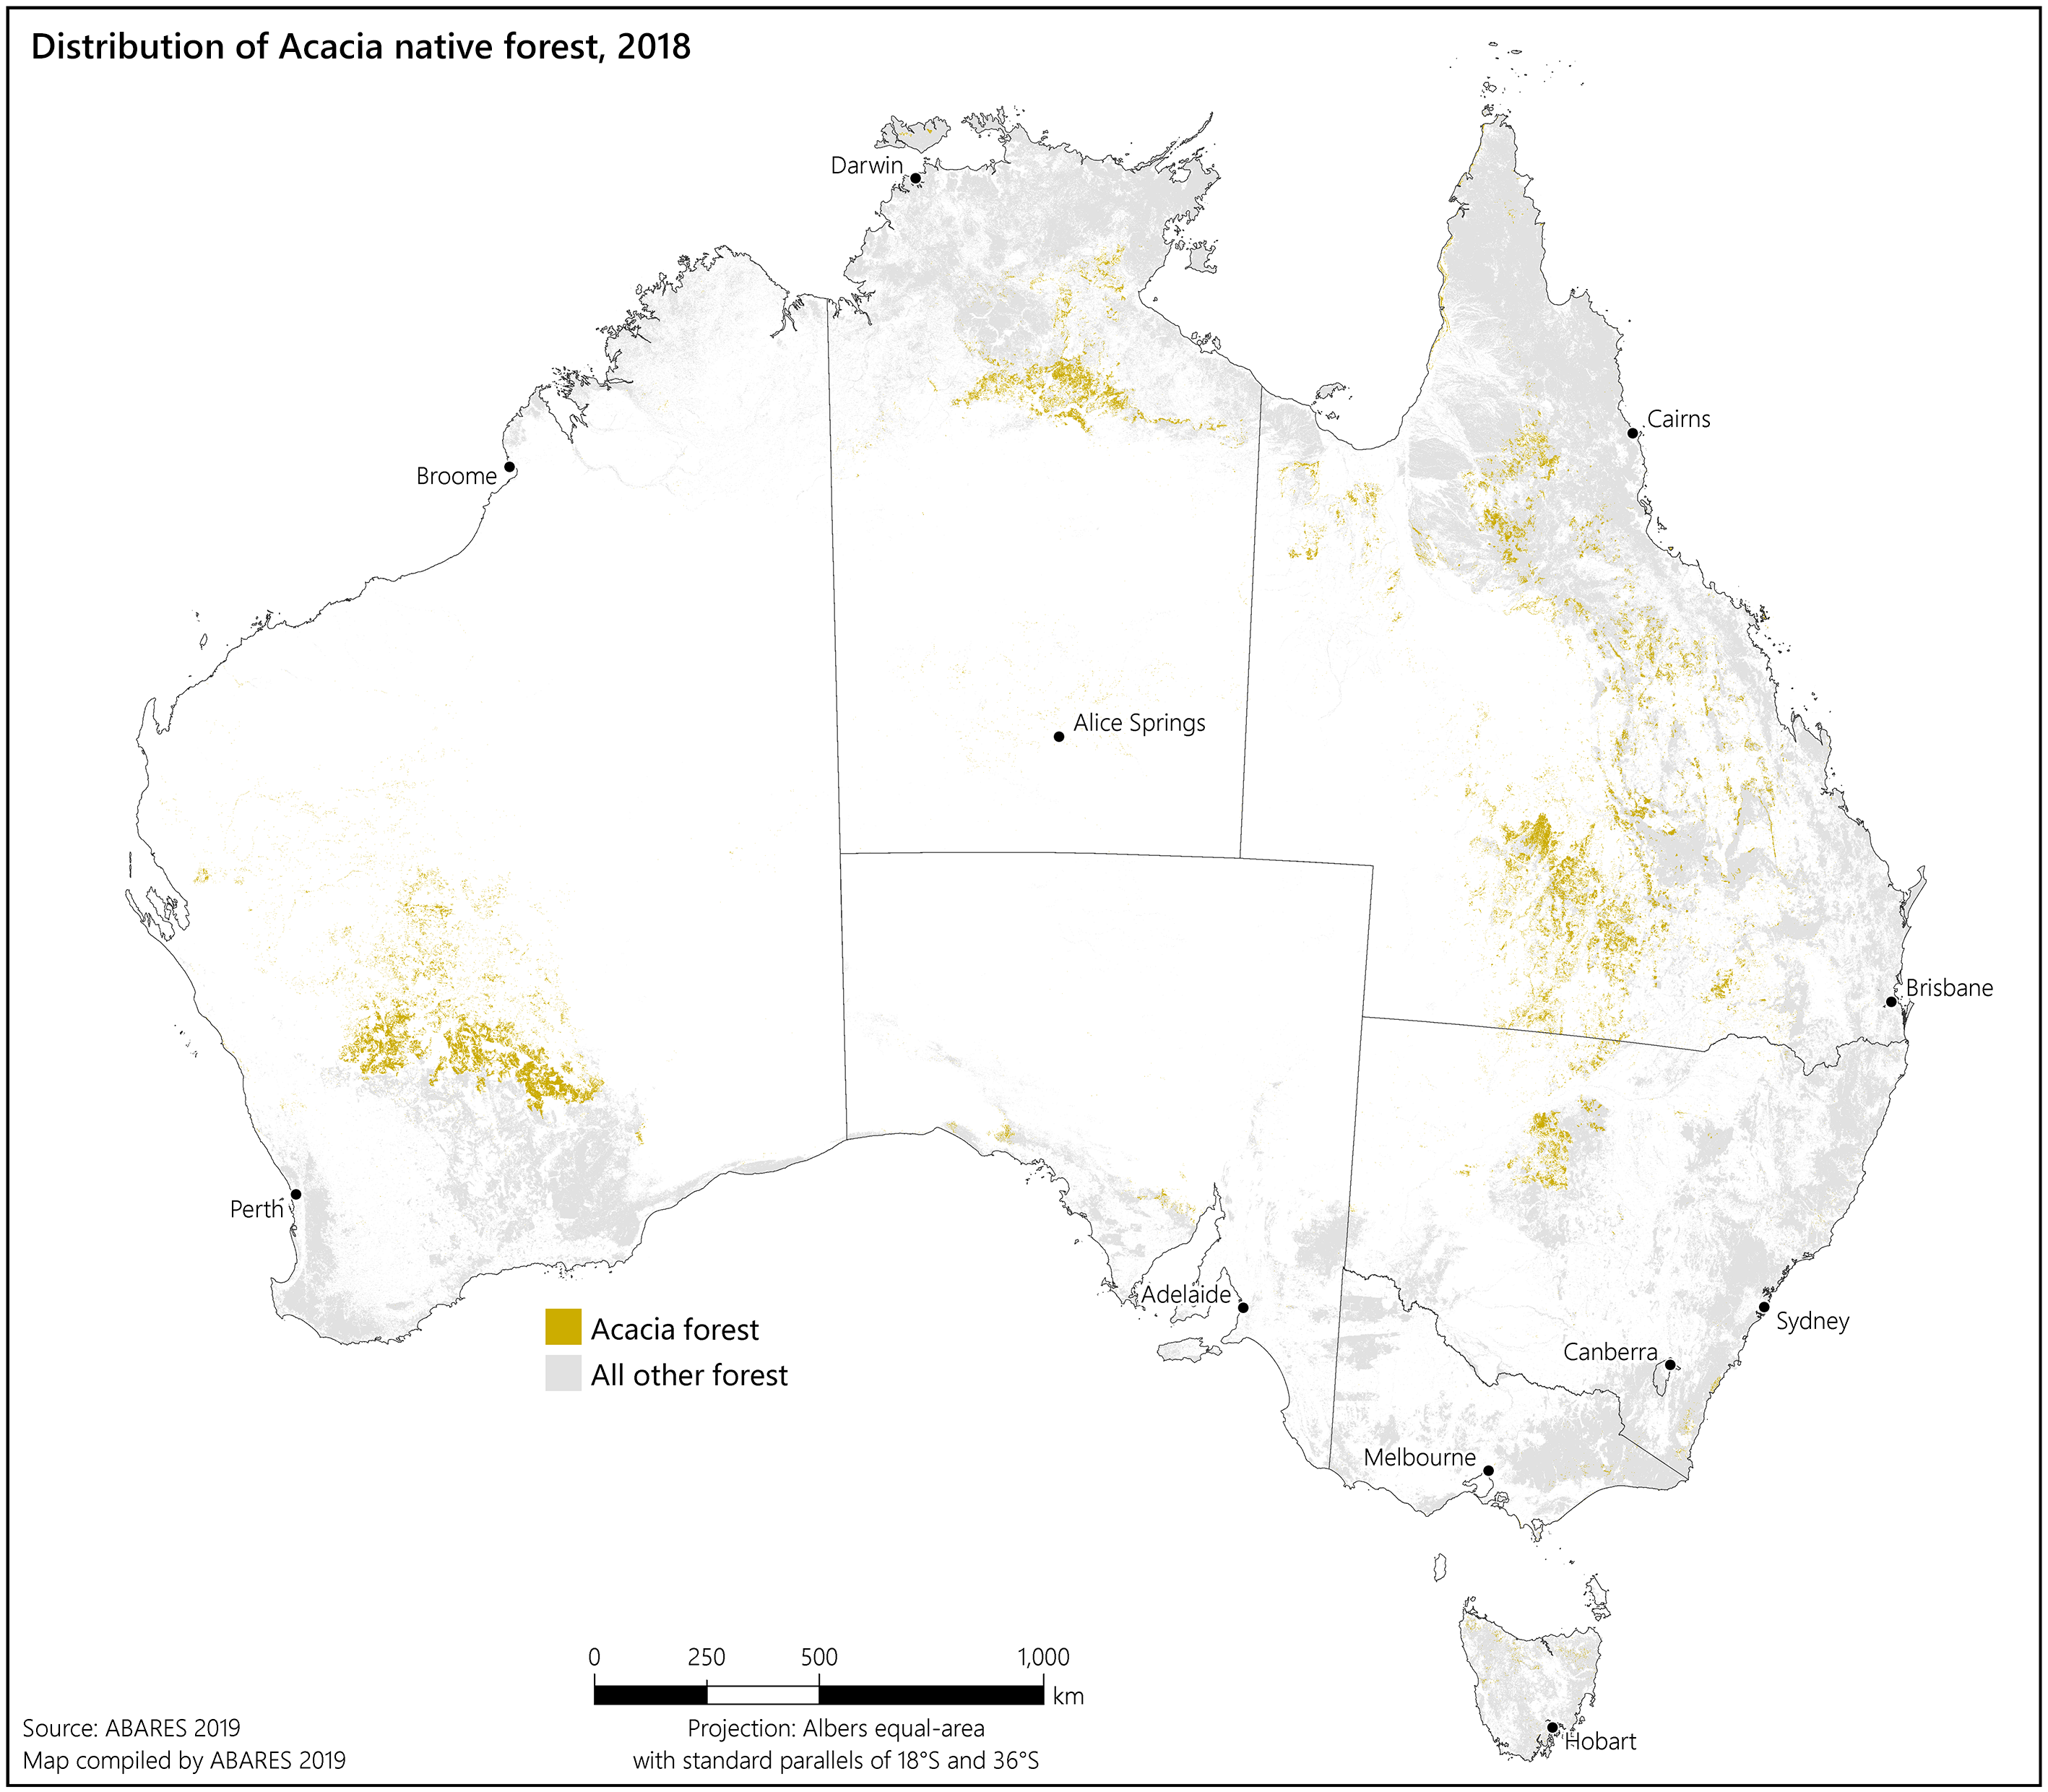
Acacia native forest distribution
This map shows the distribution of the Acacia native forest type across Australia: PNG [2.2 MB], PDF [0.5 MB].
Callitris native forest distribution
This map shows the distribution of the Callitris native forest type across Australia: PNG [1.9 MB], PDF [0.5 MB].
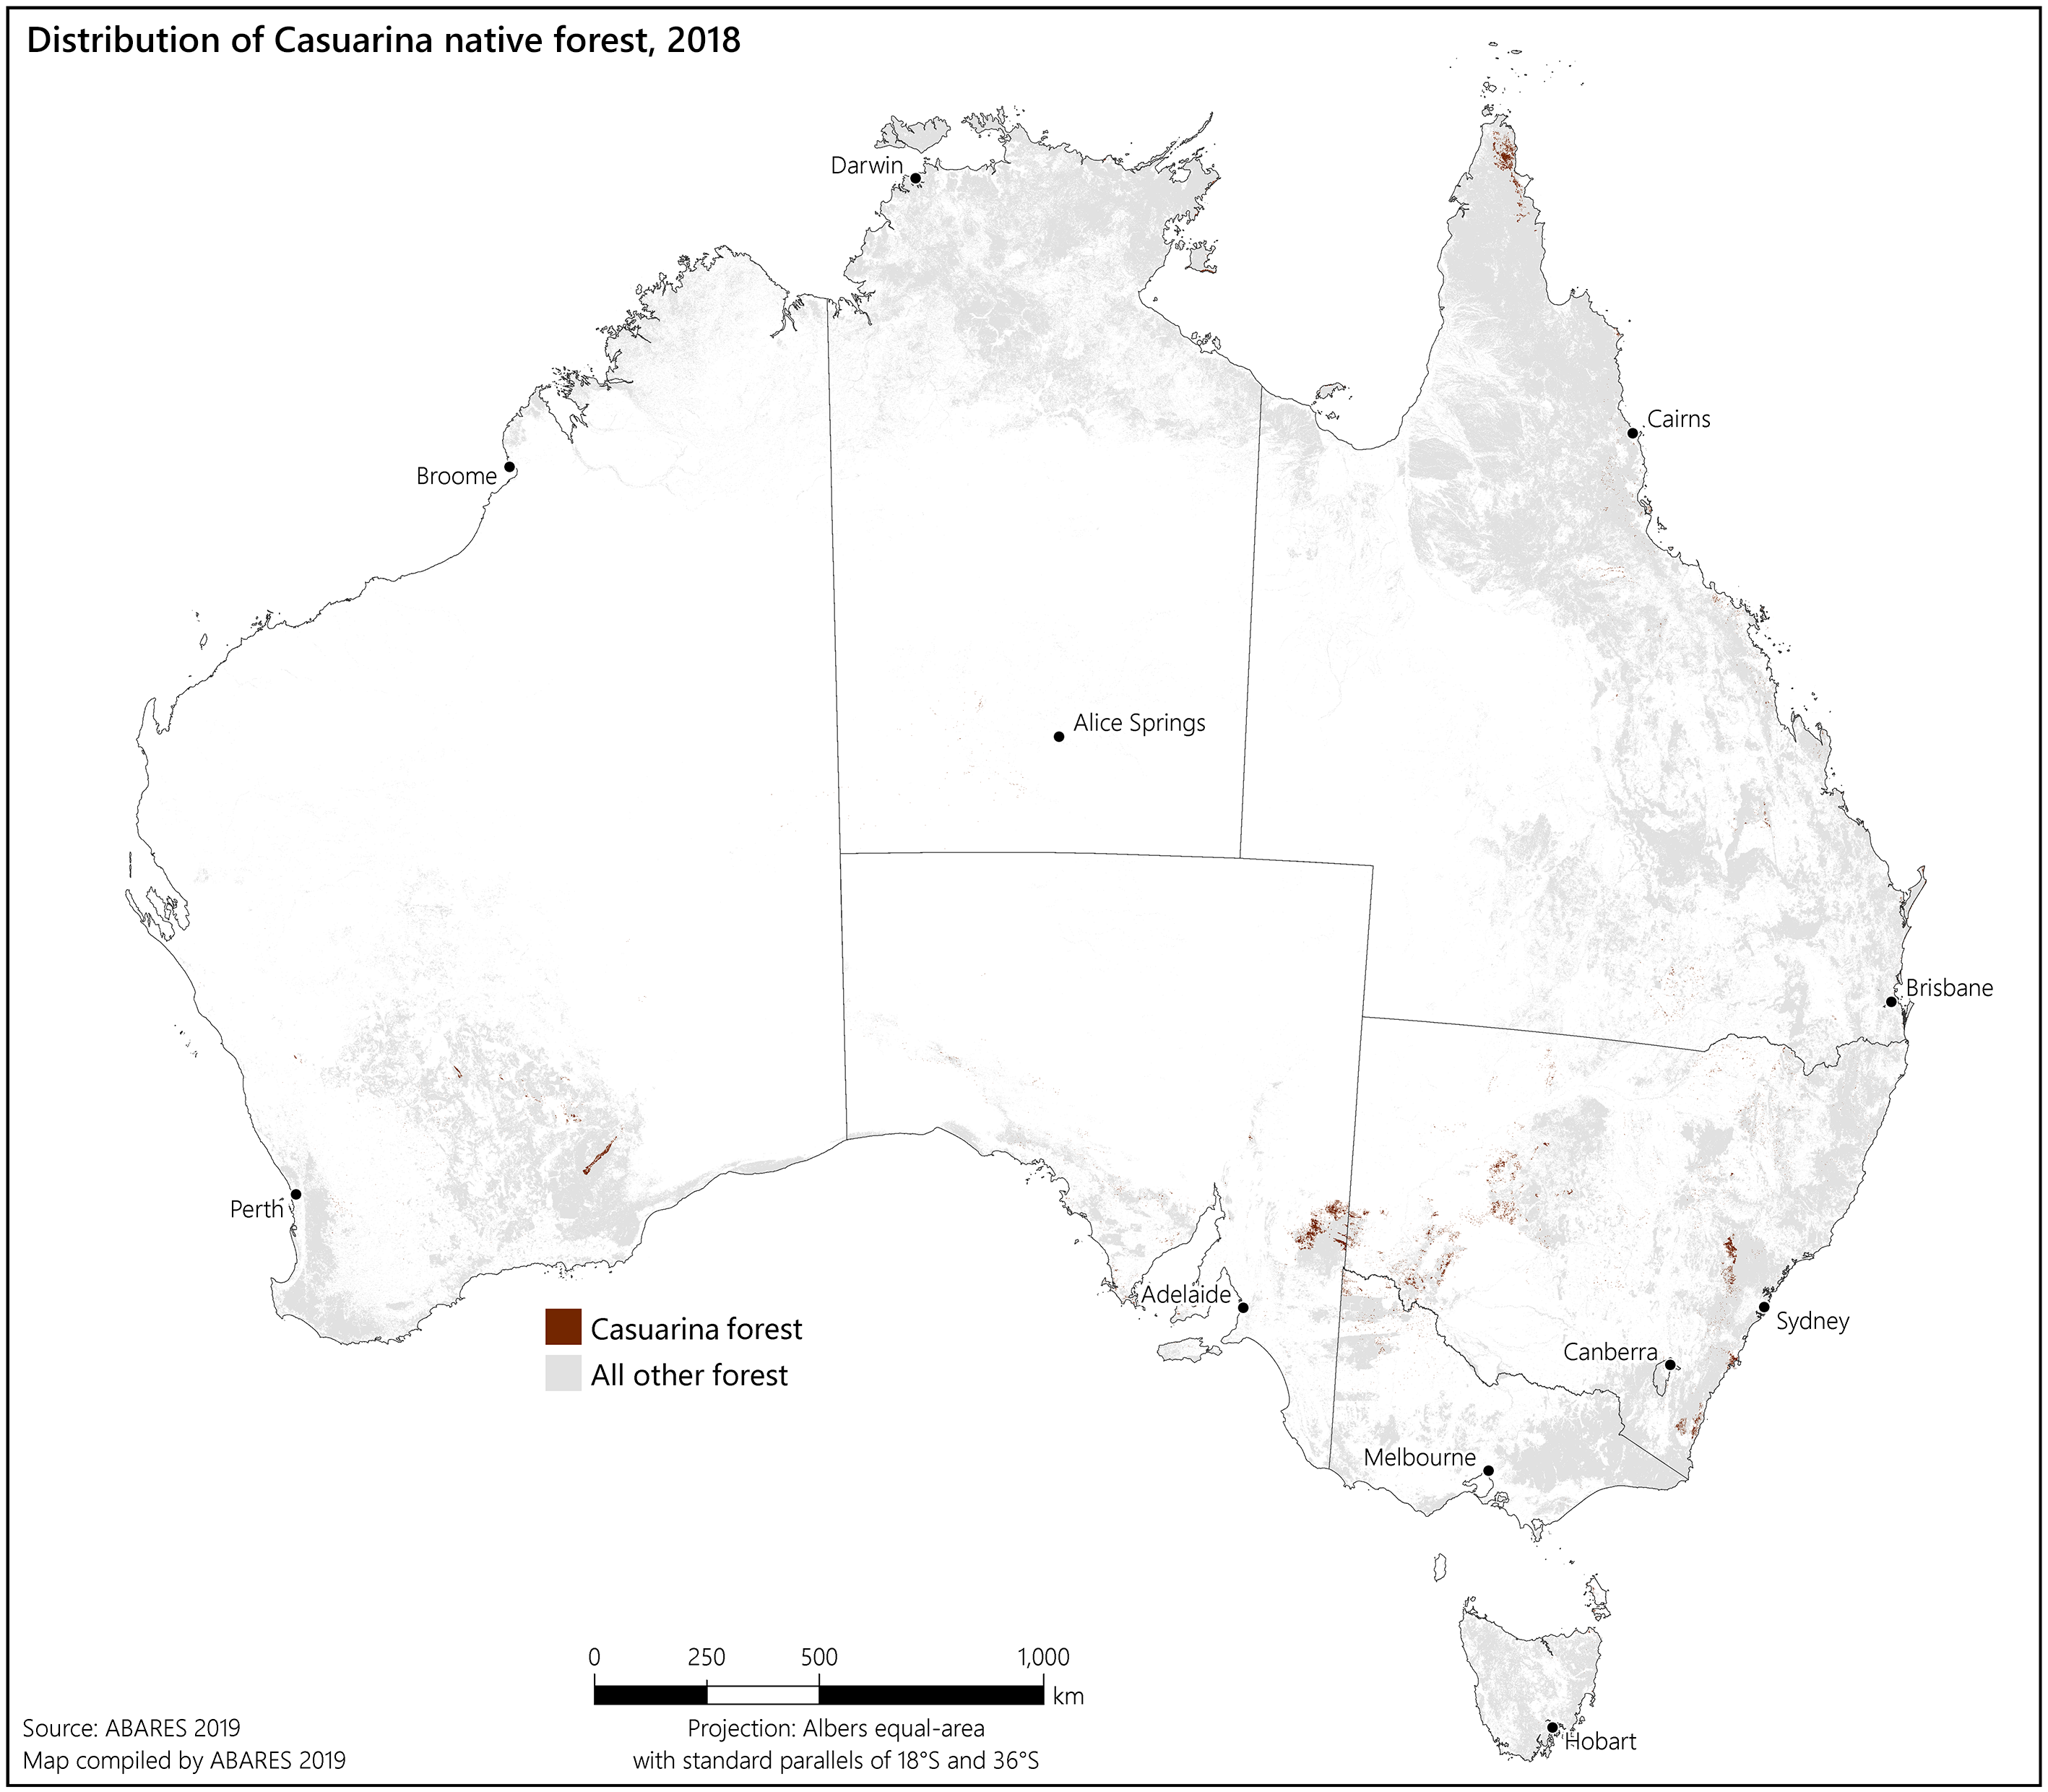
Casuarina native forest distribution
This map shows the distribution of the Casuarina native forest type across Australia: PNG [1.9 MB], PDF [0.5 MB].
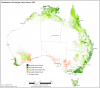
Eucalypt native forest distribution
This map shows the distribution of the Eucalypt native forest type across Australia: PNG [3.2 MB], PDF [0.7 MB].

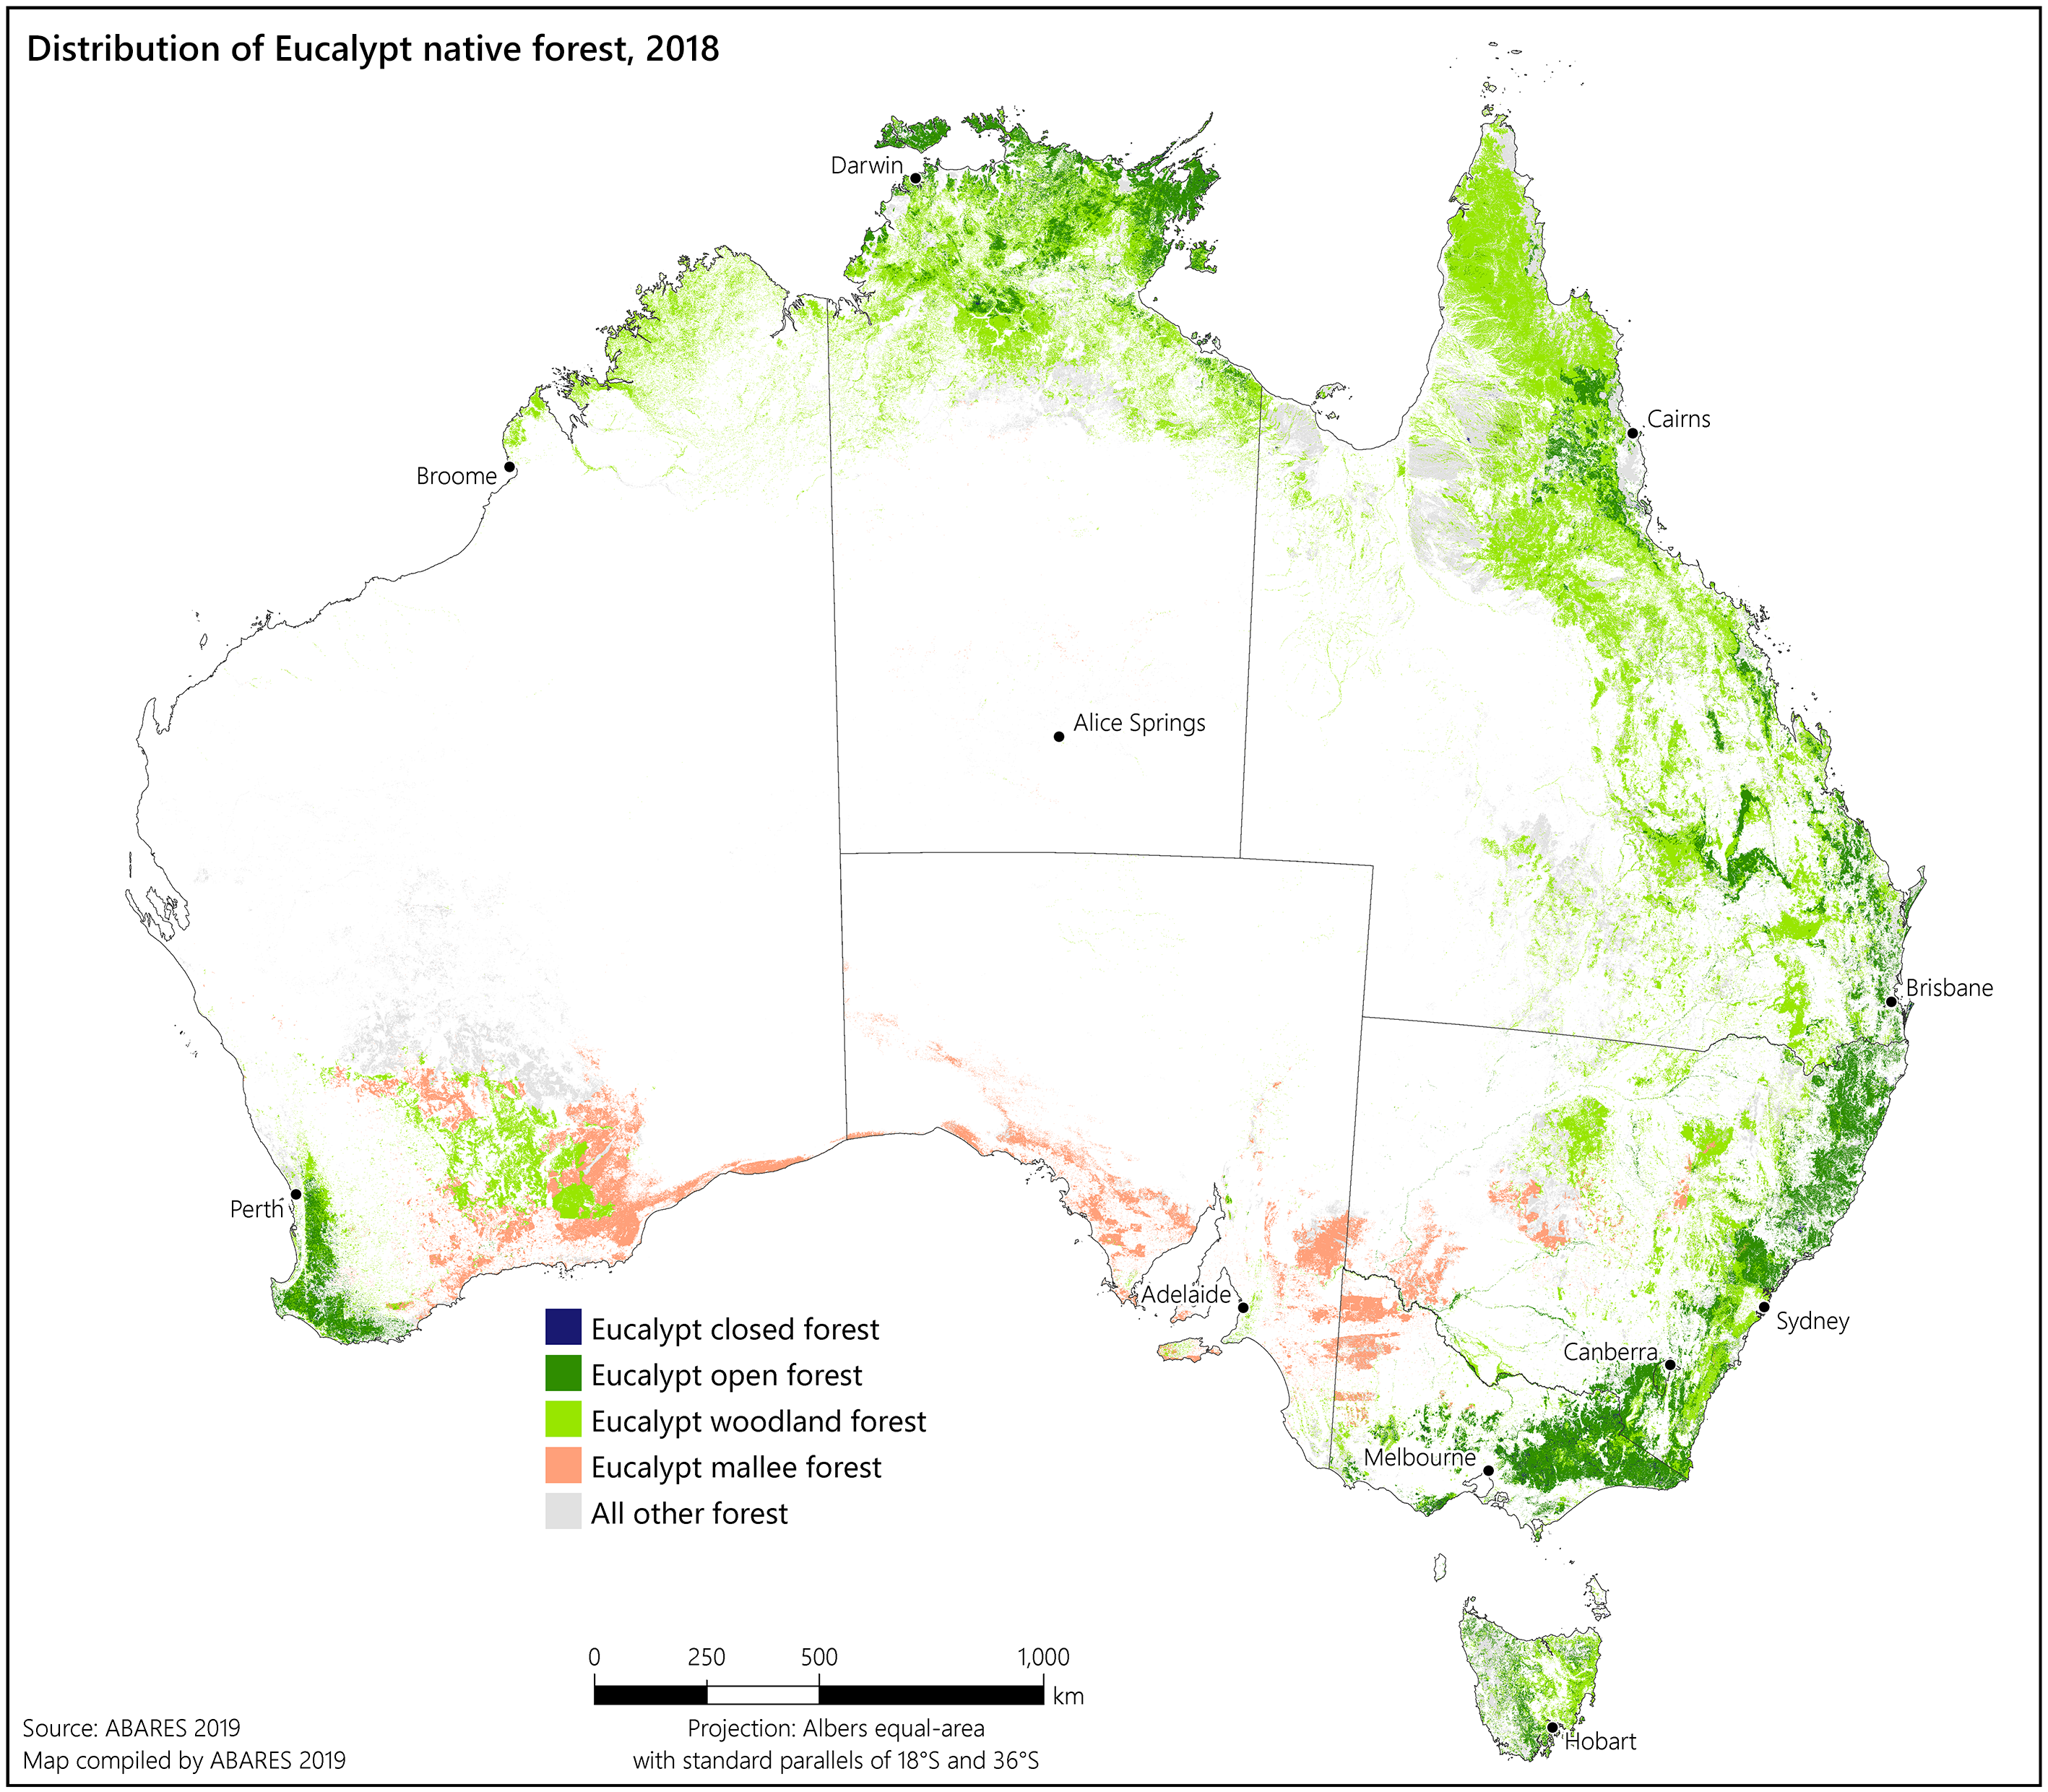
Mangrove native forest distribution
This map shows the distribution of the Mangrove native forest type across Australia: PNG [1.8 MB], PDF [0.5 MB].

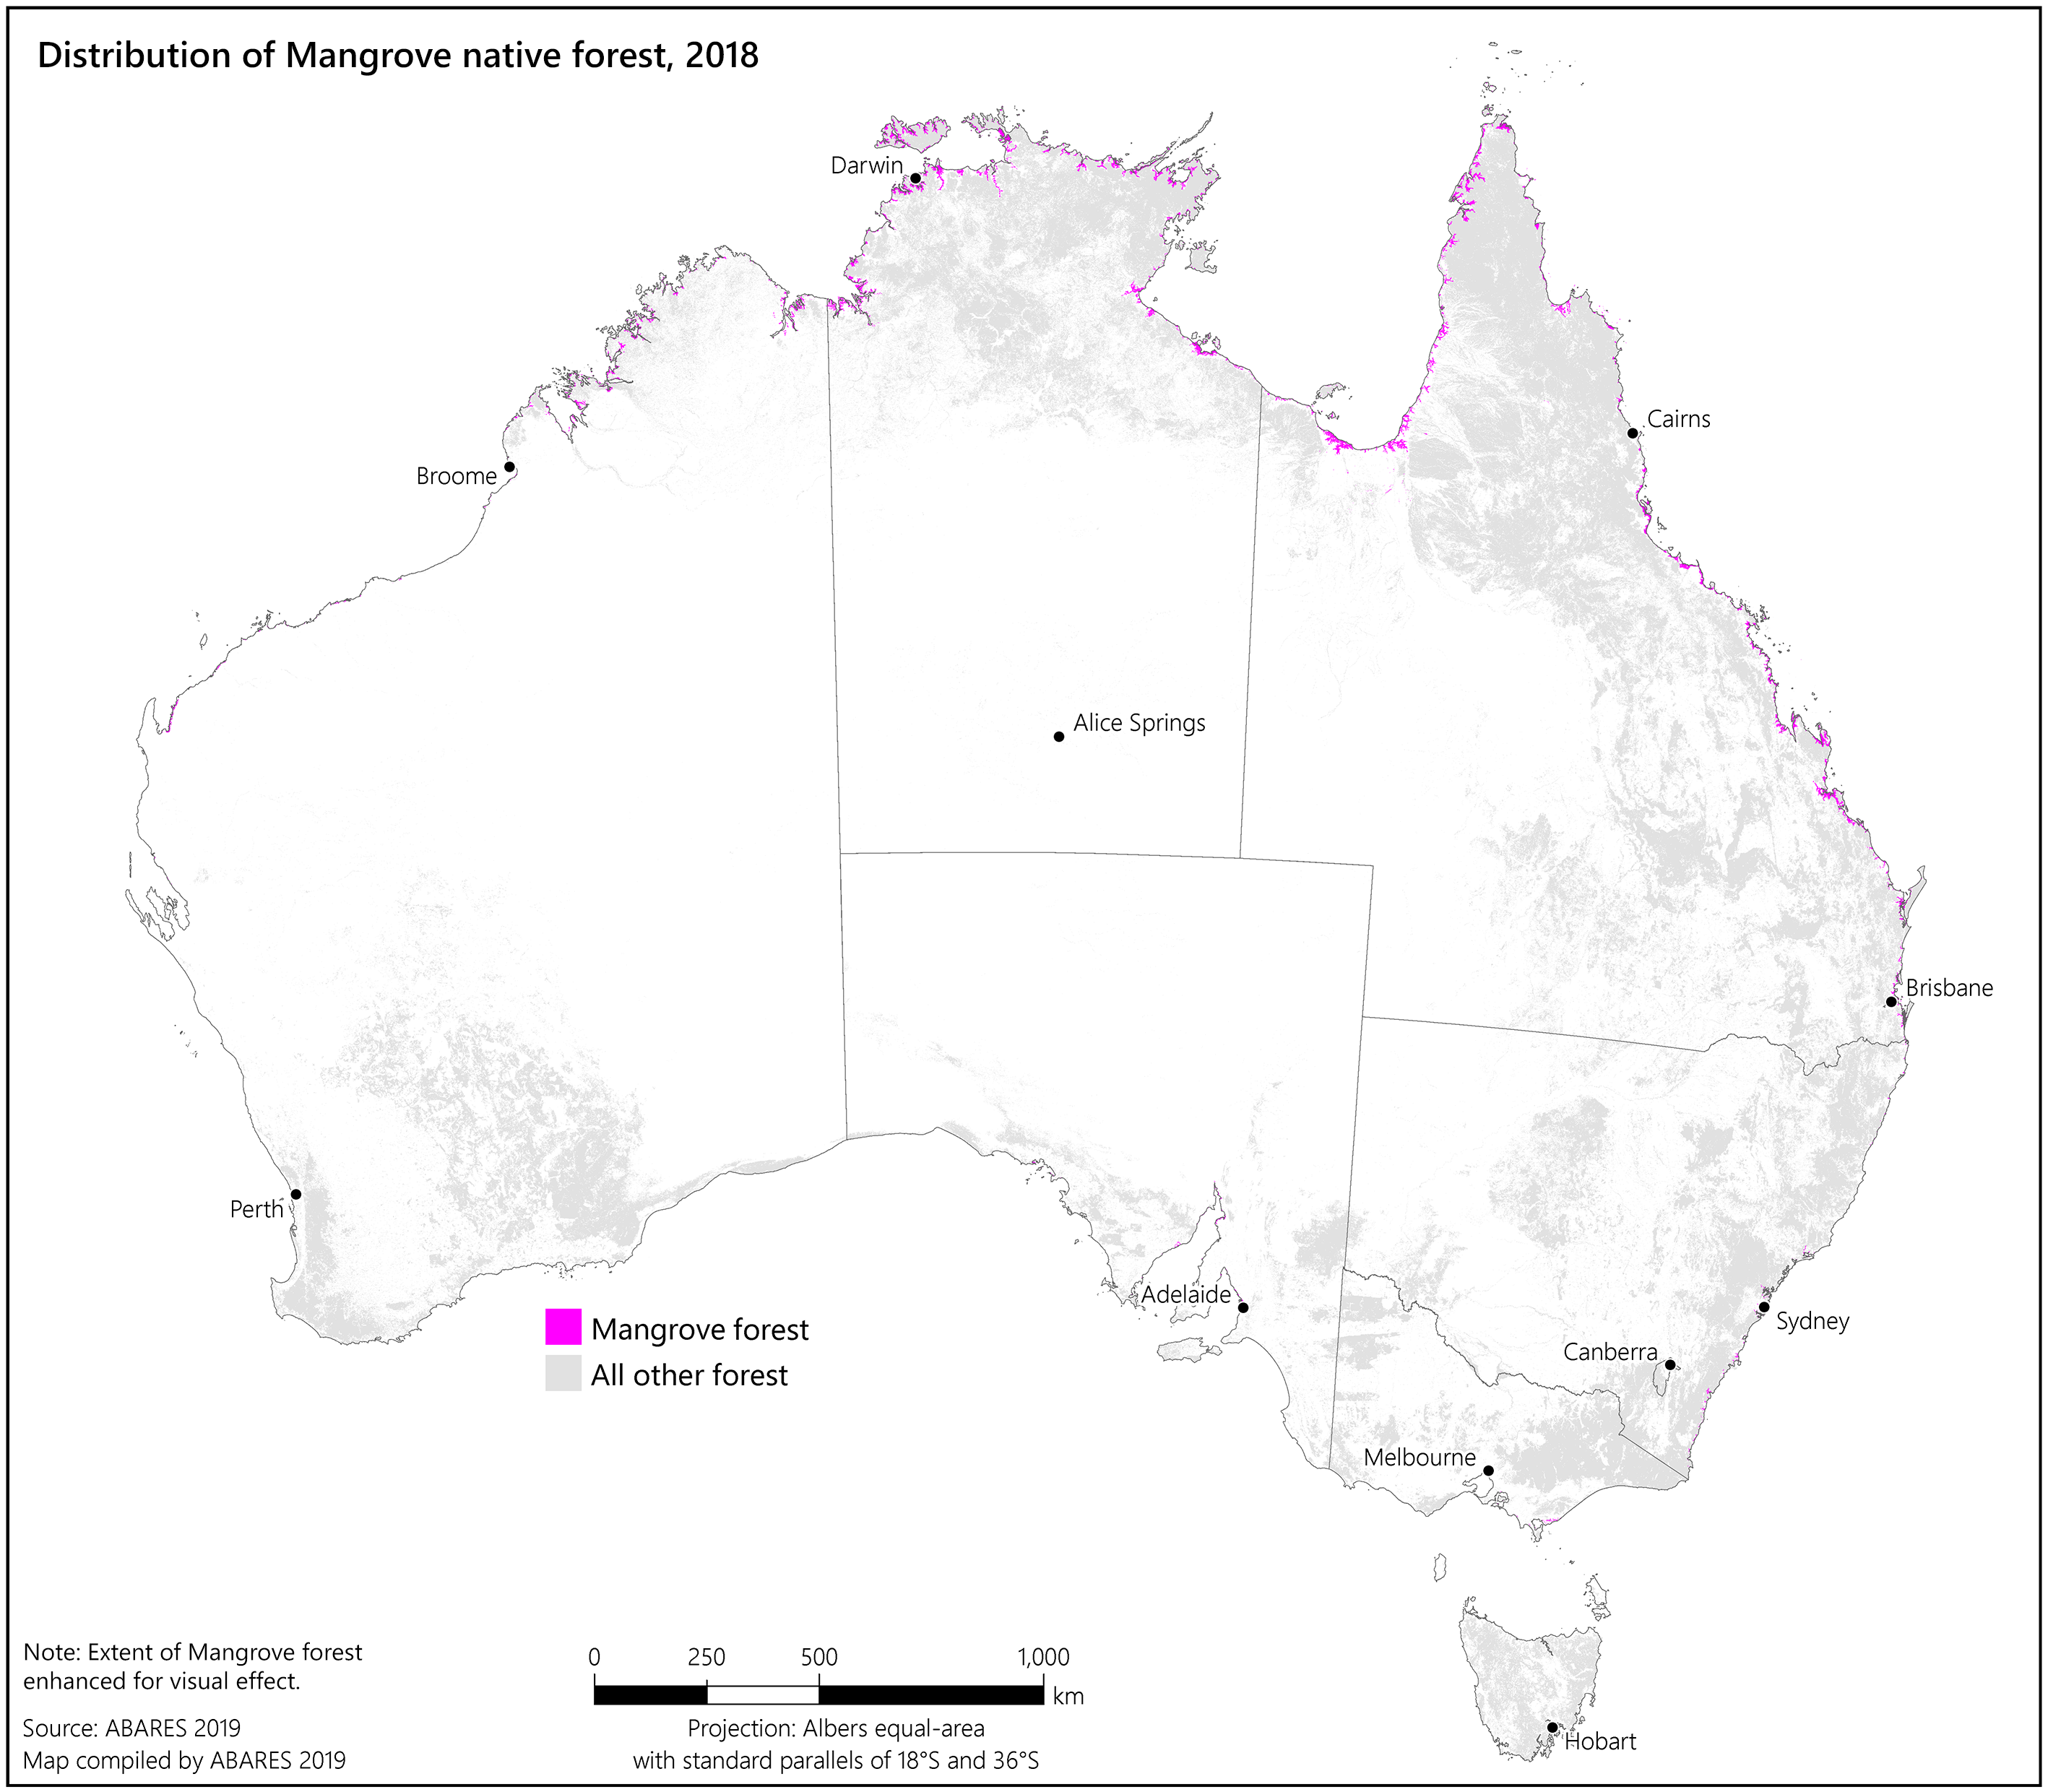
Melaleuca native forest distribution
This map shows the distribution of the Melaleuca native forest type across Australia: PNG [2.0 MB], PDF [0.5 MB].
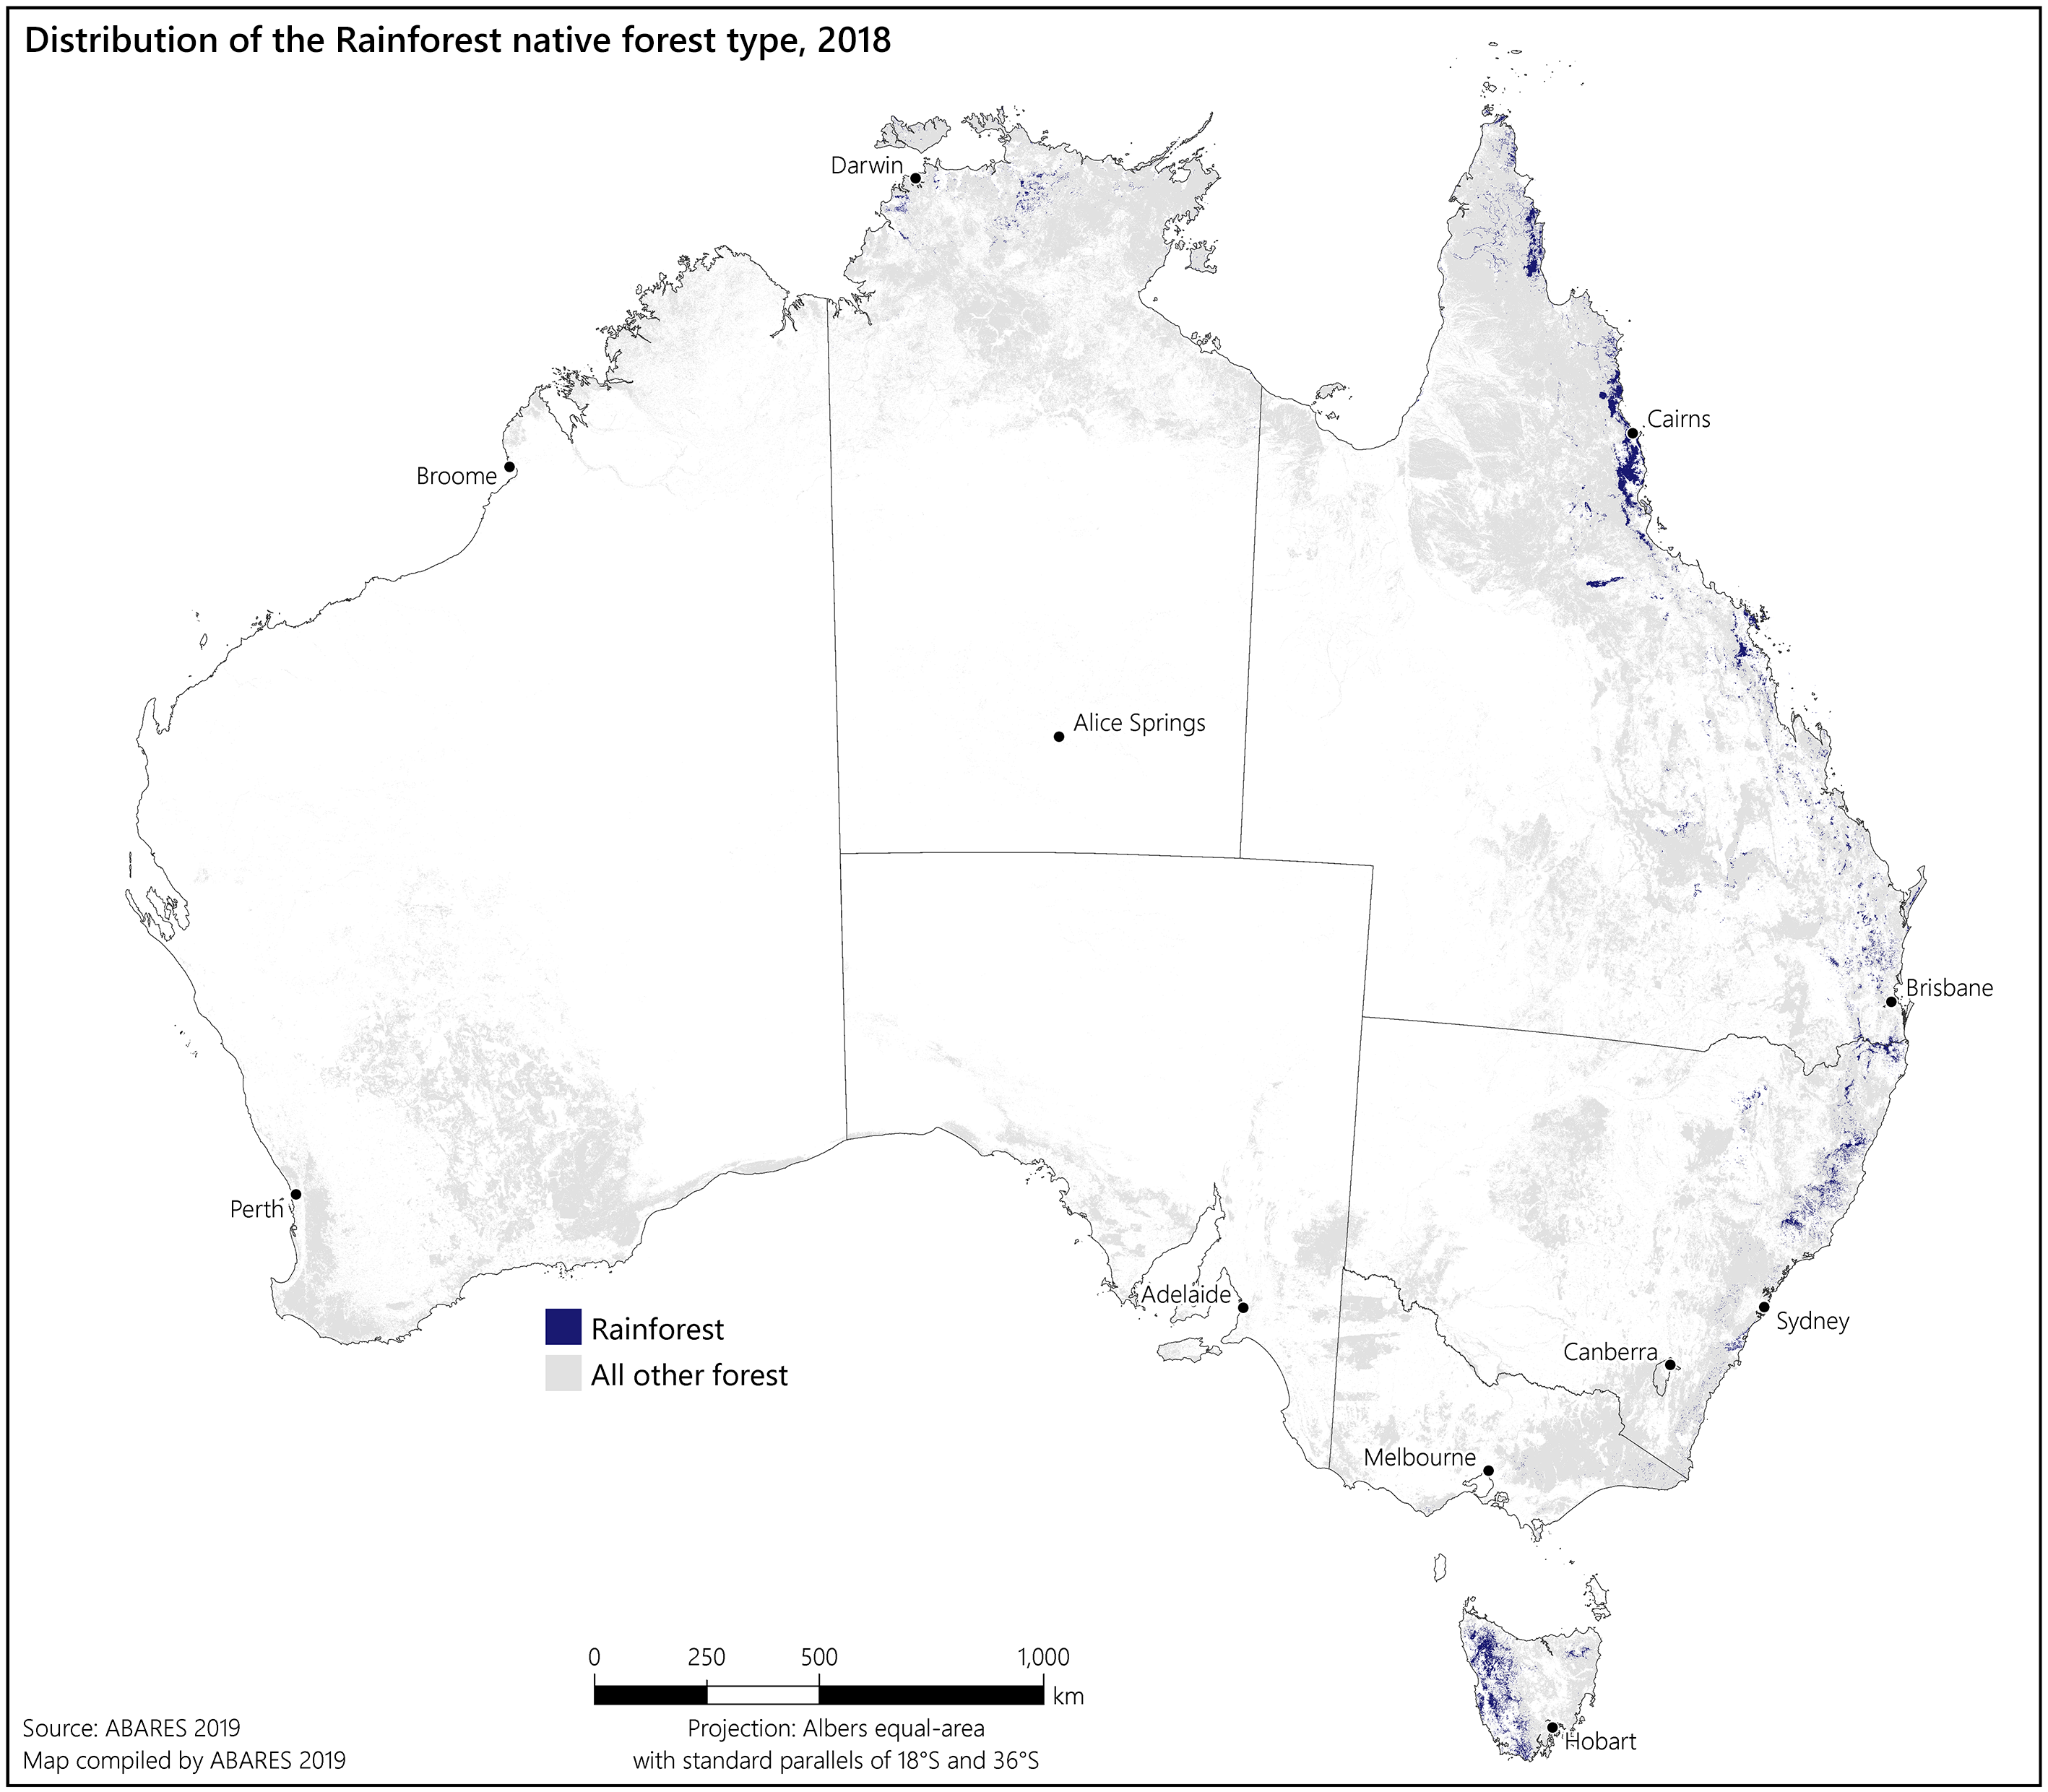
Rainforest native forest distribution
This map shows the distribution of the Rainforest native forest type across Australia: PNG [2.0 MB], PDF [0.5 MB].
Forest burnt in Australia, by number of fires, 2011–12 to 2015–16
This map shows the distribution of burnt forest in Australia, by the number of times each hectare was burnt in the period 2011–12 to 2015–16: PNG [1.0 MB], PDF [2.1MB]. View an interactive version of this map in ArcGIS Online map viewer.
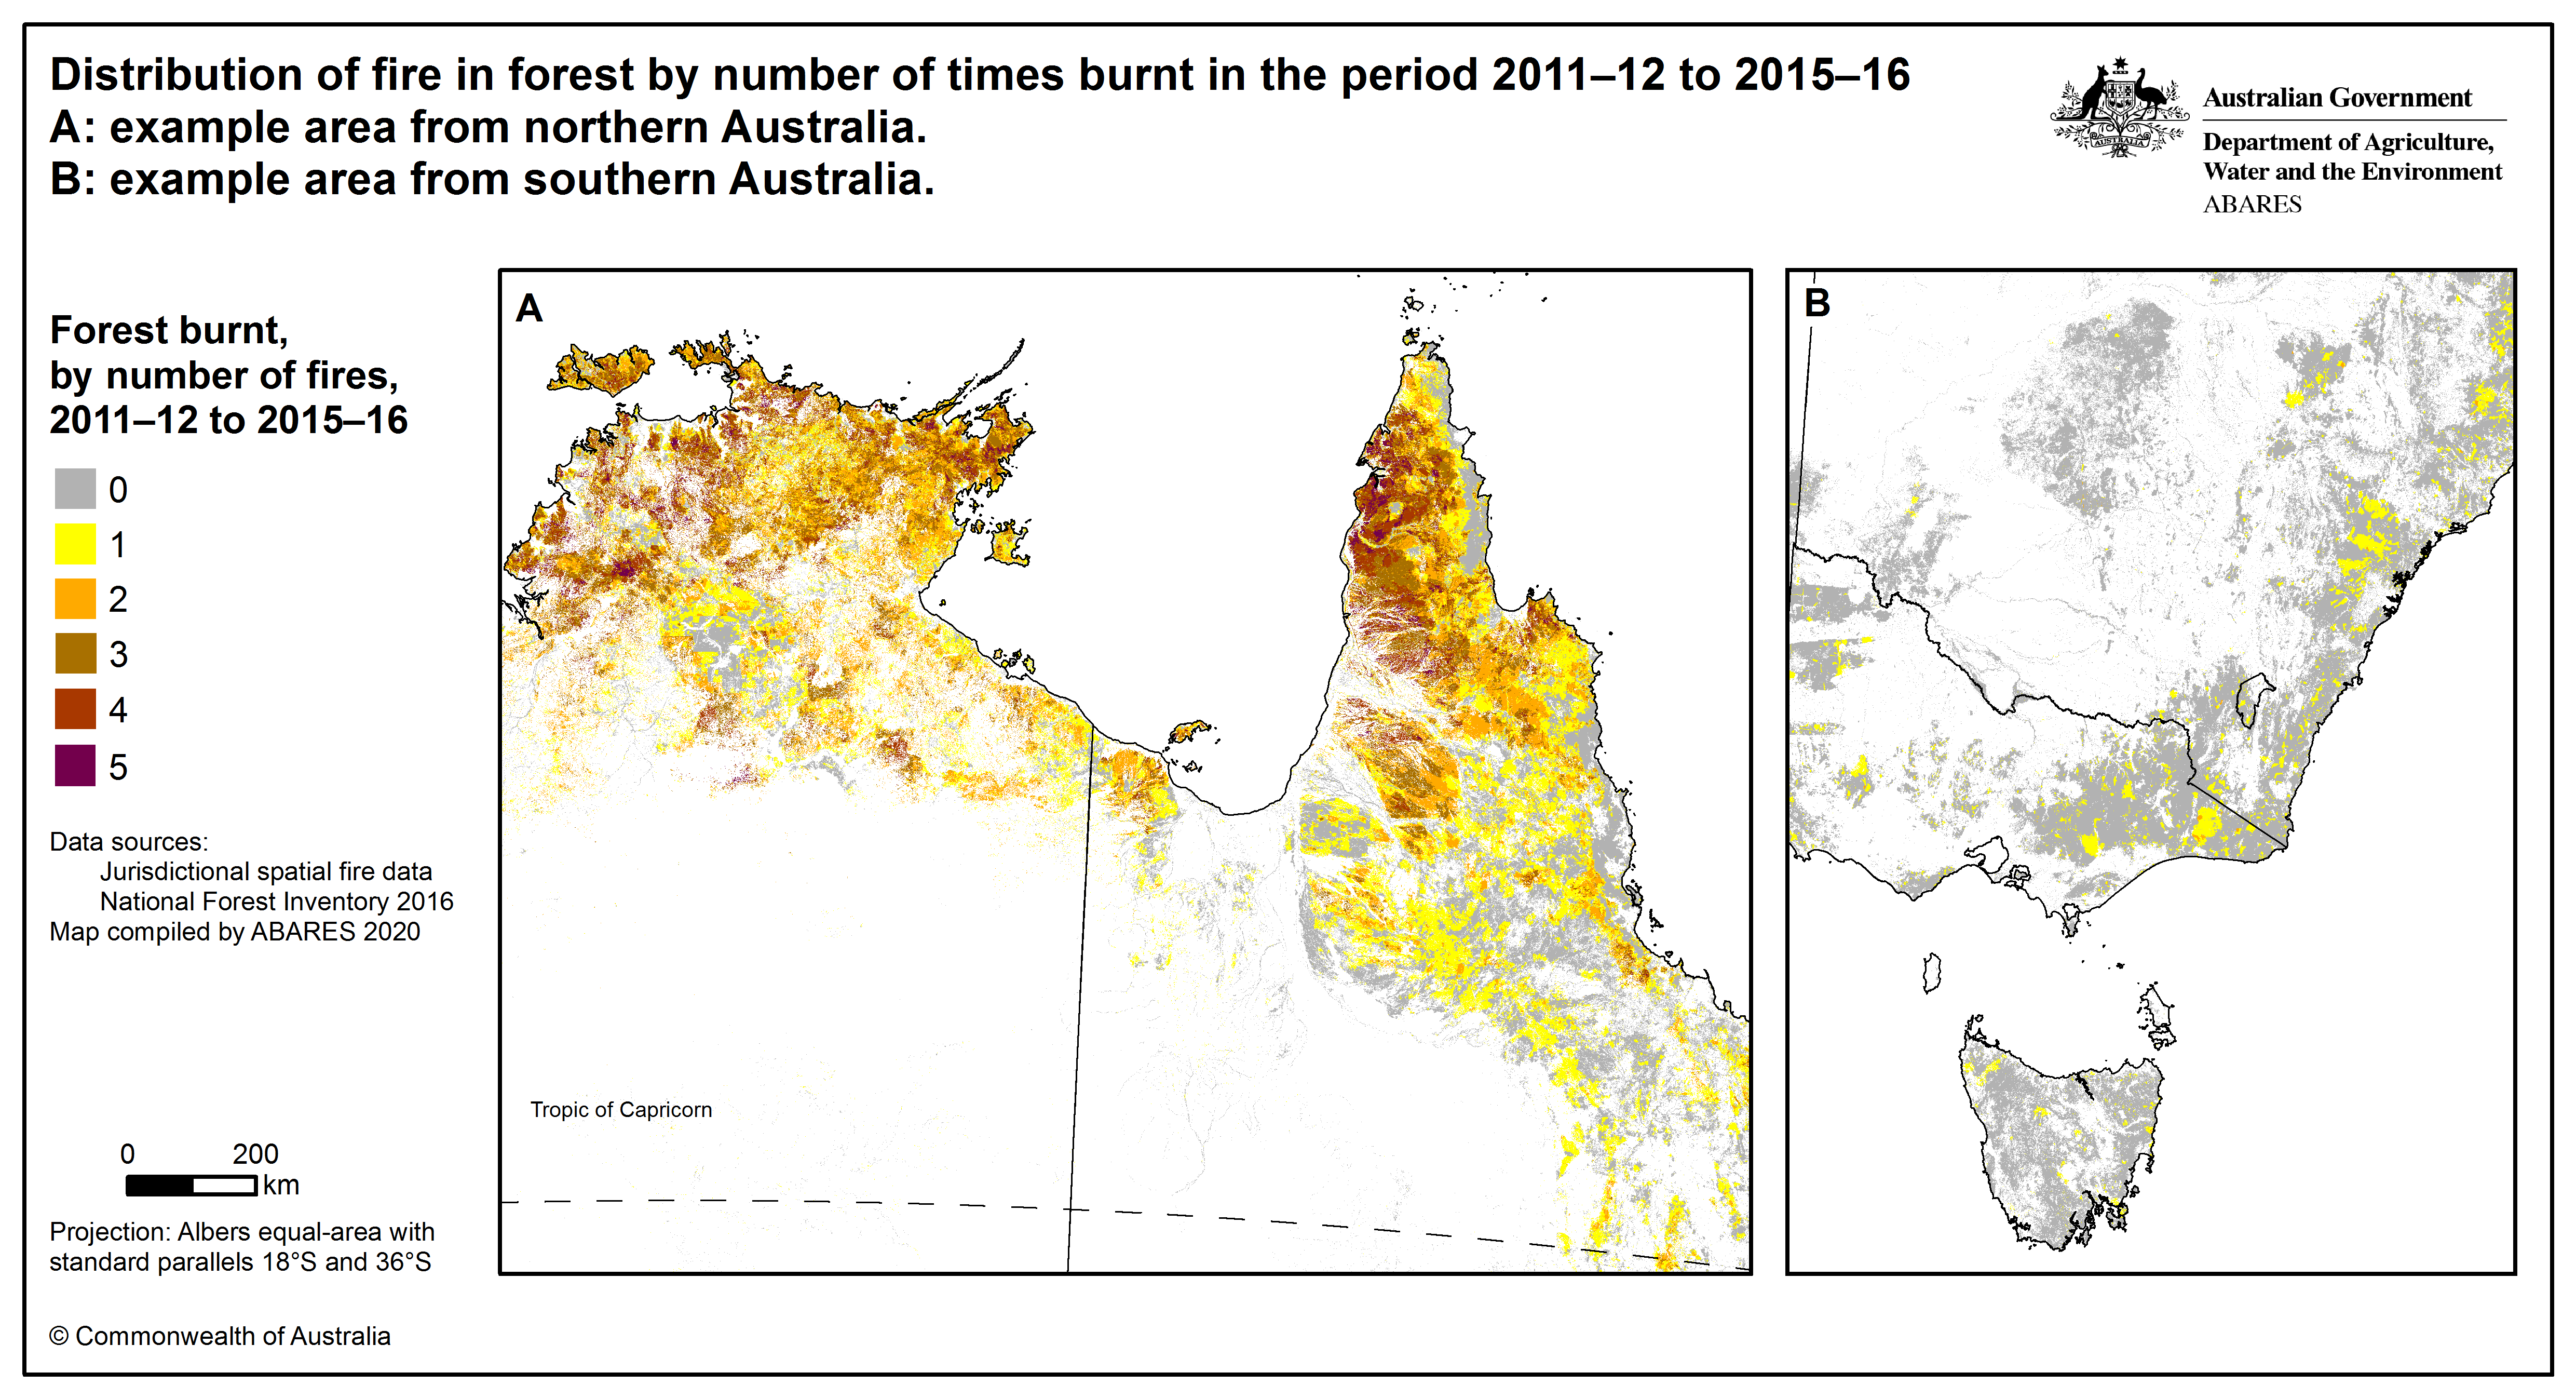
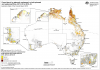
Distribution of fire in forest by number of times burnt in the period 2011–12 to 2015–16
This map shows the distribution of burnt forest in areas of northern and southern Australia, by the number of times each hectare was burnt in the period 2011–12 to 2015–16: PNG [1.3 MB], PDF [1.3MB].
Forest burnt, by planned or unplanned fire, 2011–12 to 2015–16
This map shows the distribution of burnt forest in Australia, by planned, unplanned, or both planned and unplanned fire in the period 2011–12 to 2015–16: PNG [1.1 MB], PDF [2.4 MB]. View an interactive version of this map in ArcGIS Online map viewer.
The following map was prepared and published by ABARES:
Australia's forestry industry 2017
This map provides a detailed snapshot of the forestry industry, including the location of major wood processing facilities, native forest tenure, hardwood and softwood plantations, as well as roads and forestry ports: PDF [12.1 MB] and higher resolution version PDF [36.6 MB].
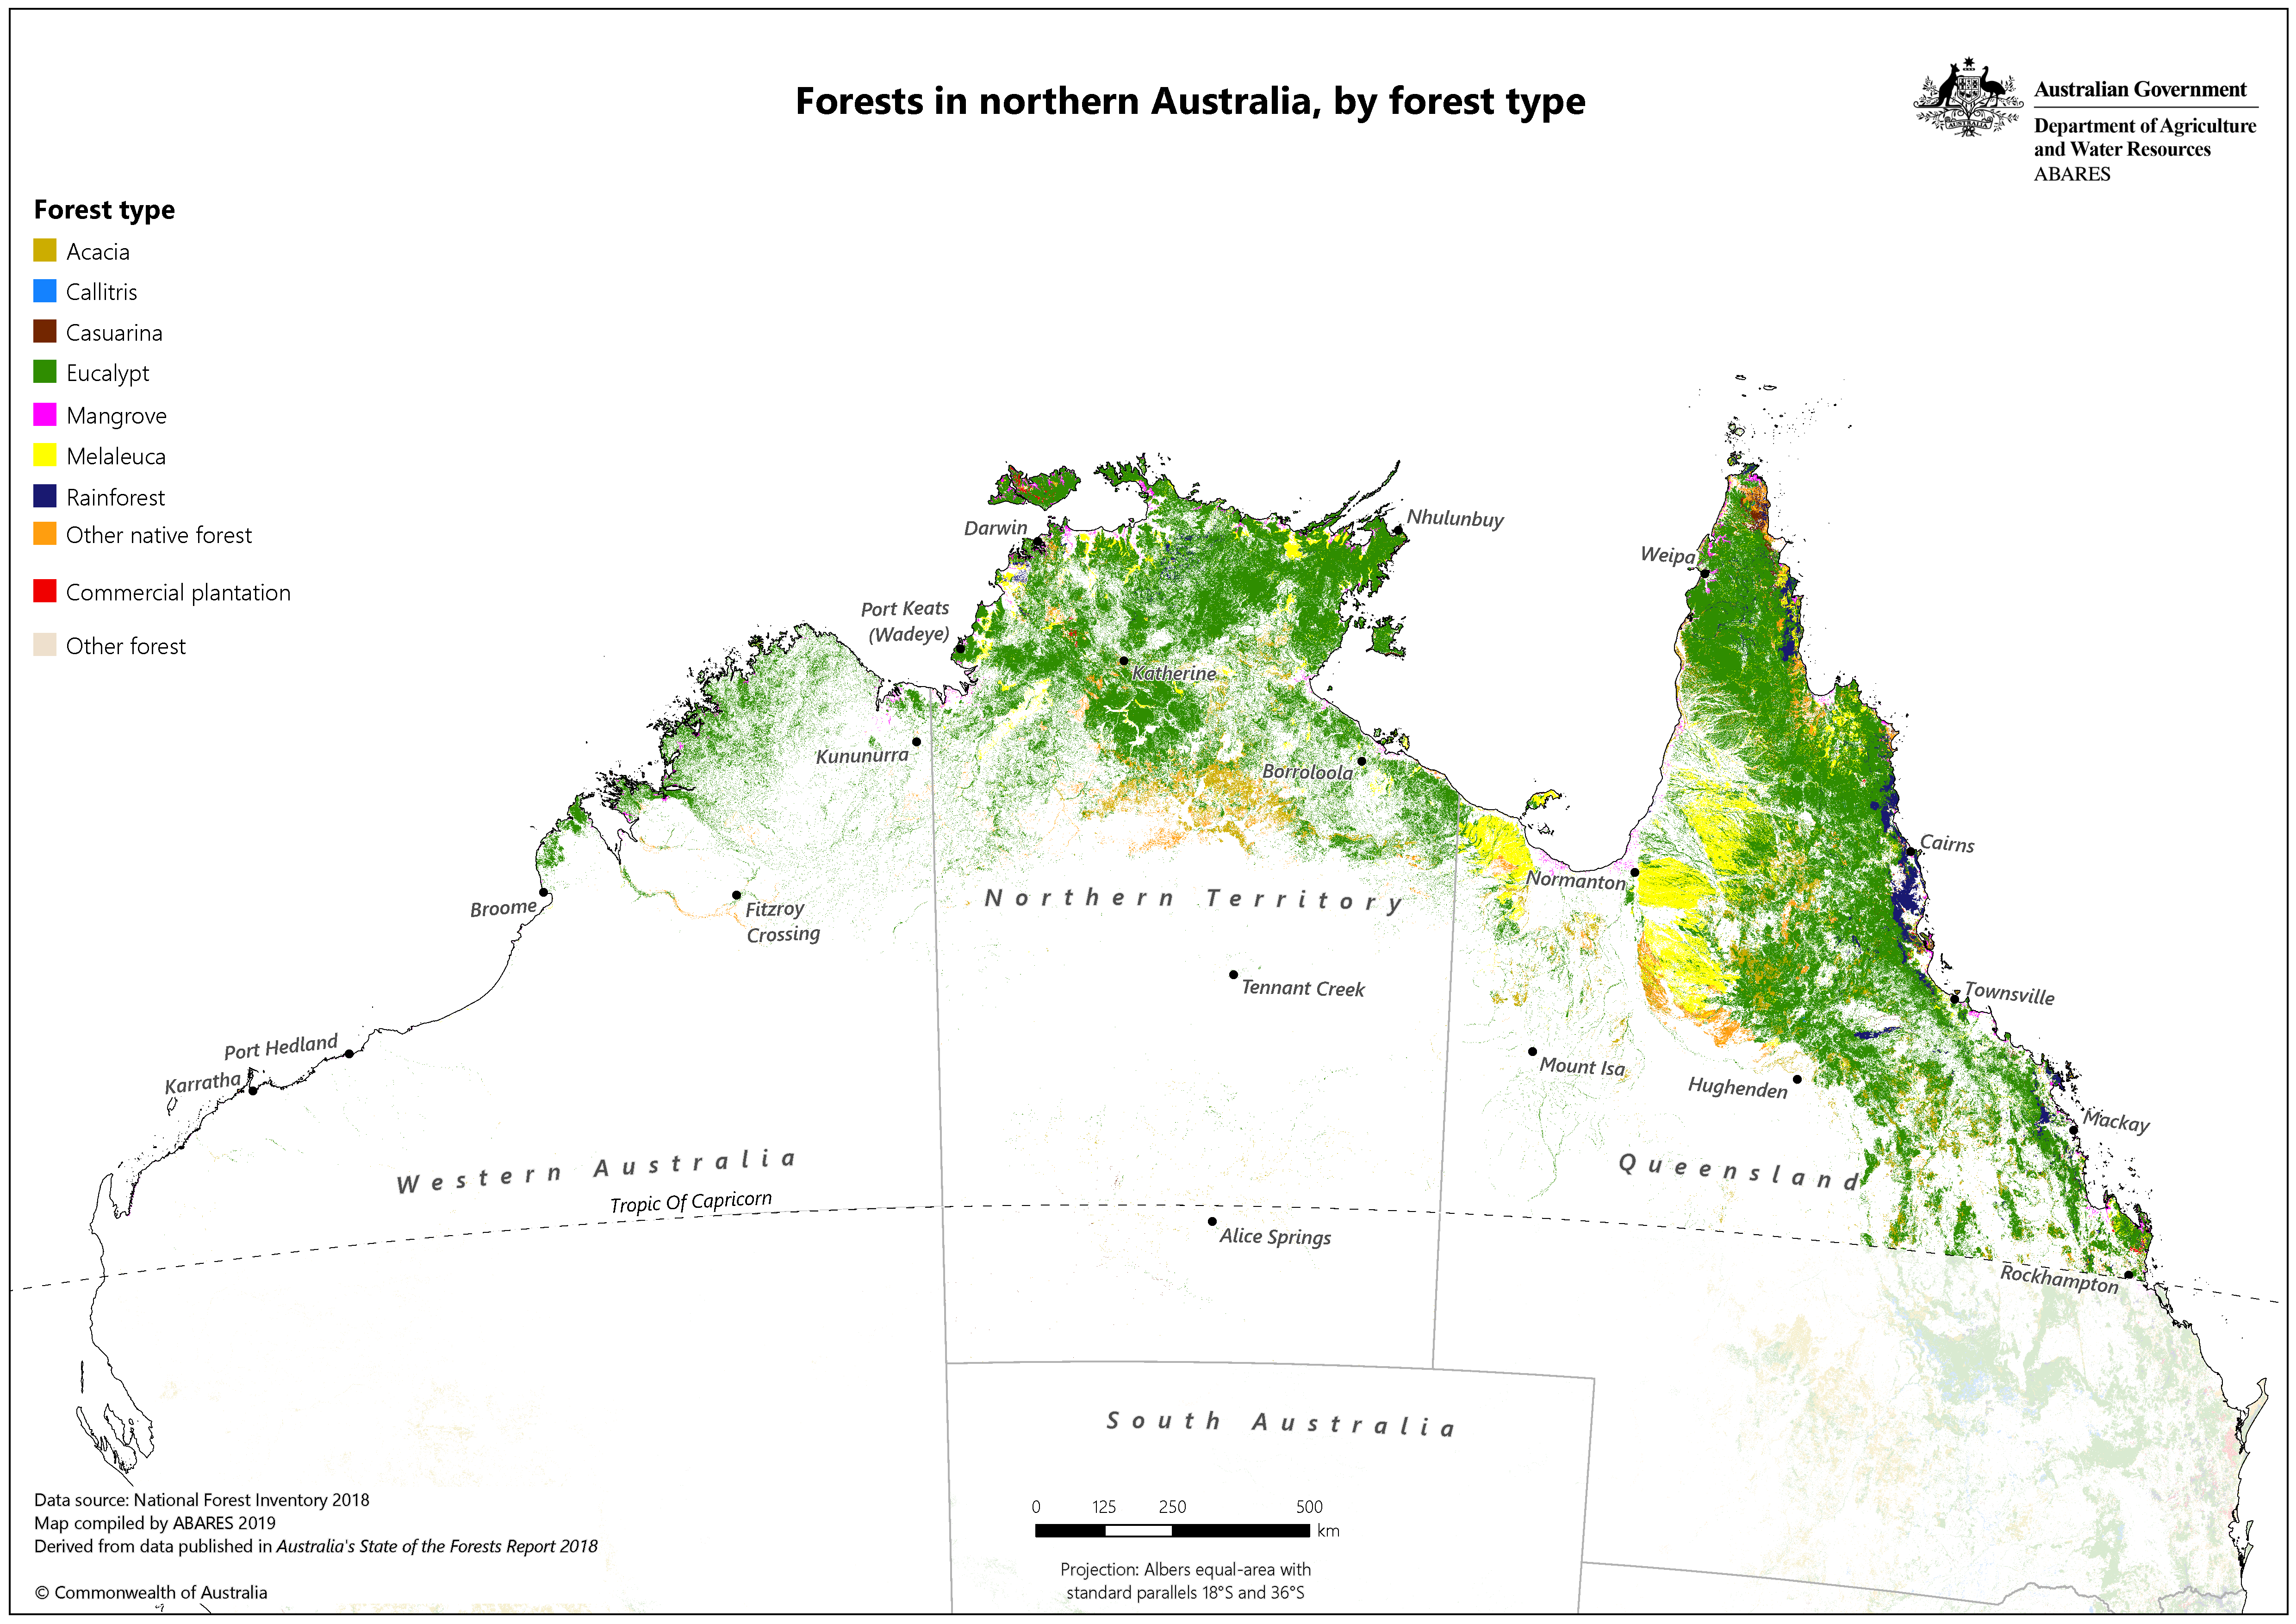
The following maps of forests in northern Australia were prepared in 2019 by ABARES for an analysis by the CRC for Developing Northern Australia. The extent of northern Australia in this analysis includes Western Australia and Queensland north of the Tropic of Capricorn and the entire Northern Territory.

Forests in northern Australia, by forest type
This map shows the distribution of forests in northern Australia, by forest type: PNG [1.4 MB], PDF [0.9 MB].
Forests in northern Australia, by forest subtype
This map shows the distribution of forests in northern Australia, by forest subtype: PNG [1.7 MB], PDF [1.0 MB].
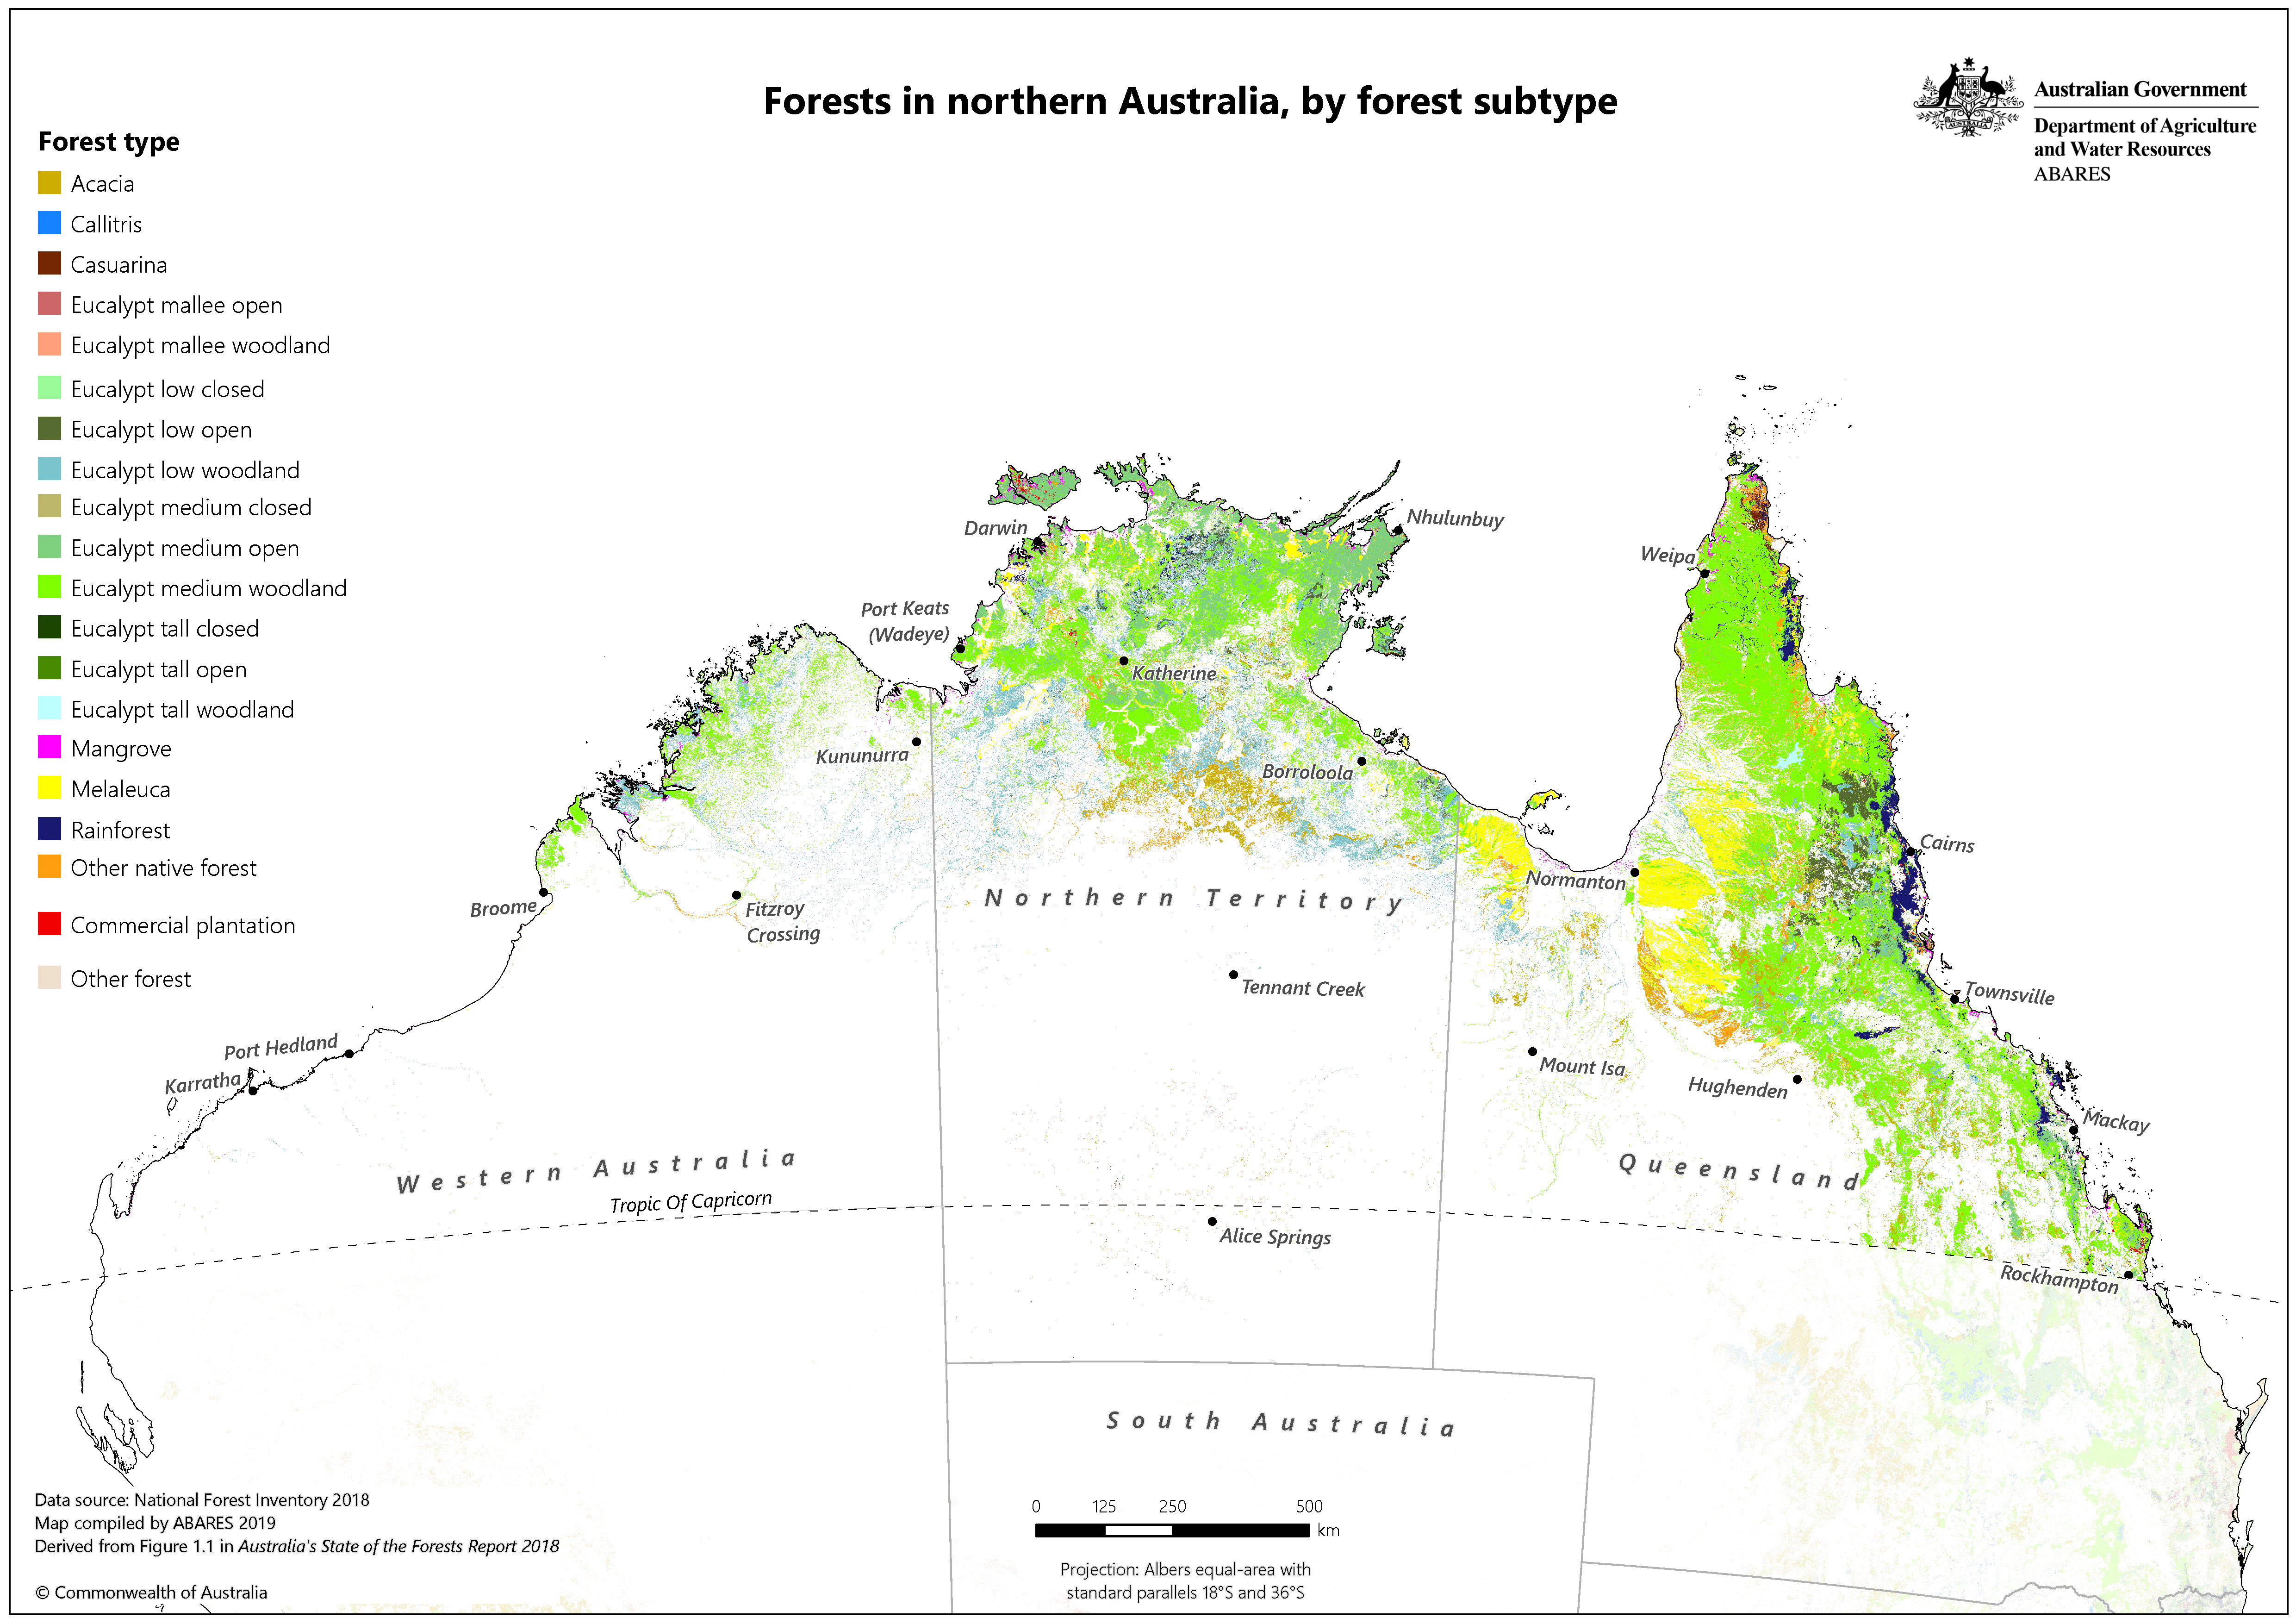
Forests in northern Australia, by forest tenure
This map shows the distribution of forests in northern Australia, by forest tenure: PNG [1.3 MB], PDF [0.8 MB].
The Indigenous forest estate, by land ownership and management category for northern Australia
This map shows the distribution of the Indigenous forest estate, by land ownership and management category for northern Australia: PNG [1.2 MB], PDF [0.8 MB].
Native forest available and suitable for commercial wood production in northern Australia
This map shows the distribution of native forest available and suitable for commercial wood production in northern Australia: PNG [1.3 MB], PDF [0.8 MB].
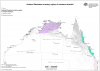
National Plantation Inventory regions of northern Australia
This map shows the location of National Plantation Inventory regions in northern Australia: PNG [1.0 MB], PDF [0.7 MB].
View interactive maps of Australia's key spatial forest datasets in ArcGIS Online map viewer:
- Forests of Australia
- Tenure of Australia's forests
- Australia's Indigenous land and forest estate (Indigenous forest estate)
- Australia's Indigenous land and forest estate (Indigenous land estate)
- Fires in Australia's forest 2016–21 (burn by frequency)
- Fires in Australia's forest 2016–21 (burn by fire type, planned/unplanned)
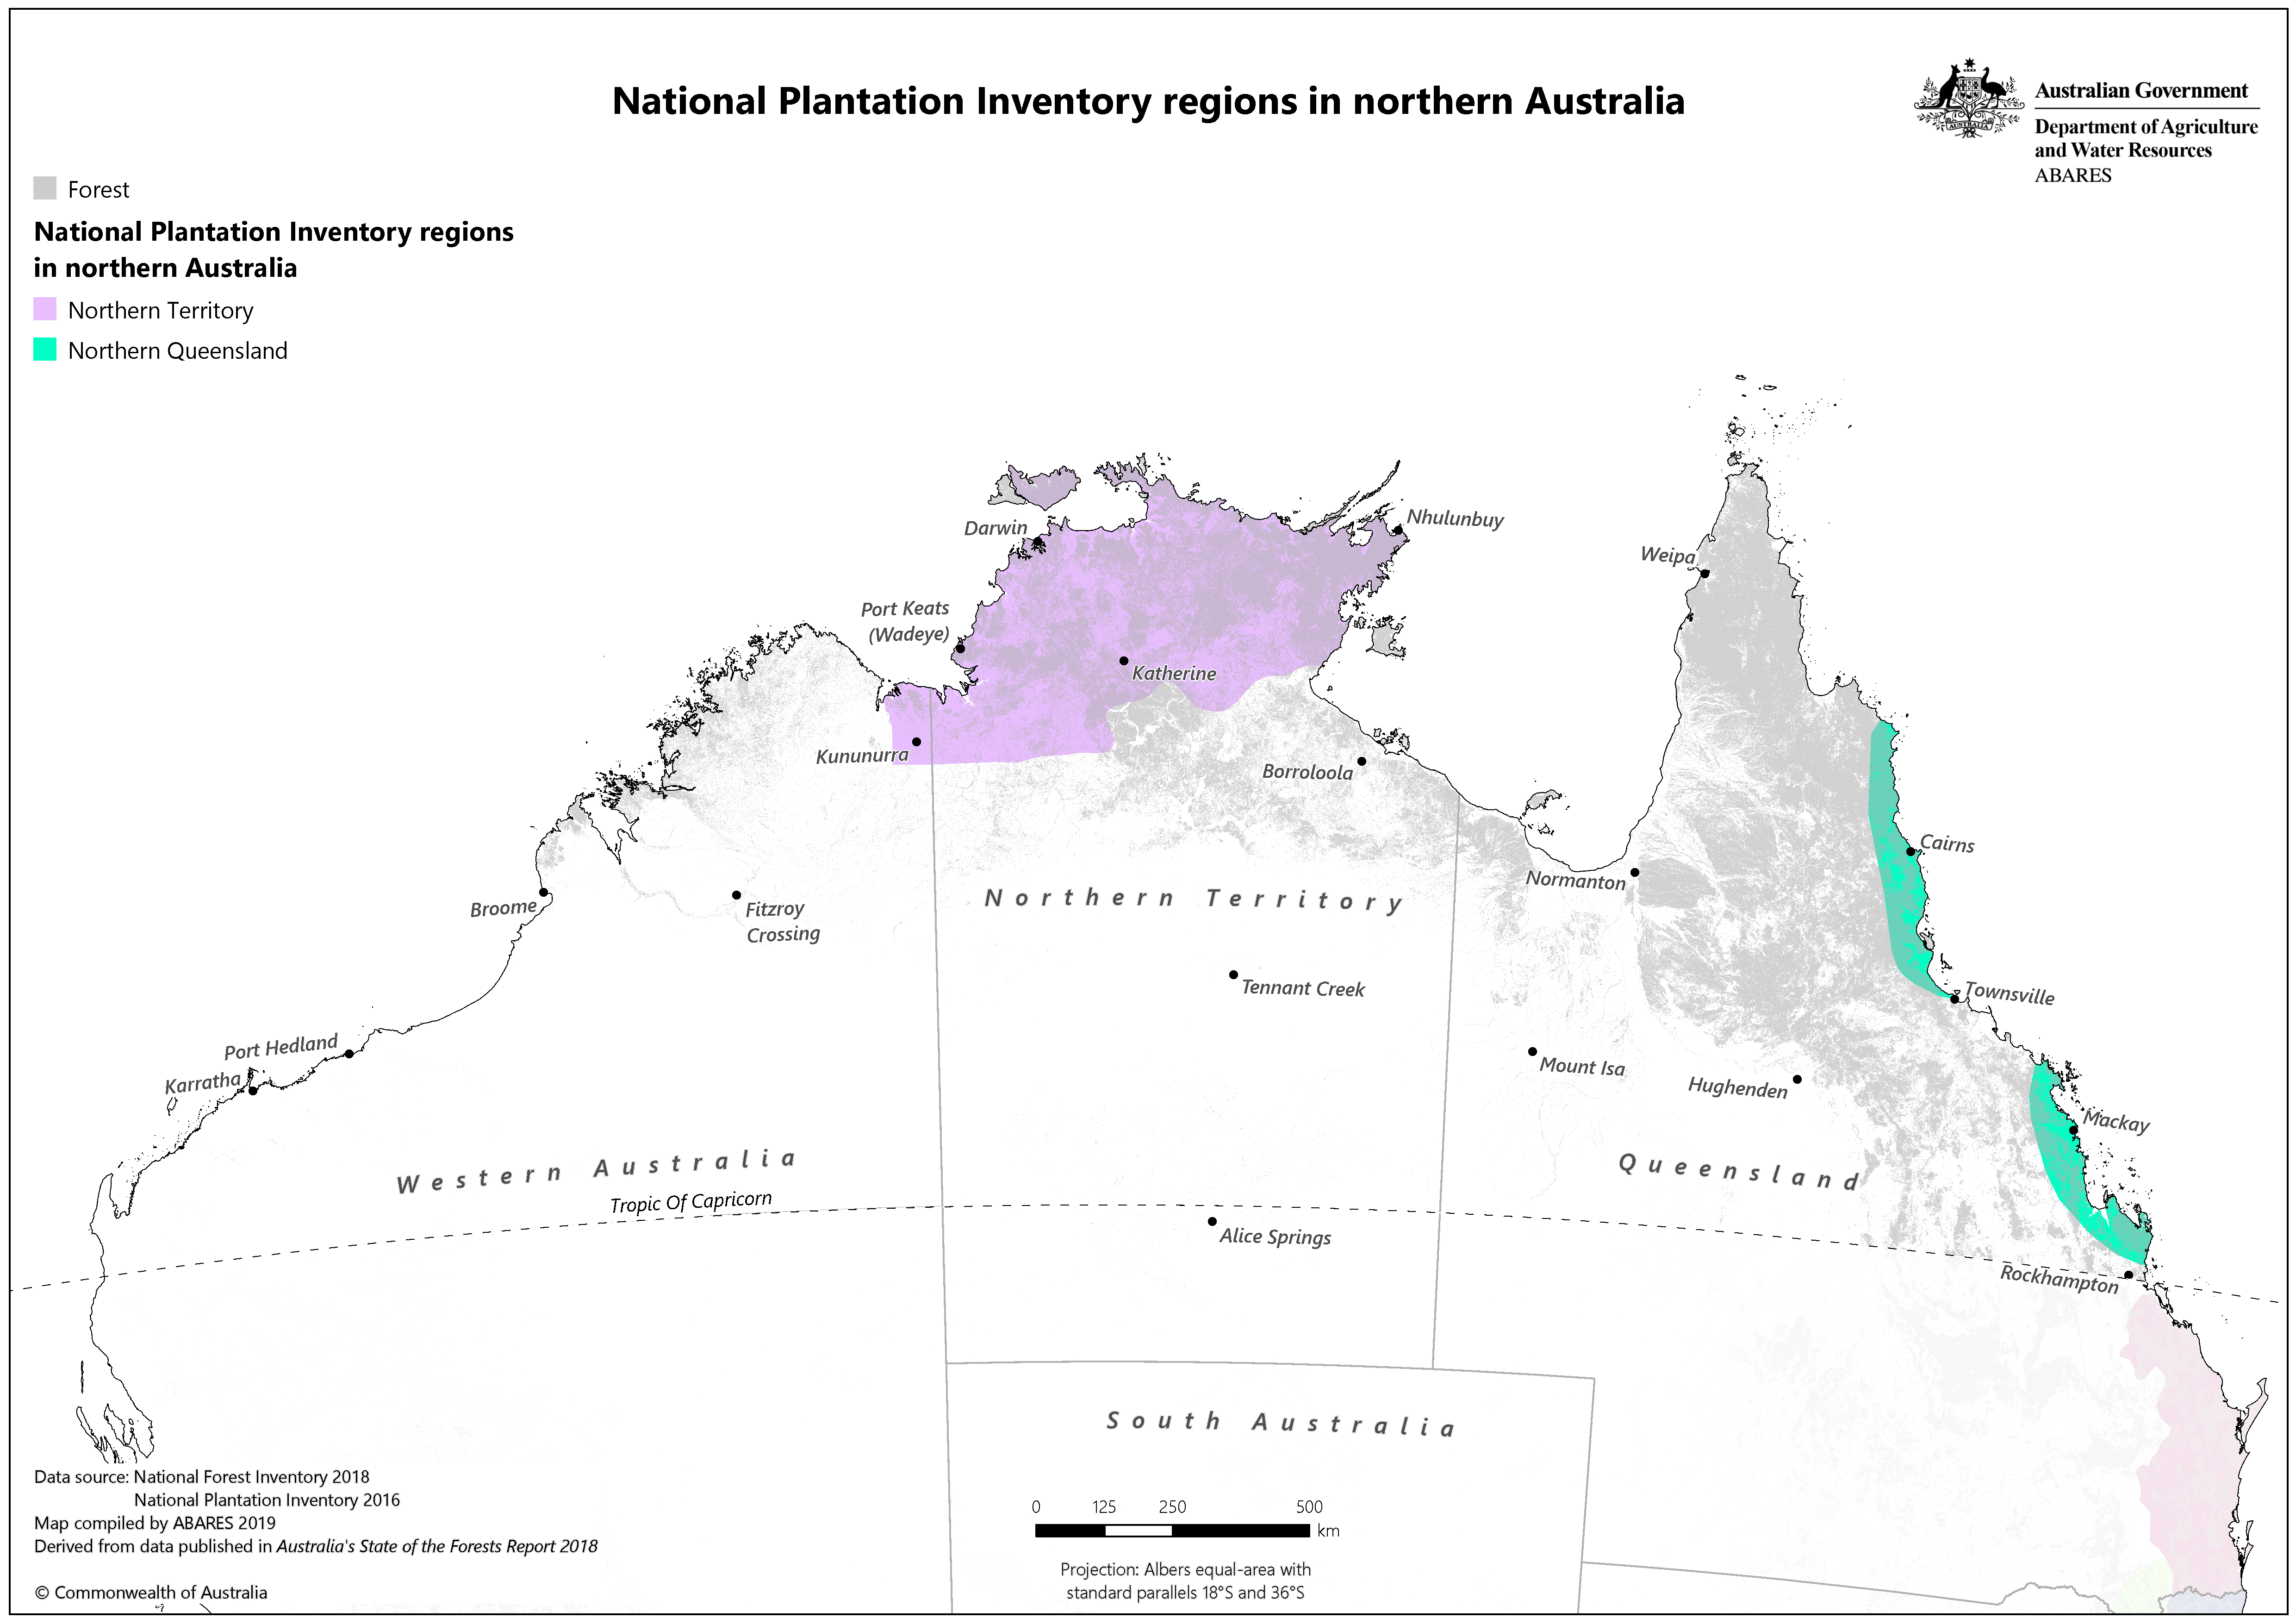
Boundary maps for the eleven Regional Forestry Hubs are hosted on the Department of Agriculture, Fisheries and Forestry website along with information about the Regional Forestry Hubs.
Regional Forestry Hubs boundaries (2022) is the spatial dataset of the boundaries for the Regional Forestry Hubs.
The Regional Forestry Hubs were created under the National Forest Industries Plan [PDF 3.1 MB] and associated budget measures to identify economic and social opportunities and benefits in regions with existing concentrations of wood supply resources, processing and/or manufacturing operations, established transport links, and strong potential for growth.
Regional Forestry Hubs map – graphic only – PDF [0.6 MB]
Regional Forest Agreements (RFAs) are long-term Commonwealth–state agreements for the conservation and sustainable management of specific regions of Australia’s native and plantation forests. The Regional Forest Agreements and Comprehensive Regional Assessment dataset defines the areas that were supplied by states for the Regional Forest Agreements process and includes RFA regions in New South Wales, Tasmania, Victoria and Western Australia, and for Queensland a Comprehensive Regional Assessment region.