Skip to main content Skip to main navigation Skip to search
ABARES

Top navigation abares

  • Department
  • Ministers
  • Media Centre
Main menu

Main navigation ABARES

  • ABARES Home
    ABARES Home
  • About
    About
  • Research topics
    Research topics
  • Products
    Products
  • Data
    Data
  • News
    News
  • Conferences and events
    Conferences and events
  • Careers
    Careers
Department of Agriculture

Breadcrumb

  1. DAFF Home
  2. ABARES
  3. Research topics
  4. Natural fibres

Secondary ABARES

  • Research topics
    • About my region: regional profiles
    • Agricultural outlook
      • Agricultural Commodities Report March 2025
      • Australian crop report
        • Australian Crop Report March 2025
      • Commodities and trade data
      • Historical agricultural forecast database
      • Definitions
      • Previous reports
    • Biosecurity
      • Biosecurity economics
        • Cost of established pest animals and weeds to Australian agricultural producers
        • Potential economic consequences of African swine fever in Australia
        • A benefit-cost framework for responding to Varroa
        • Benefits of increased access to minor use chemicals
        • Biosecurity control strategies for red imported fire ants
        • Biosecurity response options for black-striped mussel
        • Consequences of a foot-and-mouth disease outbreak
        • Consequences of a foot-and-mouth disease outbreak - 2022 update
        • Economic consequences of a scrapie outbreak in Australia
        • Economic impacts of Xylella fastidiosa on the Australian wine grape and wine-making industries
        • Estimating the value of Australian biosecurity arrangements for equine influenza since the 2007 outbreak
        • Farm gate value of biosecurity
        • Potential impact of the wheat steam rust strain Ug99 in Australia
        • The impacts of Xylella fastidiosa on Australian horticulture and the environment
      • Biosecurity sciences
        • Potential distribution of the invasive marine species Magallana ariakensis (Suminoe river oyster) in Australia
        • Potential distribution of the invasive marine species Didemnum vexillum (carpet sea squirt) in Australia
        • Potential distribution of the invasive marine species Potamocorbula amurensis (Amur River clam) in Australia
      • Biosecurity engagement
    • Climate and drought
      • Agricultural Data Integration Project
      • Farm performance and climate
      • Measuring drought risk
    • Fisheries
      • Fishery status reports
      • Fisheries and aquaculture statistics 2022
        • Australian fisheries and aquaculture production
        • Australia’s trade in fisheries and aquaculture products
          • Market access improvements: A case study of stone fruit exports to China
        • Seafood consumption in Australia
        • Employment in Australian fisheries and aquaculture
        • About this report
        • Other useful information
        • Economic concepts in Australian fisheries and aquaculture statistics
      • Fisheries data
      • Fisheries economics
        • Australian fisheries and aquaculture outlook
        • Australian fisheries economic indicators
      • Fisheries research
        • Commonwealth Fisheries Harvest Strategy Policy and Commonwealth Fisheries Bycatch Policy Implementation Review
        • Shark Assessment Report 2022
        • Analyses to support the review of the Southern Squid Jig Fishery harvest strategy
    • Food demand in Australia
      • Trends and issues 2018
      • Trends and food security issues 2017
    • Forests
      • Forest economics
        • Australian forest and wood products statistics
        • Forest economic research
          • Australian wood volumes analysis
          • A framework for developing medium term projections of traded wood products
          • Economic potential for new plantation establishment in Australia
          • Future opportunities for using forest and sawmill residues in Australia
          • Illegal logging regulation: analysis of regulated importers by business size
          • Productivity and efficiency of the Australian sawmilling industry
          • Responsiveness of demand for structural pine to changes in timber and steel prices
          • Short-term forecasts of selected wood product sales volume: Method and assumptions
          • Upscaling the Australian softwood sawmill industry
        • Australian plantation statistics update
        • Plantation and log supply
        • National wood processing survey
      • Forest sciences
      • Forest data
      • Forests overview
    • Invasive species
      • National Feral Pig Current Distribution in Australia
      • Distribution and impacts of established pest animals and weeds
      • Exotic invasive species with environmental impacts
      • Prioritising targets for biological control of weeds
      • The National Priority List of Exotic Environmental Pests, Weeds and Diseases dataset
      • The state of weeds data collection in Australia
      • Wild dog research
    • Agricultural workforce
      • At a glance
      • Labour use surveys
      • Agricultural workforce data
      • Research
    • Land Use
      • Land use of Australia 2010–11 to 2020–21
      • Catchment scale land use of Australia and commodities - Update December 2023
      • Catchment scale land use profiles
    • Farm productivity
      • ABARES Farmland Price Indicator
      • R&D Investment
      • Agricultural productivity estimates
      • Productivity drivers
      • Productivity introduction
      • Productivity publications
    • Social sciences
      • Australian marine pest network analysis
      • Biosecurity research
      • Climate research
      • Community engagement
      • Community involvement in plant biosecurity
      • Human dimensions research
      • Making general surveillance work
        • General surveillance case study overviews
        • Guidelines for general surveillance programs
        • Literature review: Understanding general surveillance as a system
        • Research report: Making general surveillance programs work
        • Stocktake of general surveillance initiatives
      • Natural resource management
      • Pest animals and weed management survey
      • Recreational boat operators’ self-management of biofouling in Australia
      • Social aspects of weed management
      • Social impact assessment
      • General surveillance program design, monitoring and evaluation guide
    • Farm performance
      • Dairy farm performance
      • Farm survey data
      • Disaggregating farm performance statistics by size
      • Previous research
    • Trade
      • Climate, sustainability & agricultural trade
      • Trade facilitation, barriers and NTMs
      • Future value chain opportunities
        • Foreign Direct Investment in Australian Agriculture
      • Dashboard (beta)
    • Water
      • Community vulnerability and adaptive capacity in the Murray Darling Basin
      • The impacts of further water recovery in the southern Murray–Darling Basin
      • 2024: Environmental water trade – Making every drop count.
    • Agricultural forecasting
      • Changes to reporting of marketing year data
      • Farm share and price spread
      • Farmers' terms of trade: Update to farm costs and prices paid
      • Forecasting national grain stocks in times of drought
      • Seasonal climate scenarios for medium-term forecasts
      • Summary of ABARES agricultural forecasting
      • The future of public sector forecasting in Australian agriculture
    • Working papers
      • Technical improvements to GTEM: Sticky livestock capital and resources costs for land sequestration and abatement technologies
      • A micro-simulation model of irrigation farms in the southern Murray-Darling Basin
      • A model of spatial and inter-temporal water trade in the southern Murray-Darling Basin

Natural fibres

​​Michael Dylewski

The world cotton indicator price is forecast to decrease by 12 per cent to 77 US cents per pound in 2019–20, reflecting high stock levels and competition from synthetics. The Eastern Market Indicator price for wool is forecast to decrease by 7 per cent to 1,636 Australian cents per kilogram in 2019–20 as higher volumes of wool come to market.

Global textile demand to remain strong

Income and population growth in key markets will support global deman​d for cotton‑based and woollen textiles over the outlook period to 2023–24.

Expansion of the global middle‑class consumer base in emerging economies will drive an increase in purchases of cotton‑based textiles and apparel. Income growth is expected to slow in most advanced economies but to increase more strongly in many emerging and developing economies, including China, India and South‑East Asia.

Demand for wool is derived from consum​er demand for high value woollen textiles and clothing. Assumed income growth in major wool-consuming markets—including China, the European Union and the United States—will underpin the expected strengthening of global demand for wool.

Lower cotton production to keep prices high

World cotton stocks remain high following an accumulation of stocks between 2009–10 and 2013–14 and again in 2016–17 when production rose in almost all major cotton-producing countries. In 2018–19 world cotton production is expected to fall due to declines in China, India, Pakistan and the United States more than offsetting higher production in Brazil. In 2019–20 and 2020–21 the global area planted to cotton is forecast to fall slightly in response to lower prices, before increasing gradually over the medium term to 2023–24. The average global lint yield is projected to increase slowly over the outlook period, in line with the historical trend.

World cotton consumption is forecast to grow strongly in 2018–19 and to outpace growth in world production until 2021–22, before world cotton production strengthens to 2023–24. This sustained period of consumption growth is projected to lead to a reduction in world stocks over the medium term.

World cotton prices are relatively high compared with recent years and are expected to remain high for the remainder of 2018–19 as a result of strong demand. However, high stock levels and competition from synthetic fibres are forecast to lead to a softening of prices between 2019–20 and 2020–21 before prices recover gradually over the remainder of the outlook period.

Total Australian cotton production is forecast to decrease significantly in 2018–19, driven by a decline in the area planted to cotton as a result of significantly reduced water levels in irrigation dams and very low levels of stored soil moisture.

Australian cotton production and exports are projected to remain unchanged over the outlook period to 2023–24. Production growth will be constrained by the availability of irrigation water following two years of dry seasonal conditions in eastern Australia. The last 3 recharge events for irrigation dams in the main cotton-producing regions occurred in La Niña years—events that cannot be predicted over the medium term. However, any future increase in irrigation water availability from such an event would present an upside risk to cotton production and exports.

Australian wool production to fall as prices stay high

Total Australian wool production and exports are forecast to fall in 2018–19. Continuing dry seasonal conditions across most wool‑growing regions are expected to reduce the number of sheep shorn nationally and the average wool cut per head. From 2019–20 the sheep flock is forecast to begin recovering and increase each year to 2023–24. This will lift wool production and exports over the outlook period.

The Eastern Market Indicator (EMI) price for wool—a weighted average price across different wool types—is forecast to increase in 2018–19. Wool prices are currently high compared with recent years, especially in US dollar terms—the currency predominantly used to purchase Australian wool. The EMI declined slightly in late 2018 but is expected to recover over the remainder of 2018–19 as the supply of wool falls.
In 2019–20 the EMI is forecast to fall, reflecting expected higher volumes of wool coming to market as flock rebuilding commences. The current high EMI is creating an incentive for processors to substitute away from wool for synthetic fibres, which can be blended with medium micron wools (20.6 to 22.5 microns). For the remainder of the outlook period, price growth will be constrained by continuing growth in flock numbers and wool production to 2023–24.

Eastern Market Indicator (EMI), 1990–91 to 2023–24
Shows historic trends in the Eastern Market Indicator (EMI) price for wool in real Australian dollar and US dollar terms from 1990−91 to 2017−18 and forecasts/projections to 2023−24. Both measures fluctuated generally in line and trended upwards, and in 2017−18 both were at high levels: Australian dollar 1,759 cents per kilogram; US 1,367 cents per kilogram. The Australian dollar EMI is forecast to increase slightly in 2018−19 and decrease in 2019−20. The US dollar EMI is forecast to decrease in 2018−19 and 2019−20. Both measures are projected to increase each year until 2023−24 and remain historically high between 2018−19 and 2023−24.

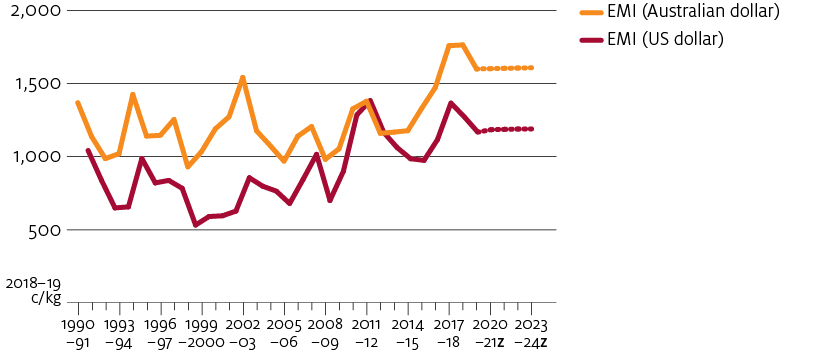
z ABARES projection.
Source: ABARES

Dry conditions increase superfine wool supply

The 2018–19 forecast of lower total Australian wool production is not expected across all wool types. Of the wool tested as at January 2019, the supply of fine and medium wools (18.6 to 22.5 microns and traditionally favoured by many Chinese processors) fell by about 25% year‑on‑year. Dry seasonal conditions have pushed the average micron of these wools lower. This has resulted in a higher supply of lower quality superfine wools (18.5 microns or less) coming onto market.

The staple strength of drought‑affected wools has held up well but the increasing supply of lower quality superfine wool is assumed to continue to 2023–24. This is likely to influence the variation in prices across different wool grades and put pressure on finer grade wool premiums.

Change in wool testing volumes, Australia, July 2018 to January 2019
Shows percentage change in the volume of wool tested in Australia for 13 micron bands in the range ‘less than 12.6 microns’ to ‘over 30.6 microns’ between July 2018 and January 2019. Wool grades are classified as: superfine (18.5 microns and less); fine (18.6 to 20.5 microns); medium (20.6 to 22.5 microns); and broad (22.6 microns and higher). Testing of wool increased in 4 micron bands: less than 12.6 microns (by 105 per cent); 16.6 to 17.5 microns (by 18 per cent); 17.6 to 18.5 microns (by 2 per cent); and 24.6 to 26.5 microns (by 5 per cent). Testing of wool in the other 9 micron bands decreased by various amounts, ranging from 6 per cent to 39 per cent.

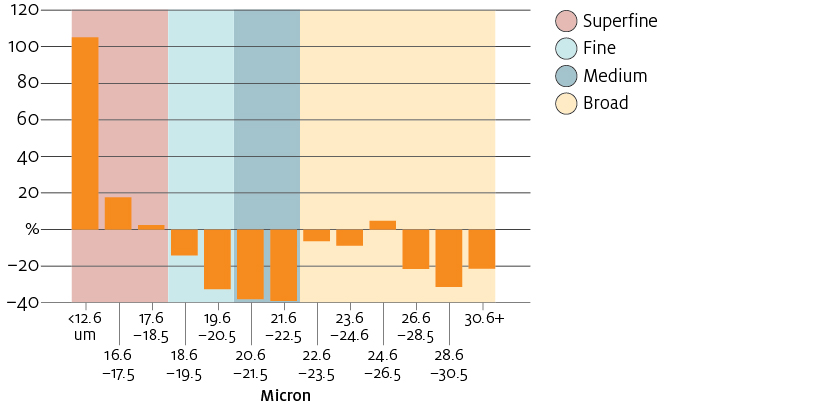
Notes: Year-on-year percentage change in bales of wool tested.
Sources: Australian Wool Testing Authority; Australian Wool Innovation Limited

Opportunities and challenges

Trade tensions create uncertainty

The United States is a major importer of textiles and clothing processed in China. The global impact of the trade tensions between the United States and China on world textile demand and trade remains uncertain and contingent on many factors. These include the extent of any future retaliatory import tariffs imposed by these countries and whether global trade tensions broaden to include other nations. A decline in Chinese demand for natural fibres would likely impact Australia’s wool industry more severely as Australia exports cotton to a broader range of countries than it does wool.

The effect of the trade tensions on Chinese consumers, who represent a substantial and rapidly growing final market for apparel, has been mixed. Consumer confidence and (to a lesser degree) garment sales declined in China between February and August 2018 but recovered strongly in the remaining months of 2018. These data indicate that Chinese demand for textiles and clothing—which directly influences demand for Australian natural fibres (wool in particular)—may not necessarily weaken if trade tensions continue.

Consumer confidence index, June 2014 to December 2018

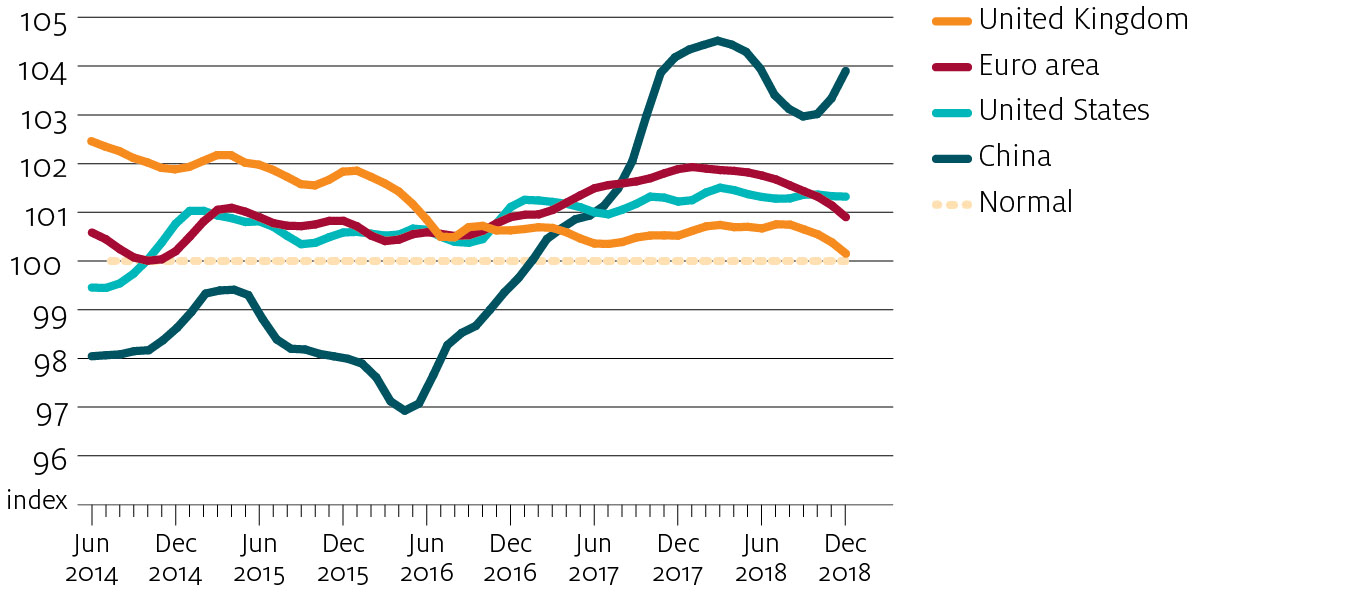
Notes: Amplitude‑adjusted. Normal (long‑term average) = 100. An indicator above 100 signals a boost in consumers' confidence towards the future economic situation.
Euro area comprises Austria, Belgium, Cyprus, Estonia, Finland, France, Germany, Greece, Ireland, Italy, Latvia, Lithuania, Luxembourg, Malta, the Netherlands, Portugal, Slovakia, Slovenia and Spain.
Source: Organisation for Economic Co‑operation and Development

Competition from substitute fibres

Competition from substitutable synthetic fibres, such as polyester, remains a risk to cotton markets in light of current high cotton prices. Relatively low oil prices in recent years have increased the price competitiveness of synthetic fibres against cotton. An assumed small decrease in oil prices in 2019–20, influenced partly by global trade tensions, could put downward pressure on cotton prices. If oil prices remain relatively low over the outlook period, the projected recovery of cotton consumption could be adversely affected because of greater substitution towards synthetics.

Synthetic fibres are also substitutable with medium micron wool. Current high wool prices create an incentive for textile manufacturers to substitute lower cost fibres. This incentive presents a downside risk to demand for Australia's medium micron wool exports and wool prices.

More broadly, evolving tastes and preferences continually influence the production and consumption of natural fibres, often in ways that are difficult to estimate and cannot be factored into a medium-term forecast. For example, animal welfare and social and environmental concerns have the potential to decrease wool demand. Similarly, increasing awareness of the environmental impact of synthetic garments can encourage cotton use in textiles and clothing.

Price indexes of substitute fibres, July 2014 to January 2019
Shows historic trends in price indexes of wool, cotton, polyester staple and acrylic staple from July 2014 to January 2019. The wool price index trended upwards until August 2018; decreased until November 2018; increased in December 2018 and January 2019; and remains at high historical levels, higher than the other 3 fibres.  The cotton price index trended upwards until June 2018 and decreased between July and January 2019. Polyester and acrylic price indexes have fluctuated over the period. In September 2018 both indexes were slightly higher than their July 2014 level, but lower than the cotton price index.

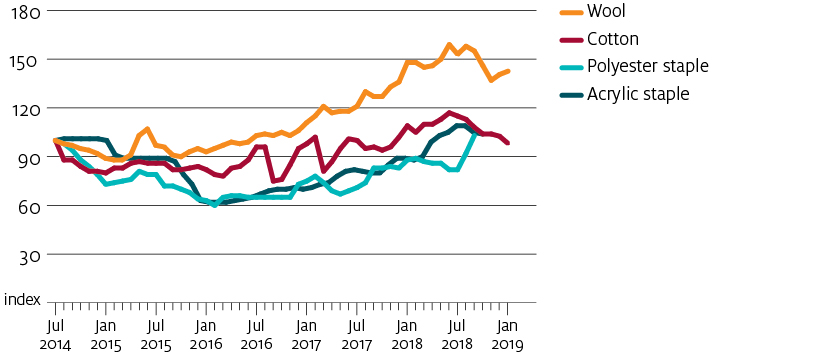
Notes: July 2014 = 100. Eastern Market Indicator, Cotlook 'A' Index, Chinese polyester staple fibre (1.5 denier) and North Asian acrylic staple fibre (1.5 denier). Data for polyester staple and acrylic staple available until September 2018.
Sources: Australian Wool Exchange; Cotton Outlook; Fibre2Fashion

Cotton support policies remain significant

Government support policies in major cotton-producing countries play an ongoing role in influencing cotton demand and global trade.

China's cotton stocks can have a major influence on the world cotton market. The country's support policies for its domestic cotton industry, including the level of its stocks and timing of stock drawdowns, remain a source of uncertainty over the outlook period. Any changes to China's cotton policies would have important implications for world textile markets and on regional cotton industries.

In 2018 China reduced its cotton stocks considerably following 3 years of aggressive selling. The US Department of Agriculture forecasts that China's closing stocks of cotton will decrease by about 20% in 2018−19. If China continues to reduce its stocks, it could put downward pressure on its demand for imported cotton, and cotton prices, in the short term.

In India and major cotton-producing countries in Central Asia, government policies promote investment in textile industries and contribute to exports of textile products rather than raw cotton. For example, the Gujarat state government in India recently announced the removal of incentives to support ginning and spinning, with funding redirected to processing. The impact of this policy on Australia's competitiveness in cotton export markets is likely to be minimal given Australia's comparative advantages in producing high‑quality cotton rather than processing.

Download

DocumentPagesFile size
Natural fibres outlook – March 2019 PDF6742 KB
Forecast data – March 2019 XLS1265 KB
Historical data – March 2019 XLS​451.4 MB

If you have difficulty accessing these files, please visit web accessibility.

​​​​​
Thanks for your feedback.
Thanks! Your feedback has been submitted.

We aren't able to respond to your individual comments or questions.
To contact us directly phone us or submit an online inquiry

CAPTCHA
This question is for testing whether or not you are a human visitor and to prevent automated spam submissions.

Please verify that you are not a robot.

Skip
Page last updated: 04 November 2019

We acknowledge the continuous connection of First Nations Traditional Owners and Custodians to the lands, seas and waters of Australia. We recognise their care for and cultivation of Country. We pay respect to Elders past and present, and recognise their knowledge and contribution to the productivity, innovation and sustainability of Australia’s agriculture, fisheries and forestry industries.

Artwork: Protecting our Country, Growing our Future
© Amy Allerton, contemporary Aboriginal Artist of the Gumbaynggirr, Bundjalung and Gamilaroi nations.

Footer

  • Contact us
  • Accessibility
  • Disclaimer
  • Privacy
  • FOI

© Department of Agriculture, Fisheries and Forestry

Facebook X LinkedIn Instagram